SPONSOR: Labrador Gold – Two successful gold explorers lead the way in the Labrador gold rush targeting the under-explored gold potential of the province. Exploration has already outlined district scale gold on two projects, including a 40km strike length of the Florence Lake greenstone belt, one of two greenstone belts covered by the Hopedale Project. Click Here for More Info
- GDX and GDXJ are consolidating bullishly within a now seven-year-long base
Last week, I covered the historical trajectory of the gold stocks and how today compares to the early 1960s.
The late 2015 to early 2016 period marked one of the three best buying opportunities of the past 100 years (from a secular standpoint), and gold stocks are in position for sensational performance over the next 20 years.
That sounds great, but what matters most is the here and now. We do not want to get caught in a cyclical downturn (which could occur more than once during this super bull).
Fortunately, the outlook over the next 12 to 18 months is bullish. The macro-fundamentals are supportive and improving, and the gold stocks now have a beautiful technical setup that could lead to massive gains.
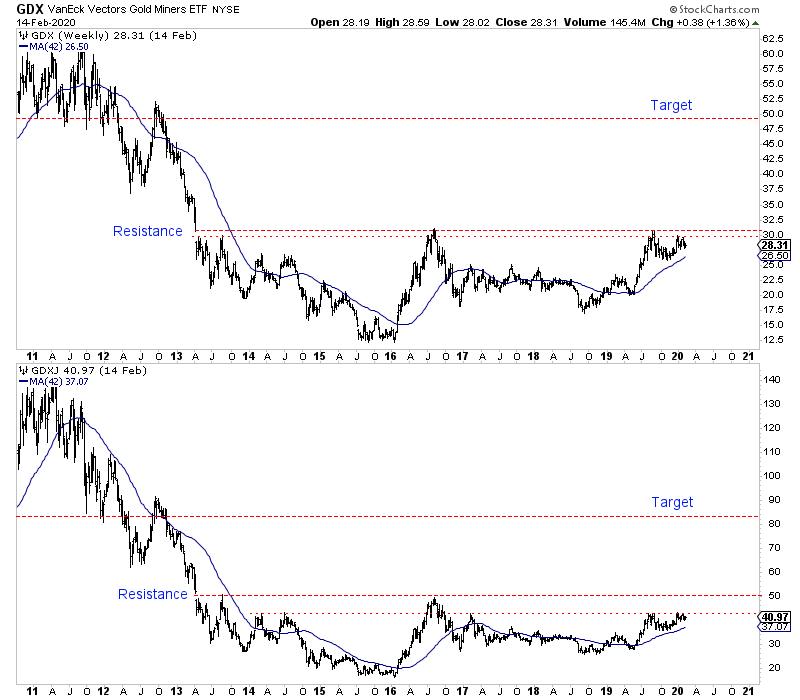
GDX and GDXJ are consolidating bullishly within a now seven-year-long base. They are digesting recent gains while holding well above key support levels and are in position for an eventual explosive breakout.
Historically, there have not been many multi-year breakouts with the potential magnitude of this next one. In using the Barron’s Gold Mining Index, I only find three.
The breakout in 1964 was a historic, multi-decade breakout that ushered in an enormous bull market in gold stocks. It was the most significant inflection point ever for gold stocks.
Later during that bull market, the gold stocks broke a 5-year downtrend and 5-year resistance in 1973, exploding higher.
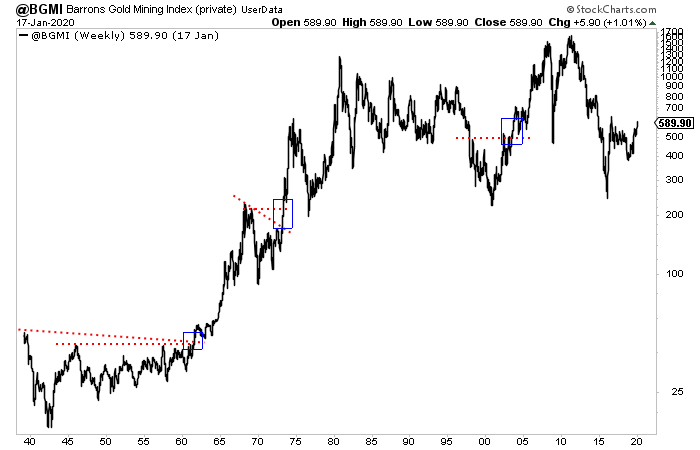
The 2005 breakout compares best with the potential next one.
Like the one in 2005, this next one is setting up several years after a secular low, following one of the worst bear markets of the past 90 years.
Also, this next breakout could occur following a +7 year-long base, which is not too far from the +9 year base that was broken in late 2005.
Furthermore, the May 2005 low is similar to September 2018 in that both followed a mini-bear market that lasted at least 18 months.
We plot the NYSE Arca Gold Miners Index, which is the parent index of GDX.
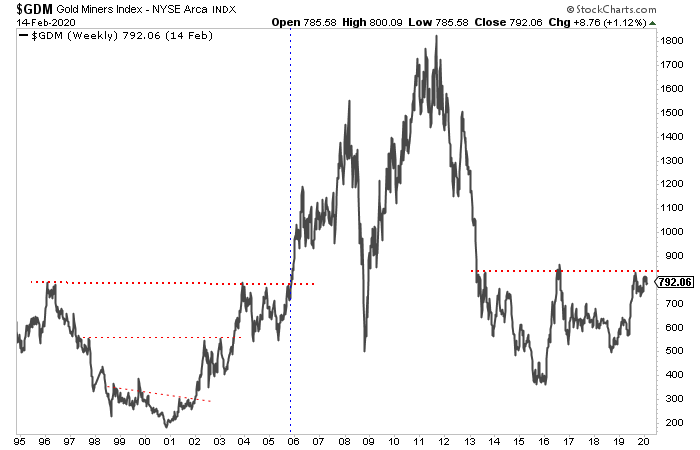
Since there are similarities in the setup, perhaps the upside potential from a new breakout could be similar to that which followed the 2005 breakout.
I want to focus on GDXJ because we invest in juniors and not seniors. The history of GDXJ back to January 2004 is available on this website.
From its May 2005 low to its peak in November 2007, GDXJ advanced nearly 4-fold. Once GDXJ surpassed its January 2004 peak, it gained 138% into that 2007 peak.
GDXJ closed last week just below $41. The measured upside target from a break past $50 is $83. If GDXJ today duplicated its performance before and after the 2005 breakout, then it would peak at $100 or $115.
If we get the breakout, then $83 becomes the minimum upside target. In that case, $100 or $115 is hardly a stretch.
SOURCE: https://thedailygold.com/the-last-big-breakout-in-gold-stocks-what-it-means-today/
Tags: #Ashuanipi, #Discovery, #Drilling, #Greenstone, #Hopedale, #LAB, #Labrador, #LabradorGold, #Newfoundland, #Plethora, #ShawnRyan