
SPONSOR: Labrador Gold – Two successful gold explorers lead the way in the Labrador gold rush targeting the under-explored gold potential of the province. Exploration has already outlined district scale gold on two projects, including a 40km strike length of the Florence Lake greenstone belt, one of two greenstone belts covered by the Hopedale Project. Recently acquired 14km of the potential extension of the new discovery by New Found Gold’s Queensway project to the south. Click Here for More Info
- Gold Bullion Surges above March Lows
- Gold Mining Equities Track Gold Higher
- Gold Mining Equities vs. S&P 500 Show Convincing Breakout
Markets Recalibrate
Capital markets and society continue to recalibrate from the enormity of the fallout of the COVID-19 pandemic. As difficult as the current situation is, gold fundamentals continue to improve. Gold, as an investment, offers a hedge against the current financial turmoil and has significant capital appreciation potential in the years ahead.
The magnitude of central banks and government actions over the past several weeks will resonate for the rest of this decade. In our March commentary (March Roars in Like a Lion), we mentioned that we are now in the “end game” where debt explodes in the face of a financial calamity (although no one predicted that it would be a pandemic). We will discuss what near-term options the U.S. Federal Reserve (“Fed”) will likely implement, and how gold is likely to respond. We will also look at the recent move higher for gold mining equities.
Gold Bullion: Increased Demand for Physical Gold
Gold bullion ended April at $1,687, adding $109/oz, or +6.9% for the month. Gold began its surge in early April as physical delivery shortages resulted in gold futures (COMEX, New York) trading wildly higher than spot gold (London). COVID-19 has caused refining capacity for gold to decline and greatly restricted the transport of physical gold from London to New York. Typically, gold futures trade fairly tight with spot gold due to arbitrage, but in early April, the spreads spiked as high as $70/oz. The unprecedented fiscal and monetary policy response to the worst economic shock since the Great Depression has put gold squarely into investors’ minds.
Gold is almost always in contango (longer-dated contracts are more expensive than the near month). In April, parts of the gold futures curve traded in a rare backwardation (the near month contract is more expensive), usually indicative of a supply shortage. With the usual gold channels disrupted, futures are pulling spot prices higher as short positions are closed by going long futures. Compounding the disruption was the growing demand for gold in physical form, fueled by soaring investor buying interest. The unprecedented fiscal and monetary policy response to the worst economic shock since the Great Depression has put gold squarely into investors’ minds.
Figure 1. Gold Bullion Surges above March Lows
Our short-term target is $1,800, and we expect to reach new all-time highs.
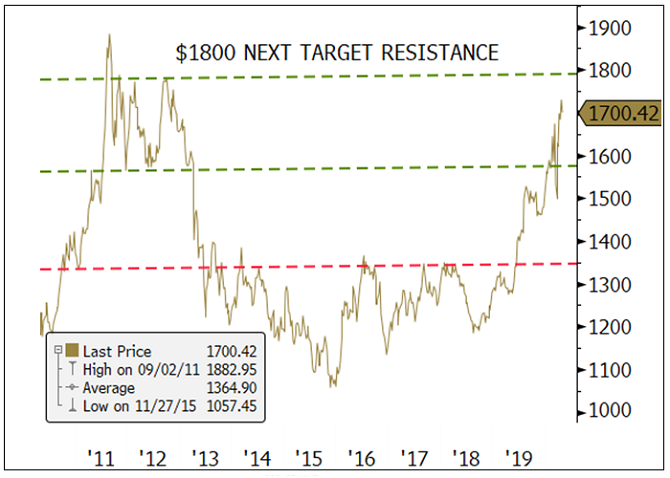
Source: Bloomberg. Data as of 4/30/2020.
Gold Mining Equities: Convincing Breakout in April
Gold equities broke out of a multi-year resistance level on massive buying flows. Using the NYSE Arca Gold Miners Index (GDM)5 as a reference, the 860 index resistance level was taken out convincingly. As shown in Figure 2, there is very little meaningful resistance until 1,200 (+25%). In March, gold equities, like bullion, experienced a forced liquidation event. Selling in GDX forced the ETF to trade at a significant discount to its underlying net asset value (NAV). Like many other ETFs, the selling volumes in GDX outpaced the liquidity in the underlying securities. Off the lows, the price action as measured by volume, breadth and money flow far exceeds the bullish thrust of the 2019 summer rally. This breakout, without question, is impressive on the technical measures.
Figure 2. Gold Mining Equities Track Gold Higher
The NYSE Arca Gold Miners Index (GDM) has broken out of a broad base pattern; our short-term target is 1,200.
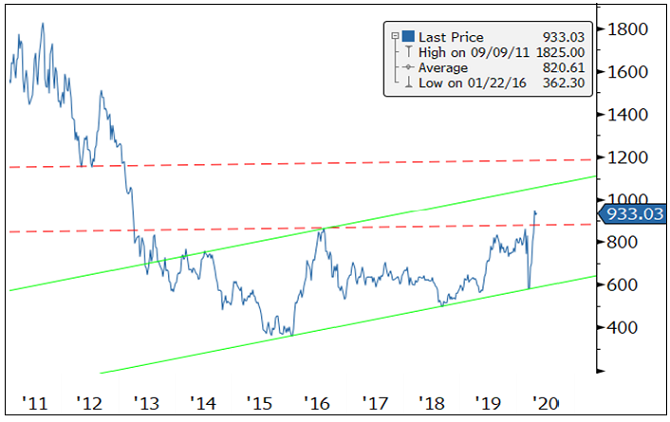
Source: Bloomberg. Data as of 4/30/2020.
The absolute price action is impressive, but when measured relative to the S&P 500 Index6 (Figure 3), the chart pattern looks even more impressive. Typically, new market leadership is more evident when measured against the broad market index. As shown in Figure 3, the NYSE Arca Gold Miners Index (GDM) relative to the S&P 500 Index has put in a very bullish bottom base pattern. There is a double bottom pattern set up with the right bottom shaping a head and shoulder breakout pattern. This bullish pattern within a bullish pattern is a very positive sign.
Figure 3. Gold Mining Equities vs. S&P 500 Show Convincing Breakout
GDM is putting a remarkable long-term basing chart pattern and breaking out in the medium term.
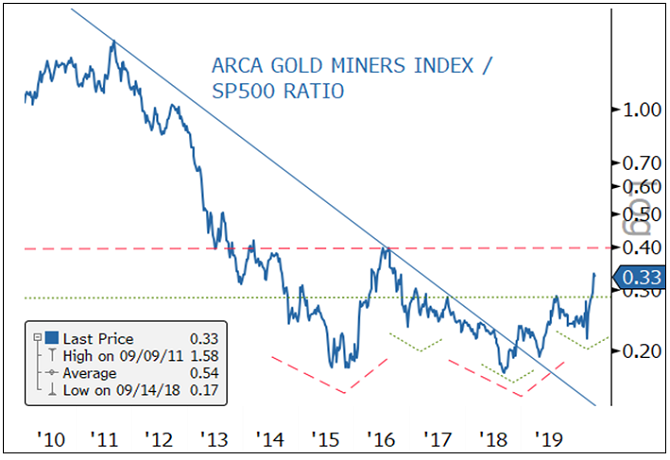
Source: Bloomberg. Data as of 4/30/2020.
Increasing Revenue with Deflationary Input Costs
The gold mining industry, like many other industries, is experiencing disruptions due to pandemic shutdowns. But unlike other industries, gold producers are experiencing a steep increase in the selling price of its product. Gold bullion is up +11% year to date and up over +31% year-over-year (through April 30, 2020). From a cost perspective, energy and labor are typically the two highest cost components for miners. The dramatic fall in crude oil is a rare function of both a supply shock (the Organization of the Petroleum Exporting Countries [OPEC] price war) and a demand shock (pandemic shutdowns) co-occurring. The enormity of both events will have lasting price consequences well beyond a few quarters. Labor, the other component, has been devastated by the pandemic. A tremendous labor crisis is occurring globally. In the U.S. alone, jobless claims have now exceeded 30 million, a crushing toll. Both of these conditions are deflationary shockwaves that will ripple out to all corners of the economy. There is virtually no major cost component (reagents, consumables, equipment) that will not see lower costs. Though near-term gold company earnings may be volatile due to COVID-19 disruptions, the potential increase in long-term profit margins may be unlike anything seen in recent history, and most comparable to the 1930s when gold company revenues soared and costs plummeted.
As QE (quantitative easing) Infinity continues to expand and ZIRP (zero interest rate policy) takes hold in a likely recession (or depression), growth equities will become highly sought after. Gold mining equities will have one of, if not the highest growth in earnings of any industry. Because of the nature of its revenue product (gold bullion), and its input costs (deflation), gold equities will likely develop into a convexity trade. Relative to the broad market, gold mining equities have a more direct path to higher prices. In the absence of earnings and post liquidity lift, general market equities require QE to increase stock prices by suppressing the risk-free rate and credit spreads, thereby reducing the discount rate used to calculate the present value of cash flows. Currently, cash flows are near impossible to forecast. The broad market equity risk is if earnings do not recover for more than a year due to COVID-19 and/or if a risk event pushes up credit spreads (i.e., credit defaults). Both risks are quite high compared to the risk for gold mining equities.
The Likely Market Impact of the Fed Stimulus and Fiscal Policy Response
At the end of April, the Fed Balance Sheet had expanded to $6.66 trillion (previous high was $4.5 trillion) and will climb higher. The final number is unknown due to moving variables and the lack of visibility, but $10 trillion by summer is in the ballpark. The deficit for 2020 is estimated to be $3.7 trillion (18% to 20% of gross domestic product [GDP]), an all-time high with risk to the upside. The debt-to-GDP current expected range of 110% to 120% will probably prove to be too low despite being the highest ever. More billions of dollars, week by week, are being added to a dizzying array of Federal programs, credit facilities and swap lines to mitigate the damage of the pandemic.
The amount of debt is genuinely numbing in its size and scale and will keep growing. Long term, there is very little hope that the economy can grow out of this debt load. To manage this debt, we believe the Fed will need to implement three broad conditions: 1) negative real yields, longer and lower than previously expected; 2) yield curve control to maintain a flat and low rate structure, and 3) a weaker or capped U.S. dollar.
1) Negative Real Interest Rates
We have discussed numerous times the importance of negative real interest rates in reducing (debasing) the debt. The huge increase in debt levels and the likely lingering effects of COVID-19 on the global economy will assure that negative real interest rates will be here for years. There will be a persistent and growing erosion of wealth via negative real yields.
Figure 4. U.S. Real Yields Near Zero
The Fed Funds target rate is 0.00-0.25%, and real yields are approximately -0.43%. Gold tends to thrive in low-interest rate environments. 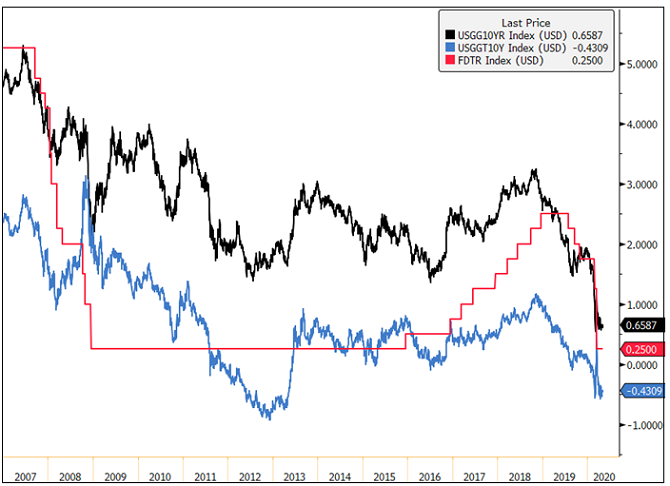
Source: Bloomberg. Data as of 5/5/2020. Nominal yields are measured by the USGG10YR Index, representing U.S. generic 10-year bond yields. Real yields are measured by USGGT10Y Index, representing U.S. 10-year TIPs (Treasury Inflation Protected) yields. The FDTR Index represents the Federal Funds Target Rate, which is set by the central bank in its efforts to influence short-term interest rates as part of its monetary policy strategy.
2) Yield Curve Control
Yield curve control was last used during World War II to finance the war. As the term implies, the U.S. government exerted control on both ends of the curve. Yields were capped with the short end lower than the long end. The long end was capped at around 2% irrespective of the economic condition. Controlled low yields provided a stable and manageable interest expense. By issuing more Treasuries in the short end, the government encouraged investors to borrow at the short end and to lend in the long end. Also, by issuing more at the short end of the curve, it ensured there was constant ample liquidity searching for yield. Today’s world is vastly different, but we expect to see a similar effort to control the yield curve. The Fed will continue to use QE Infinity to monetize the majority of bond issuances with an effort to keep rates as low as possible and the curve as flat as possible. For example, the $2.2 trillion of fiscal stimulus announced in March has already been monetized; 10-year Treasury yields are around 0.60% and the Fed Fund Rate is at zero.
3) Lower or Capped U.S. Dollar
We have also discussed the importance of a weaker U.S. dollar in previous commentaries. The impact of the global pandemic and the total collapse of crude oil pricing has elevated the importance of the U.S. dollar significantly. The sudden deceleration in global economic activity has dramatically reduced the flow of U.S. dollars. The U.S. dollar is the world’s reserve currency; about 60% to 70% of the world’s economic activity is transacted in U.S. dollars. Crude oil is one of the most critical sources of U.S. dollar liquidity. At year-end, an oil market of 100 Mb/d (million barrels a day) at $50 per barrel equated to $1.8 trillion of yearly U.S. dollar flows. Today, at 75 MB/d at $20 per barrel, crude oil-based U.S. dollar flows are now at $0.55 trillion. Now apply that to every industry that transacts globally, and the magnitude of U.S. dollar funding shortage becomes apparent.
There is an estimated $12 to $13 trillion of U.S. dollar-denominated debt held by foreign holders. The U.S. dollar is now the biggest financial short and there is a massive ongoing short squeeze as the global shutdown makes funding and servicing of this debt difficult. That the U.S. has launched trillions in fiscal and monetary stimulus, and the U.S. dollar has barely budged is an alarming sight. A runaway U.S. dollar in a financial and economic crisis coupled with a deflationary shockwave would be nothing short of a disaster scenario. In March, we had a small taste of what a U.S. dollar funding shortage and dollar hoarding had on global liquidity.
If the Fed has any chance of making this version of MMT (modern monetary theory) work, it will do everything in its power to keep the U.S. dollar in check and control a flat yield curve. Fighting the Fed’s efforts is this significant mismatch between U.S. dollar assets and liabilities. Historically, this has been the justification to devalue the dollar (or the prevailing reserve currency at the time) to bail out the world. Price regime changes typically occur with currency debasements. If we reach the point where the U.S. dollar stages a significant uncontrolled breakout higher, gold will spike as the market begins to price in the possibility of a reset of asset prices. At that point, gold would become the ultimate convexity trade for U.S. dollar debasement. Dollar debasement is a key tail risk in the end game.
Figure 5. The U.S. Dollar (DXY): Highs of March 2020 will be a Crucial Level
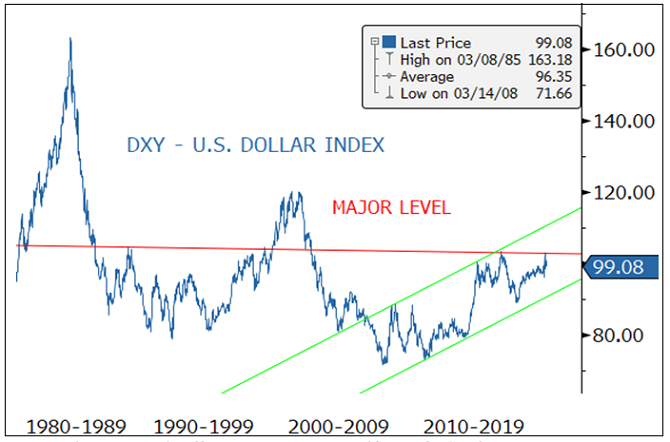
Source: Bloomberg. Data as of 4/30/2020.
A Realignment of Asset Classes
In just a few months, a global pandemic has caused a shutdown of the economy to an estimated tune of -25% annualized GDP for Q2, over 30 million U.S. workers filing jobless claims and trillions of dollars (and growing) added to the debt. Whether the news of the virus gets better or worse in the next few quarters, we will be in a ZIRP environment for years due to the debt level. With the Fed capping rates, yields will remain low and the curve flat whether the economic recovery is V-shaped, U, L, or any other alphabet shape (yield curve control). The economy will no longer determine the level of interest rates and the yield curve. The Fed will keep real interest rates negative; the only question is how negative? Investing in Treasuries has moved from a “return on capital” to a “return OF capital” proposition. Investing in Treasuries today is an erosion of wealth in real dollar terms.
The broader U.S. stock market has now recovered a significant part of its decline entirely due to the sheer amount of stimulus thrown by the Fed. To value the equity market today would require a look past a deep valley of uncertain duration, to the other side that may be changed entirely. As companies pull guidance due to the lack of visibility, equities can only rise mainly by never-ending liquidity. Equity valuations are already back to their all-time highs. Equity markets, like the bond market, will continue to decouple from the economy further.
Gold Makes Sense as Equity Volatility Increases
Moreover, if we are correct that the Fed’s main risk focus is containing the U.S. dollar and controlling the yield curve, equity risk (volatility) will trade higher vis-a-vis the U.S. dollar and bond prices than historical parameters (Figure 5). If this becomes the new reality, this repricing of volatility will have a dramatic effect on all asset classes. It will mean more effective equity hedges will be needed, such as gold. The one risk that the Fed cannot remove entirely is a tail risk event in which this current environment is a breeding ground.
Figure 6. Equity Risk Volatility is Trading Higher than Bond Volatility
The VIX7 (CBOE Volatility Index for equities) has likely entered into a new trading range relative to the MOVE Index8 (Implied volatility of Treasuries across the yield curve) with far-reaching consequences.
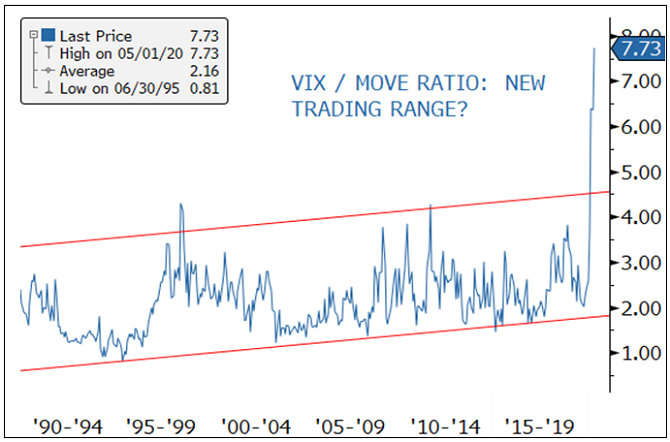
Source: Bloomberg. Data as of 4/30/2020.
SOURCE: https://sprott.com/insights/gold-stocks-take-flight/
Last modified: July 13, 2026


 as AI-Powered, Privacy‑First Ad Platform Reaches 500M+ Monthly Users")


