Posted by AGORACOM
at 9:13 PM on Sunday, April 5th, 2020
Immune Support product line has been received exceptionally well by consumers
The total number of customers acquired by First Class CBD in March 2020 is 20,959, including 6,419 immune customers
Initial average spend of Cdn$218.40 per customer
VANCOUVER, BC / April 4, 2020 Mota Ventures Corp. (CSE:MOTA)(FSE:1WZ1)(OTC:PEMTF) (the “Company†or “Mota“) is pleased to provide an update on the recent progress that is fueling the increase in sales for products under its First Class CBD brand. The Immune Support product line has been received exceptionally well by consumers since it launched on March 14, 2020 and has been a significant driver of growth in March. The total number of customers acquired by First Class CBD in March 2020 is 20,959, including 6,419 immune customers with an initial average spend of Cdn$218.40 per customer.
The Company will be launching a new brand, Nature’s Exclusive CBD on April 6, 2020. The new Nature’s Exclusive CBD brand will introduce a line of Immune Support and CBD products with a higher content of CBD. The Company also anticipates releasing March 2020 financial results for First Class CBD in the next few days.
“The month of March has been exceptional, with new customer signups exceeding expectations. We believe this is a testament to our ability to adapt to the fast-paced eCommerce sector and ability to identify upcoming trends in consumer demand. I am very excited with the rapid progress and look forward to releasing March results in the upcoming days,†stated Ryan Hoggan, CEO of the Company.
The initial average spend per customer was translated from US dollar into Canadian dollar using the Bank of Canada average exchange rate of 1.3953 for March 2020.
About Mota Ventures Corp.
Mota is an established eCommerce, direct to consumer provider of a wide range of CBD products in the United States and Europe. In the United States, the company sells a CBD hemp-oil formulation derived from hemp grown and formulated in the US through its First Class CBD and Nature’s Exclusive brands. Within Europe, its Satavida brand of award winning 100% organic CBD oils and cosmetics are sold throughout Spain, Portugal, Austria, Germany, France, and the United Kingdom. Mota Ventures is also seeking to acquire additional revenue producing CBD brands and operations in both Europe and North America, with the goal of establishing an international distribution network for CBD products. Low cost production, coupled with international, direct to customer, sales channels will provide the foundation for the success of Mota Ventures.
ON BEHALF OF THE BOARD OF DIRECTORS
MOTA VENTURES CORP. Ryan Hoggan Chief Executive Officer
For further information, readers are encouraged to contact Joel Shacker, President, at +604.423.4733 or by email at [email protected] or www.motaventuresco.com
Posted by AGORACOM
at 1:27 PM on Friday, April 3rd, 2020
RECENT HIGHLIGHTS
Immune Support Product Line Launched on March 14, 2020 Acquired over 5,500 new customers seeking natural solutions to help support their family’s immune systems, yielding an average initial order value of $189.00 USD.
First Class CBD brand achieved sales of Cdn$2,981,000 February 2020
Marketing efforts improved gross margins by 4.9% from January 2020 to February 2020.
February 2020 revenue represents an increase of 832% over the same period last year.
Plans to continue growth of First Class in the United States over the balance of 2020, as well as an expansion into the European market.
Formalized Joint Venture With Bevcanna Enterprises: Read More
Will share equal ownership in the Joint Venture and will be jointly responsible for developing and funding its operations
Company will provide manufacturing, marketing and distribution infrastructure in the European market.
Parties have determined an initial product launch and will provide further details on specific regions and timing once finalized
Formalized Collaboration for Sativida US Expansion Read MoreÂ
Acquired the intellectual property and trade names of Sativida
Unified Funding will provide assistance to Sativida with product sourcing, packaging, shipping, payment infrastructure and marketing
Sativida has become the number one search-ranked online retailer of CBD products in Spain and Mexico
Entered into Licensing Agreement with Phenome One Read More
A privately held full-service live genetic and seed preservation cannabis company.
Mota will have full access to Canada’s largest live genetic cannabis library with over 350 cultivars
Mota will have the right to propagate, cultivate, harvest and process a minimum of 10 selected cultivars
2 World Class Brands:
#1. FIRST CLASS CBD: ONE OF THE LARGEST US BASED ONLINE RETAILERS OF CBD PRODUCTS
HIGHLIGHTS:
Leader in online CBD sales in North America
Crop to package model: US grown CBD hemp
Acquired at a 1.5 times revenue valuation
Current customer base 142,000 customers -with additional leads of over 424,000 potential new customers
2019 Sales of $19.2M USD/ EBITDA of 2.7M USD
#2. SATIVIDA: ONLINE DIRECT TO CONSUMER RETAILER OF A VAST RANGE OF ORGANICE CBD OILS AND COSMETICS
HIGHLIGHTS:
Current distributor of CBD products in Spain, Portugal, Austria, Germany, France and the United Kingdom
Number one search-ranked online retailer in Spain and Mexico
Award winning product line known for its minimal heavy metal content and accurate CBD levels
100% organic products
About Mota Ventures Corp.
Mota Ventures is seeking to become a vertically integrated global CBD brand. Its plan is to cultivate and extract CBD into high-quality value added products from its Latin American operations and distribute it both domestically and internationally. Mota has established distribution networks through the acquisition of First Class CBD in the United States and Sativida in Europe. Mota Ventures is also seeking to acquire revenue producing CBD brands and operations in both Europe and North America, with the goal of establishing an international distribution network for CBD products. Low cost production, coupled with international, direct to customer, sales channels will provide the foundation for the success of Mota Ventures.
Posted by AGORACOM
at 11:27 AM on Friday, April 3rd, 2020
SPONSOR: Labrador Gold – Two successful gold explorers lead the way in the Labrador gold rush targeting the under-explored gold potential of the province. Exploration has already outlined district scale gold on two projects, including a 40km strike length of the Florence Lake greenstone belt, one of two greenstone belts covered by the Hopedale Project. Recently acquired 14km of the potential extension of the new discovery by New Found Gold’s Queensway project to the south.Click Here for More Info
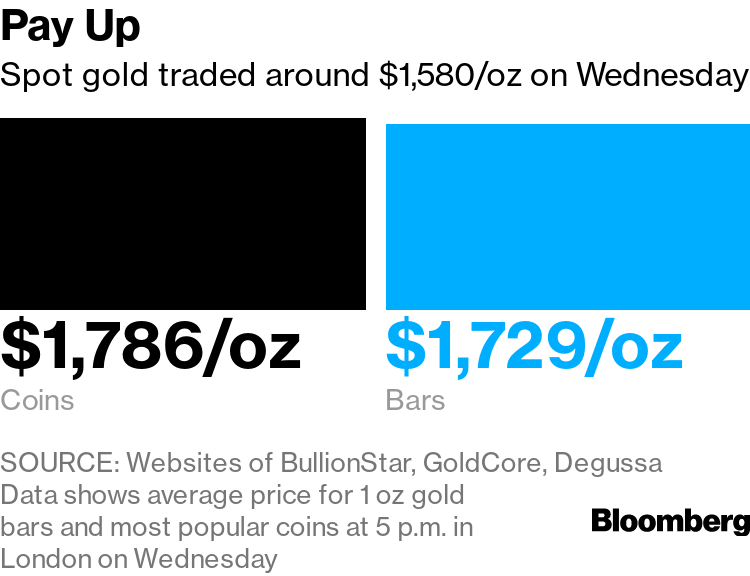
Small gold bars and coins are in high demand from consumers
The size of different products is a key reason for the crunch
Surging demand and disruptions from the coronavirus pandemic have created a shortage of the small gold bars most popular with consumers.
When people are worried about the future they turn to gold to protect their savings. That’s rarely been more true than today.
Surging demand and disruptions from the coronavirus pandemic have created a shortage of the small gold bars most popular with consumers. Those who do manage to get their hands on metal have to pay up –- well above the per-ounce prices being quoted on financial markets in London and New York.
Some dealers are desperately contacting clients to see if anyone is willing to sell their gold bars and coins, and offering a rare premium over spot prices. Others have given up trying to trade altogether.
“People want to buy, not to sell gold,†said Mark O’Byrne, the founder of GoldCore, a dealer based in Dublin. “We have a buyers’ waiting list and we emailed our clients seeing who wished to sell their gold. At this time there is roughly only one or two sellers for every 99 buyers.â€
Size is a key reason for the crunch. While there’s plenty of gold in a big trading hub like London, banks and other institutional investors there typically use large bars of 400 ounces. That’s not practical for a regular person who may not want to cough up more than $600,000 for a single bar. Instead, retail investors prefer kilobars (about 32 ounces), 1-ounce bars and coins, or something even smaller.
Those smaller items are getting hard to find for several reasons. First, of course, demand has exploded. But there’s also been pressure on supply, as global travel shuts down and some refineries and mints have stopped operating or capped production because of local lockdowns.
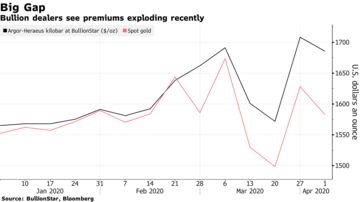
Premiums in the retail market “have exploded,†said Markus Krall, chief executive of German precious-metals retailer Degussa. The average price of products in shops is somewhere between 10% and 15% over spot prices, which he’s never seen before, Krall said. Demand, too, is at the highest level he’s experienced.
Certain products also command more of a premium than others. Kilobars manufactured by Argor-Heraeus SA, one of the big Swiss refiners whose plant has been closed since last week due to the health crisis, were selling for over 6% above spot, said Ronan Manly, an analyst at Singapore dealer BullionStar.
“We are seeing an unprecedented situation where huge customer demand and the disconnect between physical prices and spot prices is driving buy premiums high,†he said. Spot prices coming from London or New York “are completely detached from the reality on the ground.â€
Posted by AGORACOM
at 9:54 AM on Friday, April 3rd, 2020
SPONSOR: American Creek owns a 20% Carried Interest to Production at the Treaty Creek Project in the Golden Triangle. 2019’s first hole averaged 0.683 g/t Au over 780m in a vertical intercept. 2020 drilling plans 18,000 to 20,000 metres from 7-10 drill platforms with four diamond drill rigs. The Treaty Creek property is located in the same hydrothermal system as the Pretivm and Seabridge’s KSM deposits and is fully funded for exploration in 2020. Click Here For More Info
The nations of the world had 34,700 tons of gold reserves, as of January 2020.
Countries maintain gold reserves to stabilize currency against hyperinflation, particularly in the event of a major crisis like the one many economies worldwide currently face as a result of the coronavirus pandemic. Relatively few countries, however, have large gold reserves. In fact, over 80% of the world’s national gold reserves is held by the central banks and finance ministries of just 25 countries.
To determine the countries that control the world’s gold, 24/7 Wall St. reviewed data on gold reserves by country in tonnes – or metric tons – as of January 2020 from the World Gold Council. Data on gold as a share of a country’s total foreign exchange reserves also came from the WGC and is current as of January 2020.
The value of a country’s gold reserves in U.S. dollars was calculated using exchange rates current as of March 13, 2020. GDP and GDP per capita figures in 2018 are from the World Bank and are in constant 2011 international dollars. Data on population is also from the World Bank and is for 2018 or for the most recent period available.
Many, but not all of the countries on this list, are among the wealthiest nations on Earth, as these countries are able to buy up substantial gold reserves. These are the 25 richest countries in the world.
While some countries on this list have obtained gold reserves by purchasing from other countries, many of the nations with the biggest gold reserves, such as China, the United States, and Russia, are also the top gold-producing countries. China, the largest producer of gold in the world, alone accounted for 14% of global gold production in 2016.Â
25. Venezuela
• Gold reserves as of January 2020: 161.2 tonnes
• Gold reserves in USD as of January 2020: $8.1 billion
• Gold as % of total foreign exchange reserves: 81.0%
• GDP: $271 billion ($9,402 per capita)
• Population: 28.9 million
24. Algeria
• Gold reserves as of January 2020: 173.6 tonnes
• Gold reserves in USD as of January 2020: $8.7 billion
• Gold as % of total foreign exchange reserves: 11.6%
• GDP: $580 billion ($13,737 per capita)
• Population: 42.2 million
23. Philippines
• Gold reserves as of January 2020: 197.9 tonnes
• Gold reserves in USD as of January 2020: $9.9 billion
• Gold as % of total foreign exchange reserves: 11.2%
• GDP: $847 billion ($7,943 per capita)
• Population: 106.7 million
22. Belgium
• Gold reserves as of January 2020: 227.4 tonnes
• Gold reserves in USD as of January 2020: $11.4 billion
• Gold as % of total foreign exchange reserves: 39.5%
• GDP: $498 billion ($43,582 per capita)
• Population: 11.4 million
21. Poland
• Gold reserves as of January 2020: 228.6 tonnes
• Gold reserves in USD as of January 2020: $11.5 billion
• Gold as % of total foreign exchange reserves: 9.3%
• GDP: $1.1 trillion ($28,786 per capita)
• Population: 38 million
20. Austria
• Gold reserves as of January 2020: 280.0 tonnes
• Gold reserves in USD as of January 2020: $14.1 billion
• Gold as % of total foreign exchange reserves: 56.1%
• GDP: $409 billion ($46,260 per capita)
• Population: 8.8 million
19. Spain
• Gold reserves as of January 2020: 281.6 tonnes
• Gold reserves in USD as of January 2020: $14.1 billion
• Gold as % of total foreign exchange reserves: 19.1%
• GDP: $1.6 trillion ($34,831 per capita)
• Population: 46.7 million
18. Lebanon
• Gold reserves as of January 2020: 286.8 tonnes
• Gold reserves in USD as of January 2020: $14.4 billion
• Gold as % of total foreign exchange reserves: 27.3%
• GDP: $79 billion ($11,607 per capita)
• Population: 6.8 million
17. United Kingdom
• Gold reserves as of January 2020: 310.3 tonnes
• Gold reserves in USD as of January 2020: $15.6 billion
• Gold as % of total foreign exchange reserves: 9.3%
• GDP: $2.7 trillion ($40,522 per capita)
• Population: 66.5 million
16. Saudi Arabia
• Gold reserves as of January 2020: 323.1 tonnes
• Gold reserves in USD as of January 2020: $16.2 billion
• Gold as % of total foreign exchange reserves: 3.2%
• GDP: $1.7 trillion ($49,101 per capita)
• Population: 33.7 million
15. Uzbekistan
• Gold reserves as of January 2020: 333.7 tonnes
• Gold reserves in USD as of January 2020: $16.8 billion
• Gold as % of total foreign exchange reserves: 56.7%
• GDP: $250 billion ($7,592 per capita)
• Population: 33 million
14. Portugal
• Gold reserves as of January 2020: 382.5 tonnes
• Gold reserves in USD as of January 2020: $19.2 billion
• Gold as % of total foreign exchange reserves: 76.8%
• GDP: $298 billion ($28,999 per capita)
• Population: 10.3 million
13. Kazakhstan
• Gold reserves as of January 2020: 386.5 tonnes
• Gold reserves in USD as of January 2020: $19.4 billion
• Gold as % of total foreign exchange reserves: 67.1%
• GDP: $452 billion ($24,738 per capita)
• Population: 18.3 million
12. Taiwan, province of China
• Gold reserves as of January 2020: 422.4 tonnes
• Gold reserves in USD as of January 2020: $21.2 billion
• Gold as % of total foreign exchange reserves: 4.3%
• GDP: N/A
• Population: N/A
11. Turkey
• Gold reserves as of January 2020: 428.7 tonnes
• Gold reserves in USD as of January 2020: $21.5 billion
• Gold as % of total foreign exchange reserves: 21.8%
• GDP: $2.1 trillion ($25,358 per capita)
• Population: 82.3 million
10. Netherlands
• Gold reserves as of January 2020: 612.5 tonnes
• Gold reserves in USD as of January 2020: $30.8 billion
• Gold as % of total foreign exchange reserves: 70.2%
• GDP: $858 billion ($49,787 per capita)
• Population: 17.2 million
9. India
• Gold reserves as of January 2020: 635 tonnes
• Gold reserves in USD as of January 2020: $31.9 billion
• Gold as % of total foreign exchange reserves: 7%
• GDP: $9.3 trillion ($6,888 per capita)
• Population: 1.4 billion
8. Japan
• Gold reserves as of January 2020: 765.2 tonnes
• Gold reserves in USD as of January 2020: $38.4 billion
• Gold as % of total foreign exchange reserves: 2.9%
• GDP: $5 trillion ($39,294 per capita)
• Population: 126.5 million
7. Switzerland
• Gold reserves as of January 2020: 1,040.0 tonnes
• Gold reserves in USD as of January 2020: $52.3 billion
• Gold as % of total foreign exchange reserves: 6.2%
• GDP: $505 billion ($59,317 per capita)
• Population: 8.5 million
6. China
• Gold reserves as of January 2020: 1,948.3 tonnes
• Gold reserves in USD as of January 2020: $97.9 billion
• Gold as % of total foreign exchange reserves: 3.1%
• GDP: $22.5 trillion ($16,182 per capita)
• Population: 1.4 billion
5. Russia
• Gold reserves as of January 2020: 2,279.2 tonnes
• Gold reserves in USD as of January 2020: $114.5 billion
• Gold as % of total foreign exchange reserves: 20.6%
• GDP: $3.8 trillion ($24,791 per capita)
• Population: 144.5 million
4. France
• Gold reserves as of January 2020: 2,436.0 tonnes
• Gold reserves in USD as of January 2020: $122.4 billion
• Gold as % of total foreign exchange reserves: 63.6%
• GDP: $2.6 trillion ($39,556 per capita)
• Population: 67 million
3. Italy
• Gold reserves as of January 2020: 2,451.8 tonnes
• Gold reserves in USD as of January 2020: $123.2 billion
• Gold as % of total foreign exchange reserves: 69.3%
• GDP: $2.2 trillion ($35,828 per capita)
• Population: 60.4 million
2. Germany
• Gold reserves as of January 2020: 3,366.5 tonnes
• Gold reserves in USD as of January 2020: $169.1 billion
• Gold as % of total foreign exchange reserves: 74%
• GDP: $3.8 trillion ($45,936 per capita)
• Population: 82.9 million
1. United States
• Gold reserves as of January 2020: 8,133.5 tonnes
• Gold reserves in USD as of January 2020: $408.7 billion
• Gold as % of total foreign exchange reserves: 77.9%
Posted by AGORACOM
at 8:03 PM on Thursday, April 2nd, 2020
Sponsor: Affinity Metals Corp. (TSX-V: AFF) is a Canadian mineral exploration company building a strong portfolio of mineral projects in North America. The Corporation’s flagship property is the drill ready Regal Property near Revelstoke, BC where Affinity Metals is making preparations for a spring drill program to test two large Z-TEM anomalies. Click Here for More Info
BMO Capital Markets upgraded its forecast for gold prices Wednesday while downgrading the outlook for many other commodities.
BMO sees gold averaging $1,660 an ounce in the second quarter and rising to $1,700 in the fourth. The bank’s full-year forecast is now at $1,654, increasing to $1,698 next year.
The bank looks for silver to average $15.50 an ounce in the second quarter, then $18.50 in the next two quarters, with a full-year average of $17.18. The 2021 outlook was put at $18.05.
A previously expected global economic and industrial recovery in 2020 has been “stopped in its tracks†by the COVID-19 pandemic, BMO said. Businesses are shutting down around the world to slow the spread of the virus. As a result, the bank now expects a 0.8% contraction in global industrial production this year, the first slowdown since 2009. “And as a result, we have revised down our 2020 outlook across many of the commodities we cover, while pushing gold expectations higher,†BMO said.
Nevertheless, prices for all commodities – with the exception of iron ore – are likely to be higher next year, as supportive government stimulus efforts take hold, BMO said.
“We see gold as a natural beneficiary of even lower global interest rates and its safe-haven status should receive another airing in 2020,†BMO said. “Meanwhile, we see silver as not only hanging on gold’s coattails, but also potentially outperforming should governments move towards fiscal spending on 5G and solar technology.â€
Analysts pointed out that after the 2008 global financial crisis, gold and silver prices recovered months ahead of the global industrial economy.
Meanwhile, BMO said the platinum and palladium markets are likely to be volatile with both weaker auto sales and supply. However, since palladium stocks are already low, another price rally is likely when the auto industry restarts, BMO continued.
Platinum is seen averaging $950 an ounce in the second quarter and $1,000 in the fourth, with a full-year forecast of $971. Palladium is seen averaging $2,500 in the second quarter but falling to $2,250 in the fourth for a full-year average of $2,313.
BMO said its biggest downward revision to commodity prices in 2020 was in copper, but the outlook for other base metals was also lowered, including aluminum, zinc and nickel. These are all industrial metals. Copper is seen averaging $2.27 a pound in the second quarter and $2.33 for the full year.
Posted by AGORACOM
at 10:05 AM on Wednesday, April 1st, 2020
SPONSOR: Lomiko Metals is focused on the exploration and development of minerals for the new green economy such as lithium and graphite. Lomiko owns 80% of the high-grade La Loutre graphite Property, Lac Des Iles Graphite Property and the 100% owned Quatre Milles Graphite Property. Lomiko is uniquely poised to supply the growing EV battery market. Click Here For More Information
Beyond lithium-ion technology, graphene can enhance the performance of next generation lithium-sulphur batteries. The battery promises lower costs due to the use of widely available sulphur as the cathode. Combined with a lithium metal anode and improvements to specific energy (Wh/kg) have also been achieved. Unfortunately, there are similarities between silicon and sulphur in that sulphur is also prone to stability issues – polysulphides tend to dissolve and diffuse to the anode where they react and cause a loss of active material. Furthermore, sulphur is not conductive and also expands during lithiation, though not to the extremes of silicon, and so requires both conductive additives and space within the electrode for the sulphur to expand into. Norwegian start-up Graphene Batteries employ a graphene network which provides a conductive network, space for volume expansion and may also help to trap polysulphides from diffusing to the anode. Nevertheless, the lithium-sulphur chemistry is still at the very early stages of commercialisation with various performance parameters needing to be improved upon and demonstrated.
The highly specific surface area and conductivity of graphene meant its first application in energy storage, that gained traction, was not in batteries but supercapacitors (capacitance is directly proportional to surface area). The theoretical specific capacitance of a single graphene layer is 550 F/g, 3-4 times the capacitance achieved from activated carbon in organic electrolyte (the incumbent electrode material). Companies are exploring μF chips through to kF modules for IoT devices through to wind turbines and off-road vehicles. All are looking at different ways to cost-effectively incorporate graphene without re-stacking or by appropriately modifying the surface. Unfortunately, the use of graphene has so far resulted in minimal improvements to specific capacitance or energy density. Graphene has been able to further improve power density but given power and fast charge/discharge capability are already strengths of supercapacitors, it is unlikely to unlock significant new markets.
Graphene can help enable lithium-sulphur technology and improve supercapacitor performance but IDTechEx believe they are most likely to occupy niche positions in the energy storage market, see “Advanced Li-ion & Beyond Li-ion Batteries 2018-2028â€. Li-ion technology is set to dominate over the coming decade and here, graphene can play an important role. Analysts at UK-based market research company, IDTechEx, cover various aspects of the energy storage and graphene markets, assessing the trends, bottlenecks and market potential of new materials and technologies. The newly updated report “Li-ion Batteries 2020-2030†provides a comprehensive view of the Li-ion market and the opportunities for new materials, while the report “Graphene, 2D Materials and Carbon Nanotubes 2019-2029†provides detailed analysis of the titled materials, their commercial progress and their prospects moving forward. For the full portfolio of energy research available from IDTechEx please visit www.IDTechEx.com/research/ES.
Posted by AGORACOM
at 4:21 PM on Tuesday, March 31st, 2020
SPONSOR: Labrador Gold – Two successful gold explorers lead the way in the Labrador gold rush targeting the under-explored gold potential of the province. Exploration has already outlined district scale gold on two projects, including a 40km strike length of the Florence Lake greenstone belt, one of two greenstone belts covered by the Hopedale Project. Recently acquired 14km of the potential extension of the new discovery by New Found Gold’s Queensway project to the south.Click Here for More Info
Dear Investors:
Are you looking for securities to buy to take advantage of the
carnage in the financial markets from the coronavirus? Baron Rothschild,
the 18th-century British banker advised that “The time to buy is when
there’s blood in the streets, even if it is your own.†He made a fortune
buying government bonds in the panic that followed the Battle of
Waterloo against Napoleon. But it’s not sovereign debt of the world’s
superpowers that is on sale today; it’s not the S&P 500 or Dow
either.
US government bonds already had their biggest year-over-year rally
ever, and at record low yields, they are no bargain. As for US stocks,
it’s only the first month after what we believe was a historic market
top. The problem is that the pandemic just so happened to strike at the
time of the most over-valued US stock market ever based on a composite
of eight valuation indicators tracked by Crescat, even higher than 1929
and 2000. It also hit after a record long bull market and economic
expansion. The stock market was already ripe for a major downturn based
on an onslaught of deteriorating macro and fundamental data even before
the global health emergency.
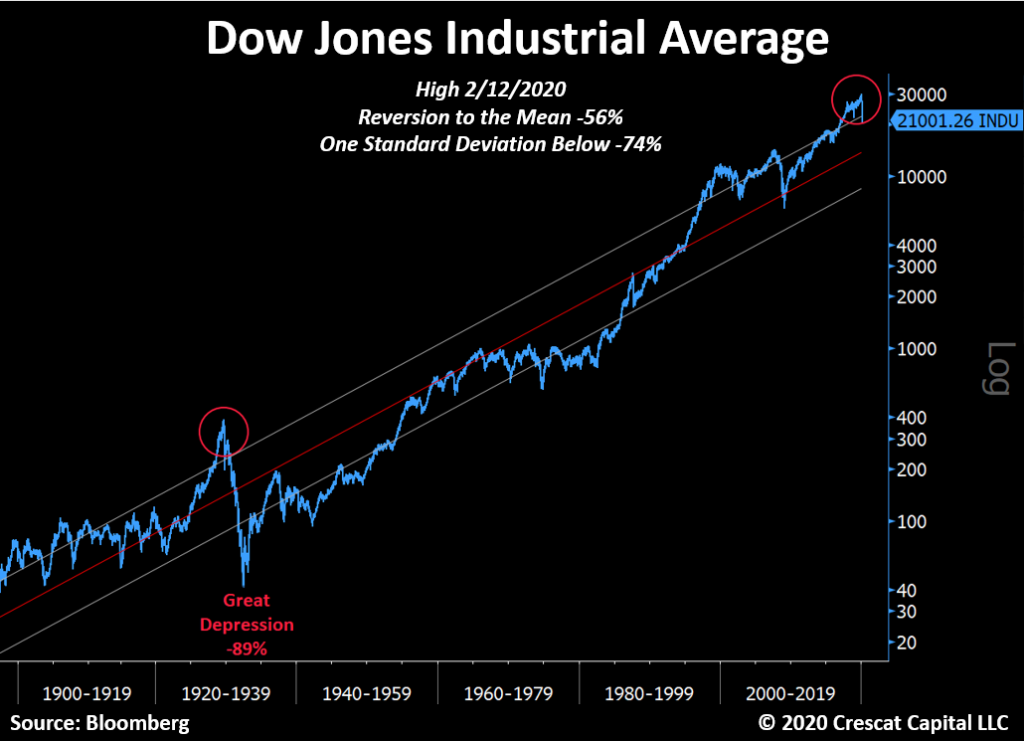
As we show in the chart above, we believe there is much more downside
still ahead for US stocks as a major global recession from nosebleed
debt-to-GDP levels has only just begun. Corporate earnings are now
poised to plunge and unemployment to surge. These things are perfectly
normal. There is a business cycle after all. It must play out as always
to purge the economy and markets of their sins and prepare the way for
the next growth phase. From the February top for large cap stocks, it
would take a 56% selloff just to get to long term mean valuations, a 74%
decline to get to one standard deviation below that. In the worst bear
markets, valuations get to two standard deviations below the mean. Such
realities happened at the depth of the Great Depression, the 1973-4 bear
market, and the 1982 double-dip recession. 1932 was an 89% drop from
the peak. The initial decline in this market so far is comparable to
1929 in speed and magnitude. There will certainly be bounces, but even
after an almost 30% fall in the S&P 500 through yesterday’s close,
we are not even close to the “blood in the street†valuations that
should mark the bottom for stocks in the current global recession that
has only just begun.
But value investors do not have to despair today. There is one area
of the stock market that already offers historic low valuations and an
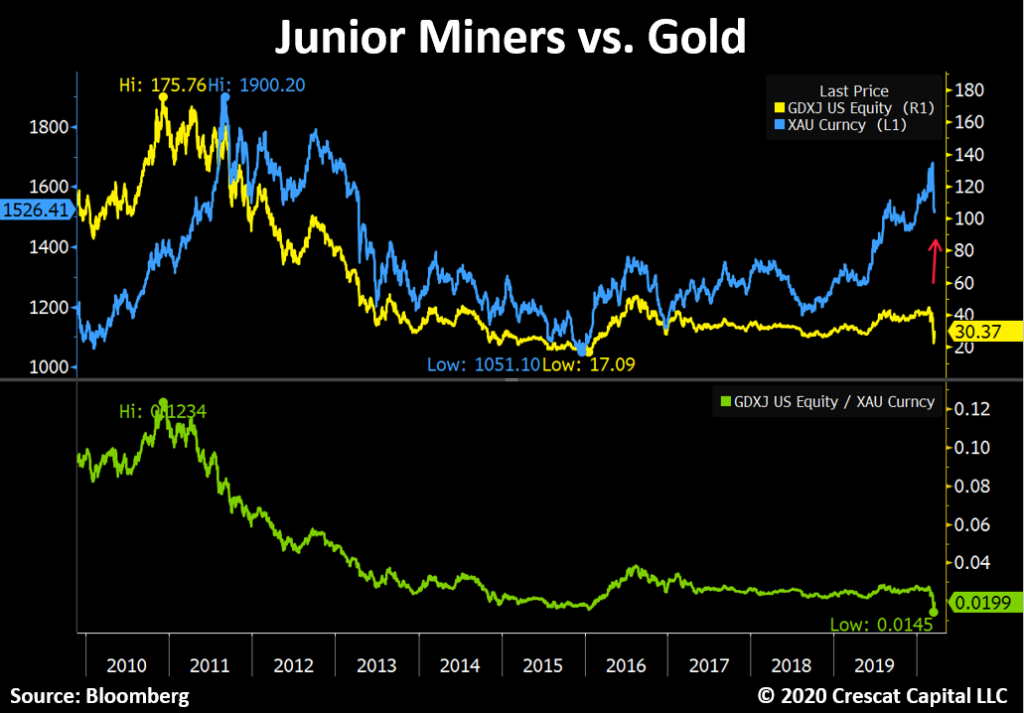
incredible buying opportunity right now. Small cap gold and silver
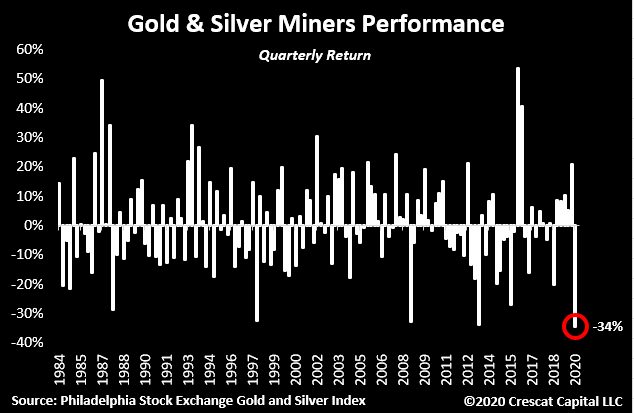
mining companies just retested the lows of a 9-year bear market. Last
Friday, they were down 84% from their last bull market peak in December
2010! This was a double-bottom retest at a likely higher low compared to
the January 2016 low when they were down 87%. Now that is what we call
mass murder! In the chart below, we show that precious metals juniors
reached record low valuations last Friday relative to gold which is
still up 18% year-over-year. Mad value. Look at that beautiful
divergence and base. The baby was thrown out with the bathwater in a
mass margin call. Last time the ratio was in this vicinity, junior gold
and silver miners rallied 200% in 8 months. Crescat owns a portfolio of
premier, hand-picked juniors as part of our precious metals SMA and in
both hedge funds where clients can gain exposure today. We significantly
increased our exposure in our hedge funds amidst the massacre last
week.
The entire precious metals group was a casualty of a liquidity
crisis, the forced margin call selling for stocks and corporate credit
at large in the precipitous market decline. But it was also a victim of a
meltdown in dubious levered gold and silver ETF products. These
products such as JNUG and NUGT already had a horrific tracking error.
Nobody should have ever been investing in them in the first place. Gold
stocks are volatile enough on an unlevered basis.
The chief culprit in the ETF space last week was the $3 billion
leveraged assets, Direxion Daily Jr. Gold Bull 3x ETF. It absolutely
imploded, dropping 95% through last Friday from its recent high on
February 21. The fiasco in JNUG was insult to injury for long-time
precious metals investors, especially those invested in silver and in
junior miners. It was also an incredible buying opportunity that Crescat
took advantage of, especially in its hedge funds, where the profits
from our short positions at large allowed us to step up. Last week’s
action may have marked a major bottom for precious metals mining stocks
and ideally a bottom for battered silver this week. As of Friday, miners
were on track for their worst quarter ever as we show below.
The gold and silver stock selloff has exposed enormous free cash flow
yields today among precious metals mining producers of 10, 20, 30, 40,
even 50%. This is completely opposite the stock market at large.
Meanwhile, the pure-play junior mining explorers have some of the
world’s most attractive gold and silver deposits that can be bought at
historic low valuations to proven reserves and resources in the ground.
These companies are the beneficiaries of under-investment in exploration
and development by the senior producers over the entire precious metals
bear market. That rebound may have started yesterday in the mining
stocks especially the juniors. It is a historic setup right now for the
entire precious metals complex. Central banks are coming in, guns
blazing.
Meanwhile, the fundamentals have never been better for gold and
silver prices to rise making the discounted present value of these
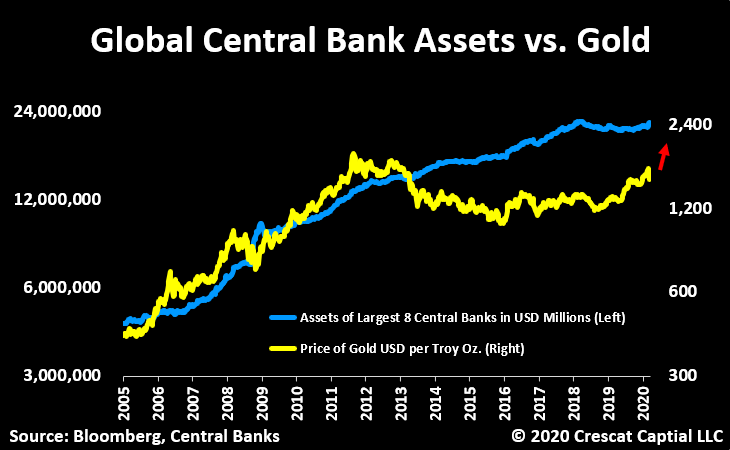
companies even better. Global central bank money printing is poised to
explode which is important because the world fiat monetary base is the
biggest single macro driver of gold prices. Gold itself is already
undervalued relative to global central bank assets which targets gold at
$2400 an ounce today.
At the same time, the price of gold is the biggest macro driver of
the price of silver, which is gold on steroids. Silver today is the
absolute cheapest it has ever been relative to gold and represents an
incredible bargain. We think silver is poised to skyrocket along with
mining stocks in what should be one of the biggest V-shaped recoveries
in the entire financial markets in the near term.
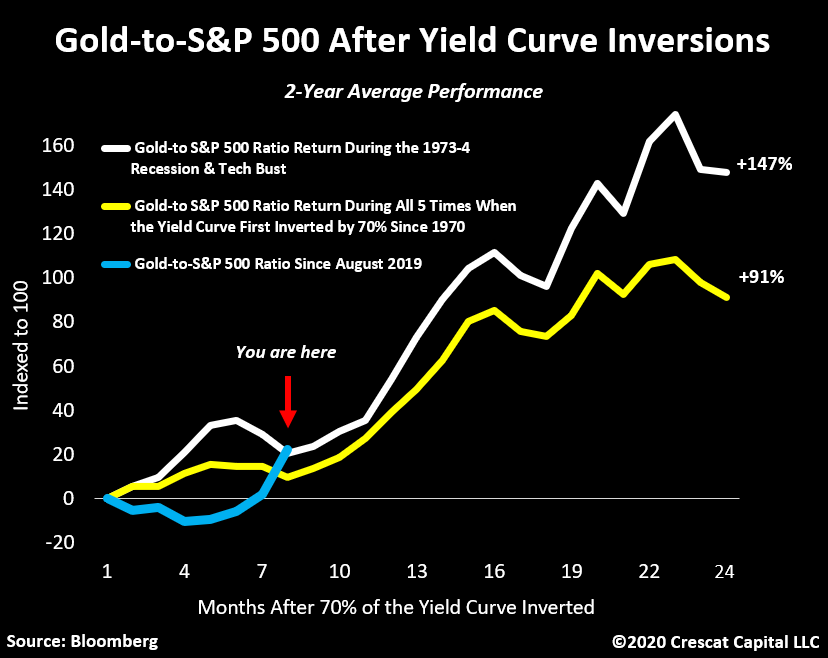
As we have shown in our prior letters, when the yield curve first
inverts by 70% or more, there is a high probability of a recession and
bear market. At that point, historically it has paid to buy gold and
sell stocks for the next 2 years. We went above 70% inversions in August
2019. At Crescat, we continue to express both sides of this trade in
our hedge funds and our firm at large. The gold-to-S&P 500 ratio is
up 28% since last August. The first part of the move was mostly driven
by the rise in gold. Since February 19, its been driven by the decline
in stocks. Now we’re at the place where historically both legs start to
work in tandem, and yesterday that was evident with one of our best days
ever in both Crescat hedge funds.
The Fed has not exhausted all its bullets. It has many forms of
monetary stimulus. It can print more money and take interest rates into
negative territory if need be. As the downturn in the business cycle
becomes more pronounced, these policies will become increasingly called
upon. That’s precisely what we are seeing today. Rate cuts everywhere,
QE announcements, even forms of helicopter money are being implemented.
It won’t save the economic cycle from its normal course, instead, it
should only invigorate the reasons for owning precious metals. Central
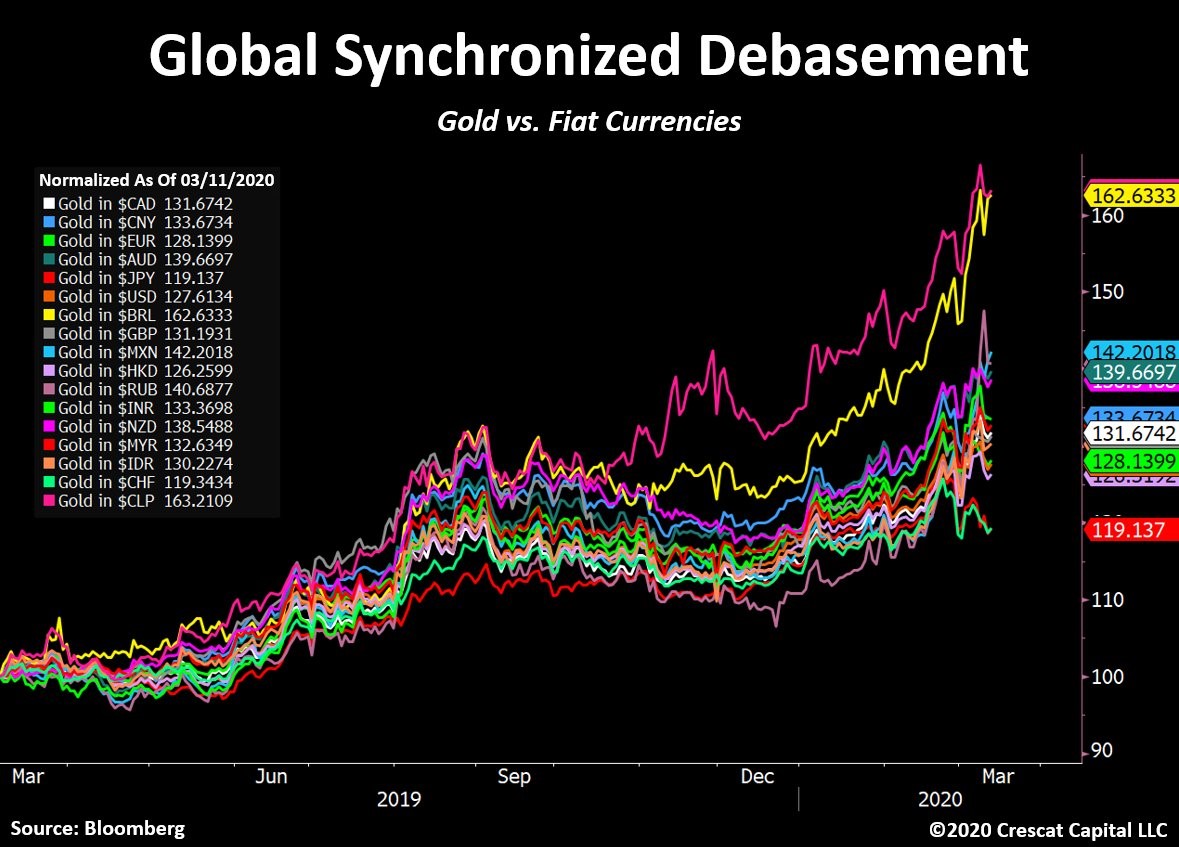
bank money printing and inflationary fiscal policy will almost certainly
intensify. This is incredibly bullish for precious metals. We are in a
global synchronized debasement environment. Gold has already been
appreciating in all major fiat currencies in the world over the last
year.
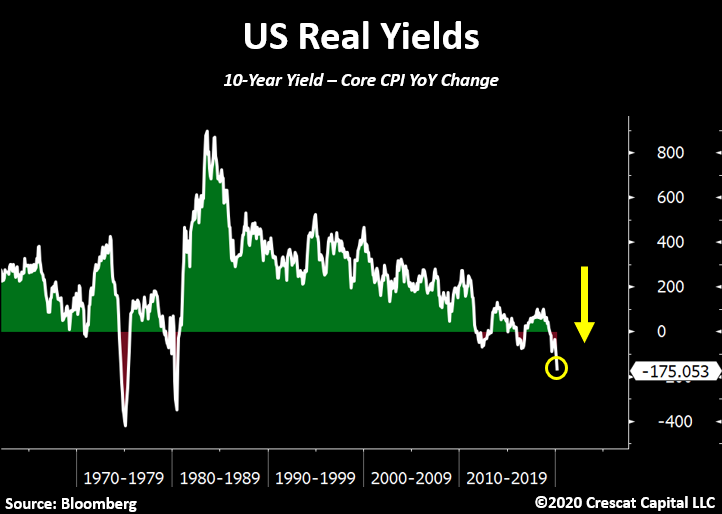
While yields continue to make historic lows worldwide, in real terms
they have reached even more extreme levels. For instance, the US 10-year
yield is now almost 2 percentage points below inflation. This just
further strengthens our precious metals’ long thesis.
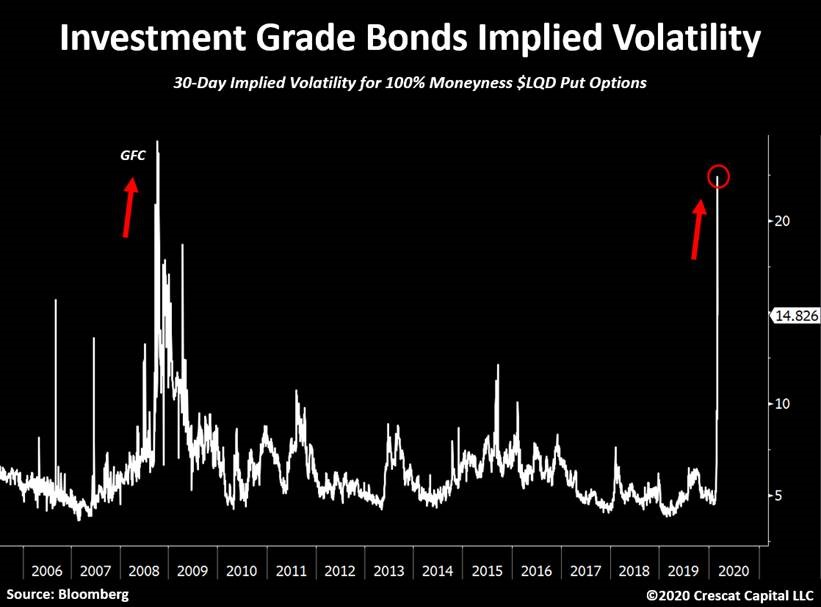
Even investment grade (IG) bonds are now blowing up. Implied
volatility for IG bonds is surging! It’s now at its highest level since
the Great Recession. Last week, the LQD (ETF) plunged 8% in 3 days,
which is equivalent to a 10 standard deviation move. Declines as such
only happened one other time in history, September 2008. We believe the
corporate debt market crisis has just begun.
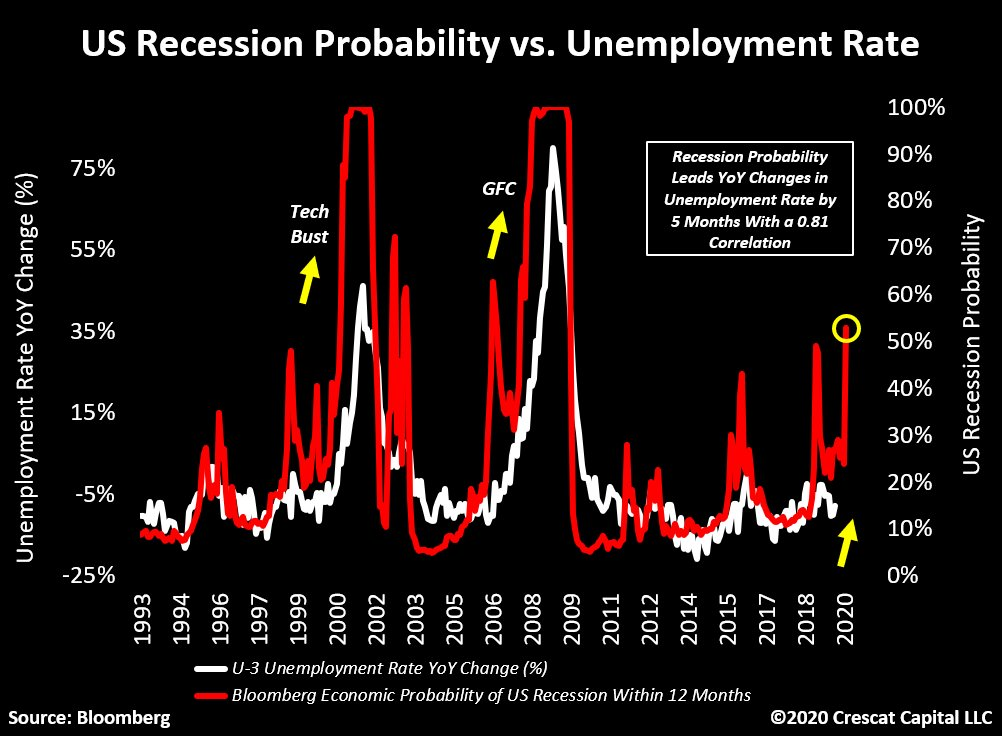
Stocks are acting like it’s the Great Depression again and we believe
a recession has already begun. The probability for a US recession, as
measure by this Bloomberg indicator, just surged above 50%. It’s
currently at its highest level since the global financial crisis. This
indicator leads changes in unemployment by 5 months with a 0.81
correlation. It suggests that the labor market has peaked.
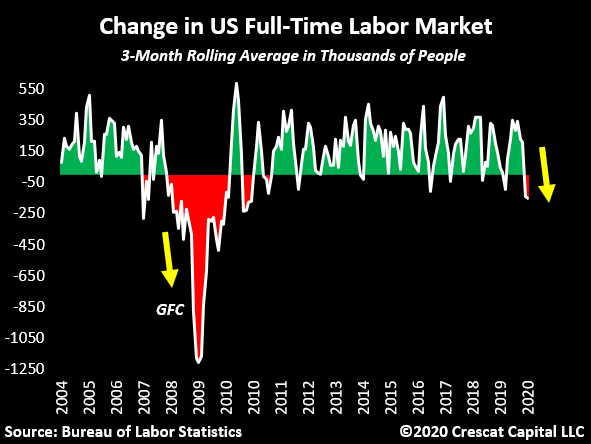
We have also recently noted that the number of full-time employed
people is now contracting. This was already rolling over in January.
With the recent impacts from the virus outbreak, we believe this number
will be plunging imminently.
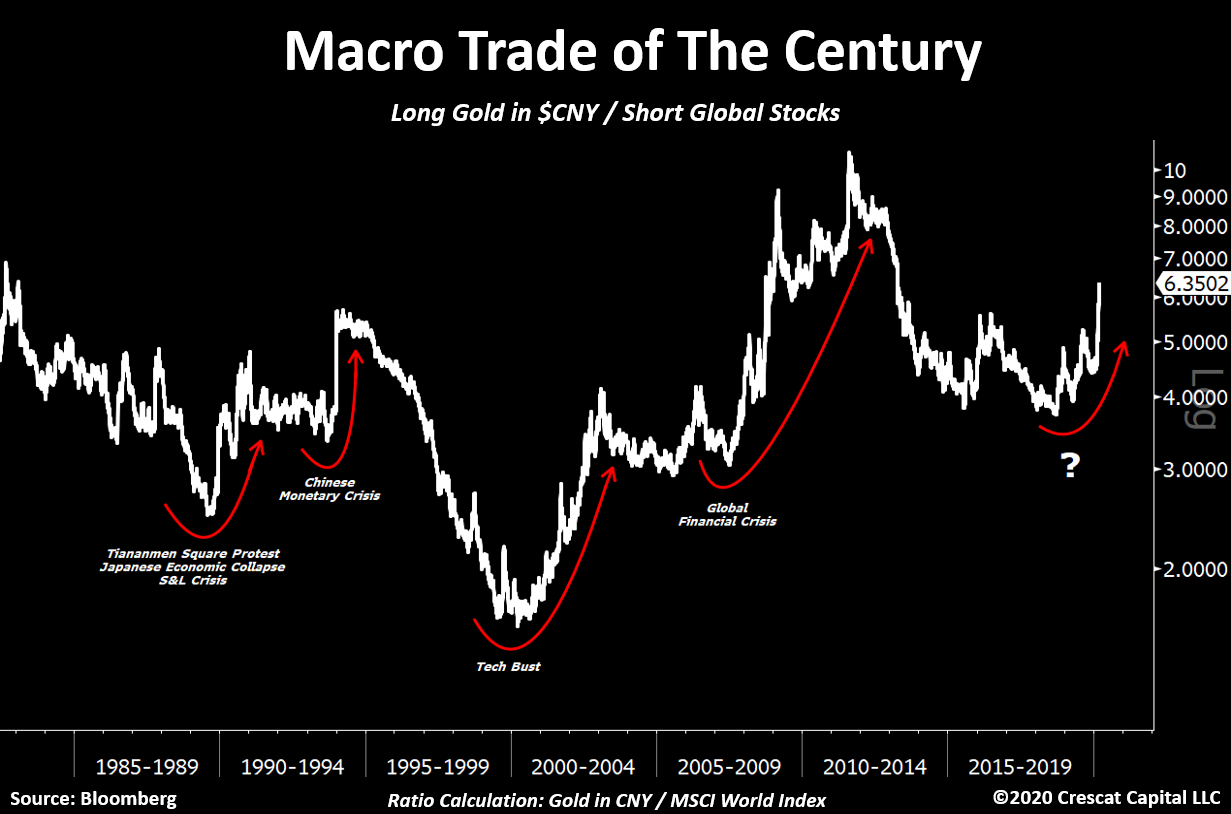
Macro Trade of the Century
Crescat’s “Macro Trade of the Century†has been working phenomenally
well since the market top. We believe our in-depth analysis looking at
the history of economic cycles and the development of macro models is
paying off tremendously. This is just the beginning of this three-legged
trade. The global economy has just entered a recession and the
fundamental damage of the virus outbreak on an already over-leveraged
economy will be greater than anything we have ever seen. We have massive
underfunded pensions with governments and corporations record indebted,
while wealth inequality is at an extreme across the globe. It is not
the ideal mix for asset prices that remain grossly overvalued worldwide.
When investors ask us if our macro themes to position for the
downturn have already played out, the answer is absolutely not. There is
so much more to go. We explain it in three ways:
1) The bursting of China’s credit bubble, the largest we’ve seen in
history, has yet to materialize in its most brutal manner. As macro
imbalances unfold worldwide, the Chinese current account should only
continue to shrink and exacerbate its dollar shortage problem. We expect
that a large devaluation in its currency versus USD is coming soon. We
haven’t seen anything yet. We remain positioned for this in an
asymmetric way through put options in our global macro fund in the yuan
and the Hong Kong dollar.
2) Except for last year, gold, silver, and the precious metals’
miners haven’t yet performed in the way we think they will. Instead they
have recoiled in a major way YTD. Meanwhile, central banks are clearly
losing control of financial markets and further monetary stimulus
appears unavoidable. The entire precious metals’ industry should benefit
from this macro backdrop. The near- and medium-term upside opportunity
in the entire precious metals complex has never looked more attractive
than it does today.
3) Equity markets remain about 30% above their median valuations
throughout history. The coming downturn is one that will likely not stop
at the median. As we showed above, we believe there is much more
downside ahead for stocks at large before we reach the trough of the
current global recession.
In our hedge funds, we added significantly to our precious metals
positions with gains from our short sales late last week. We have also
recently been harvesting profits in some of the most beaten down of our
shorts. We remain net short global equities but much less so than a
month ago and with less gross exposure overall. As a value-oriented
global macro asset management firm, we believe there is so much more to
play out as the economic cycle has only just begun to turn down. We are
not perma-bears, but we are determined to capitalize on this downturn.
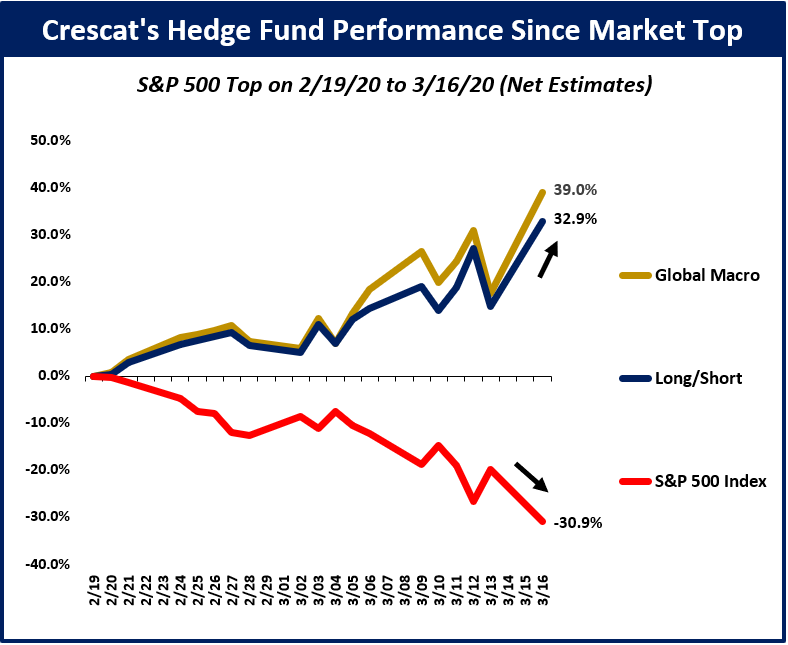
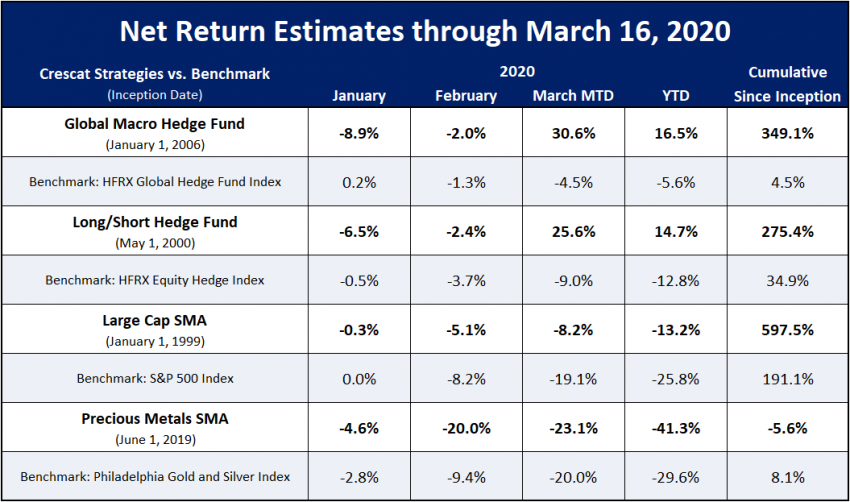
Crescat Performance Update
We have been telling our hedge fund clients for the past several
quarters that we have been tactically positioned for a market and
economic downturn ripe to unfold. Indeed, it has finally begun. Below,
we show how our hedge funds have been performing since the top in the
S&P 500 on February 19:
If you are interested in learning more about Crescat or investing with us, we encourage you to contact Linda Carleu Smith at [email protected] or (303) 228-7371.
Posted by AGORACOM
at 3:04 PM on Tuesday, March 31st, 2020
Sponsor: Affinity Metals Corp. (TSX-V: AFF) is a Canadian mineral exploration company building a strong portfolio of mineral projects in North America. The Corporation’s flagship property is the drill ready Regal Property near Revelstoke, BC where Affinity Metals is making preparations for a spring drill program to test two large Z-TEM anomalies. Click Here for More Info
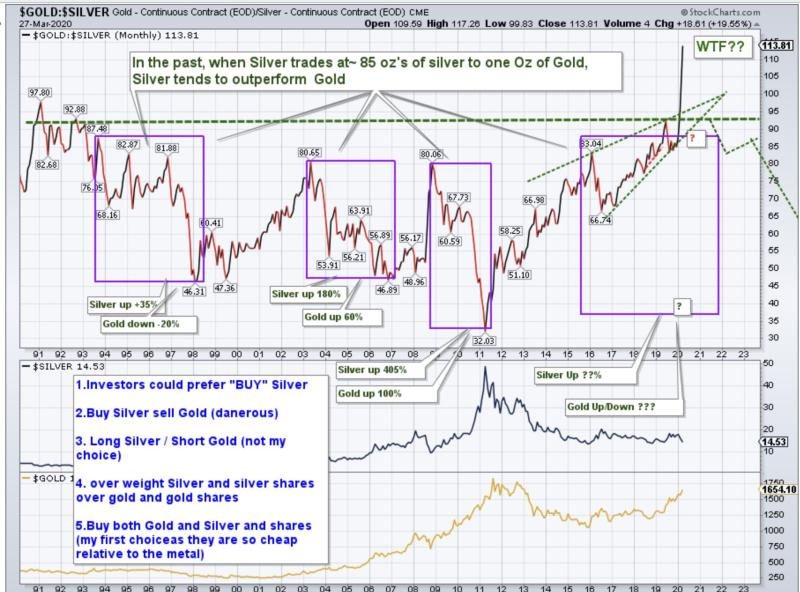
When we don’t understand the present, we can turn to the past. It is
believed the natural ratio in the earth’s crust is ~10 ounces of silver
for one ounce of gold.
Back in 3000 BC in Mesopotamia (modern day Turkey, Iraq, Iran),
silver and gold were used to enable trade at a rate of 5 ounces of
silver to 1 ounce of gold. For about 2,000 years, from 1670 B.C. to 432
AD, the rate was between a low of 9 to 1 in 59-44 BC to a high of 18 to 1
in 422 AD.
For the next 1,000 years from 527 to1453, the price was roughly 15 to
1. For the next three centuries the ratio was a low of 10.75 to 1 to a
high of 15.52 to 1.
When the United States passed its first coinage law in 1792, the
ratio was fixed at 15 to 1 but at that rate gold was considered
undervalued and disappeared from circulation, so to correct the
situation Congress moved the ratio to 16 to 1 in 1834.
At that rate gold was slightly overvalued and silver undervalued and
silver coins began to disappear and were dropped from the list of coins
by the Act of February 12, 1873, or the “Crisis of 1873,” and so
thereafter the U.S. was on the Gold Standard, which became law in the
Gold Act of March 14, 1900. (Hint: two 60 year cycles to today).
In 1919 the ratio was 15.20 to 1; by 1932 the ratio was up to 72.27 to 1 or about five times.
John Newell
is a portfolio manager at Fieldhouse Capital Management and president
and CEO of Golden Sky Minerals Corp. He has 38 years of experience in
the investment industry acting as an officer, director, portfolio
manager and investment advisor with some of the largest investment firms
in Canada. Newell is a specialist in precious metal equities and
related commodities and is a registered portfolio manager in Canada
(advising representative)
Posted by AGORACOM
at 2:51 PM on Tuesday, March 31st, 2020
SPONSOR: Lomiko Metals is focused on the exploration and development
of minerals for the new green economy such as lithium and
graphite. Lomiko owns 80% of the high-grade La Loutre graphite
Property, Lac Des Iles Graphite Property and the 100% owned Quatre
Milles Graphite Property. Lomiko is uniquely poised to supply the
growing EV battery market. Click Here For More Information
It would be wrong to say that wireless charging systems are more
efficient today than wired systems. Even in wireless charging systems,
the phone needs to touch a device, but there are a lot of waves moving
in the air, and MIT researchers are working on a project where we can
use the wasted energy to charge our devices.
Terahertz radiation consists of high-frequency waves in the
electromagnetic spectrum between infrared and microwaves. These waves
are produced by devices that send Wi-Fi signals. Although these
irradiations are very difficult to use, the new method the MIT team has
found seems interesting.
Working principle of the device: It is worth
noting that at this stage the system is still in the project phase and
has not been tested yet. “We are surrounded by electromagnetic waves in
the frequency range of Terahertz radiation. If we turn this energy into
an energy that we can use in everyday life, it helps us fight the energy
problems we face,†said Hiroki Isobe, one of the scientists who led the
study.
The device produced by the team is known as a terahertz rectifier and
consists of a small graphene layer with a boron nitride layer
underneath and an antenna on both sides. These antennas collect
terahertz waves from the air in the environment and strengthen the
signals passing to the graphene. These allow electrons to flow in the
same direction and generate direct current. Graphene must be as pure as
possible, as any foreign matter will affect electron scattering, the
team said. Boron nitride layer is also used to prevent this.
Although Terahertz rectifier produces a small amount of energy at
first, it may be enough to charge small devices. The team first states
that this device can be used in pacemakers. This device, which may have
good results for wireless charging, is expected to be manufactured and
tested.
Posted by AGORACOM
at 12:26 PM on Monday, March 30th, 2020
SPONSOR: American Creek owns a 20% Carried Interest to Production at the Treaty Creek Project in the Golden Triangle. 2019’s first hole averaged 0.683 g/t Au over 780m in a vertical intercept. 2020 drilling plans 18,000 to 20,000 metres from 7-10 drill platforms with four diamond drill rigs. The Treaty Creek property is located in the same hydrothermal system as the Pretivm and Seabridge’s KSM deposits and is fully funded for exploration in 2020. Click Here For More Info
Gold continues to deliver strong relative
performance and was up 7.31% on a year-to-date basis through Friday’s
close. This compares to -20.96% for the S&P 500 Total Return Index.1
Asset
YTD
1 YR
3 YR*
5 YR*
Gold Bullion
7.31%
24.33%
9.07%
6.32%
S&P 500 TR Index
-20.96%
-7.58%
4.82%
6.42%
* Average annual total returns. Bloomberg. Data as of Friday close, 3/27/2020.
Gold and precious metal equities have been collateral damage during
this most recent market correction. The broader markets had become a
tinder box with grossly elevated valuation metrics never seen before,
coupled with an economy burdened by record amounts of leverage
(government, corporate, personal) and widespread investor complacency.
All that was required was a spark — enter COVID-19. The speed of the
correction was historical. The February to March 30% drawdown was the
fastest 30% drawdown of all time (Figure 1).
For us at Sprott, the corresponding selloff in gold bullion and
precious metal equities was not surprising. During violent broader
market corrections, liquidity is priority number one. This time was no
different as broader markets gapped down in response to the greatest
demand shock in modern economic history. This resulted in many entities
selling gold bullion to meet liquidity requirements that surfaced
because of margin calls, and the shuttering of both credit and debt
markets. This pattern is similar to what the market witnessed as the
Global Financial Crisis (GFC) unfolded in 2008-2009.
Figure 1. Feb.-Mar. 2020 Selloff was the Fastest 30% Drawdown in History Measured by Number of Days
Source: BofA Global Research, Bloomberg.
Gold Serves its Function as Portfolio Insurance
Before hypothesizing where we will go from here, it is important to
highlight that gold bullion has served its function as portfolio
insurance. Year to date through March 27, 2020, gold bullion has
appreciated 6.84%, while the S&P 500 Index1 has declined
20.96%. At the same time, gold mining equities have not fared as well
gold bullion, because during the early stages of a correction, gold
stocks are first and foremost stocks; GDX2 was down 10.45% YTD.
The GFC as Playbook
As we are seeing today, there was a material demand shock as the GFC
unfolded, with demand across economies declining suddenly and sharply.
Although not a perfect analog, the GFC can serve as a playbook. As
liquidity became paramount for many market sectors during the GFC, gold
bullion was sold to meet liquidity requirements. From the beginning of
2008 to November 12, 2008 (gold bullion’s low price), the S&P 500
fell 41.11%, gold equities (GDX2) cratered 60.60% and gold
bullion depreciated by a relatively modest 16.94%. Once the U.S. Federal
Reserve (“Fed”) stabilized liquidity conditions, gold bullion and
precious metals stocks generated superior absolute and relative returns.
From November 12, 2008 to the end of 2009, gold bullion rallied 54.02%
and GDX rebounded 138.20%. The S&P 500 declined another 20.62% from
November 12, 2008, to its bottom in March 2009 and then appreciated
64.83% to year-end 2009.
Fed Announces Unlimited QE on March 23
This time around, the Fed and the U.S. federal government are pulling
no punches. Initially the Fed said it would undertake various
operations to provide market liquidity that could total $1.5 trillion.
This would include purchases of treasuries across all maturities and
repo market operations. President Trump then announced interest on
student loans would be waived in addition to a moderate $50 billion
emergency aid package. The Fed then announced another $700 billion
quantitative easing program which would include purchases of municipal
bonds.
This past week, the biggest bazooka of all time was pulled out of the
Fed’s arsenal as it amended its previously announced QE program by
removing limits on its asset purchases and adding corporate bonds to its
list of eligible securities it can purchase. Finally, the U.S.
announced a $2.3 trillion fiscal package. The package equates to 10.6%
of US GDP. The total budget deficit is expected to widen to at least
11.5% of GDP, which are levels not seen since WWII. The package includes
grants (hundreds of billions) and direct payments to taxpayers ($290
billion), both of which are forms of helicopter money.3
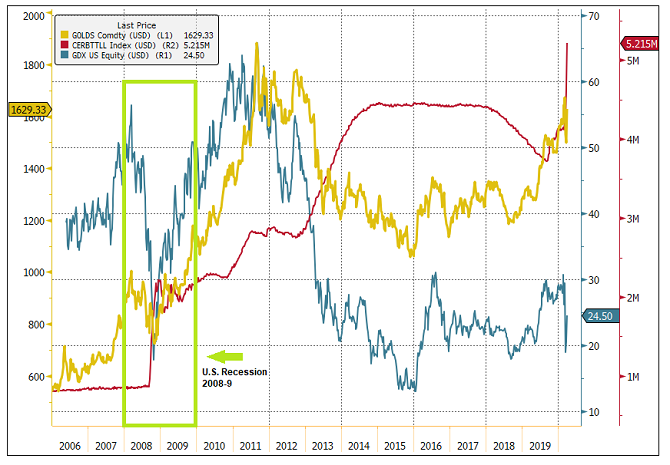
This is very good news for gold bullion and gold equities. There is
an 80% correlation between the Fed’s balance sheet and the price of gold
bullion. Similar to what occurred during the GFC, gold bullion should
move first followed by gold equities (see Figure 2).
A Tailwind for Gold and Gold Stocks
This response has not been limited to the U.S. Globally, we are
seeing central banks and governments deploying unprecedented amounts of
monetary and fiscal stimulus in response to the economic fallout caused
by Covid-19. All these actions should debase fiat currencies while
providing a tremendous tailwind for gold bullion and gold equities.
We believe the table is set for a move in gold bullion and gold equities that could dwarf the second half of 2008.
Figure 2. Fed Balance Sheet vs. Price of Gold Bullion and Gold Equities
Source: Bloomberg. Data as of 3/27/2020. The red
line represents reserve credit outstanding in $ trillions ($5.125
trillion as of 3/27/2020). The yellow line is the gold spot price based on GOLDS Comdty Index. The blue line is the price of gold mining equities represented by GDX.3