Agoracom Blog Home

Posts Tagged ‘#Drilling’

Precious Metals Are About To Reset Like In 2008 – Gold Bugs, Buckle Up! SPONSOR: Loncor Resources $LN.ca $ABX.ca $TECK.ca $RSG $NGT.to $GOLD $NEM

Posted by AGORACOM at 10:48 AM on Monday, April 6th, 2020

Sponsor: Loncor, a Canadian gold explorer controlling over 2,400,000 high grade ounces outside of a Barrick JV. The Ngayu JV property is 200km southwest of the Kibali gold mine, operated by Barrick, which produced 800,000 ounces of gold in 2018. Barrick manages and funds exploration at the Ngayu project until the completion of a pre-feasibility study on any gold discovery meeting their Tier One investment criteria. Newmont $NGT $NEM owns 7.8%, Resolute $RSG owns 27% Click Here for More Info

This image has an empty alt attribute; its file name is Loncor-Small-Square.png

For years, many Gold Bugs (investors who’ve been advocating buying Gold and Silver at low prices as a hedge against future global economic risks) were shunned as conspiracy theorists and nuts. How could these people believe Gold and Silver were solid investments when the Global equities markets were rallying 5% a year consistently – what could go wrong?

Over the past two weeks, I have personally received multiple phone calls and emails from friends and associates asking how these people can suddenly “buy physical metals”. In one case, this individual was purchasing Airline and Food Services stocks in late February thinking this move would be short-lived and telling me how the airlines would recover quickly after this is all over.  Now, that person wants to know my secret contacts for buying physical metals.

If you know any Gold Bugs, you know we’ve built relationships with suppliers, friends and other Gold Bugs throughout the year. Believe it or not, I can still buy physical metals from a few of my closest associates in the industry. Eric Sprott is a fan of my precious metals forecasts and talked about my work a few times publicly.

Yes, the prices have begun to skyrocket a bit – Silver especially.  But I can still buy physical metals because I have a deep resource of friends and suppliers.

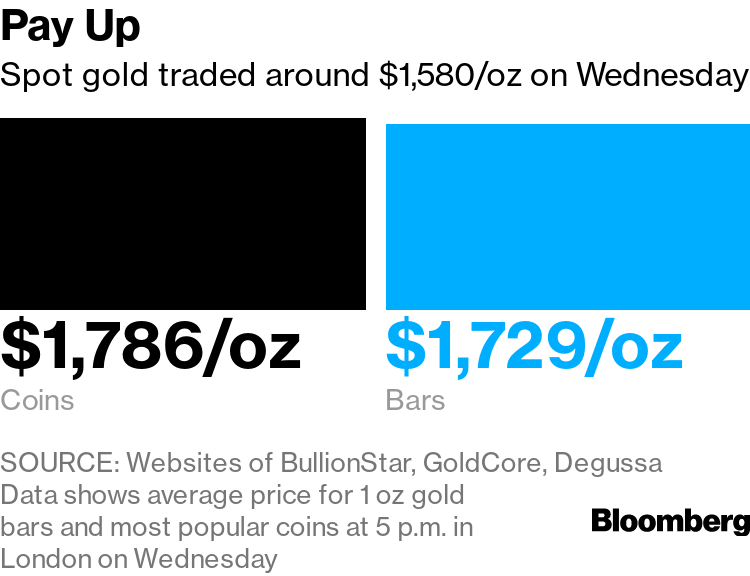
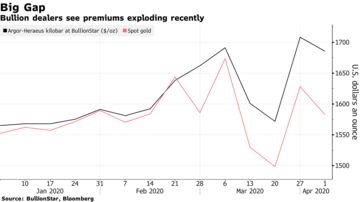
What’s going to happen over the next few weeks is that more and more average people are suddenly going to realize they should have been buying metals as security against risk.  Paper metals are going to explode as well, but physical metals will demand a premium that is much higher than paper/spot price. Right now, one ounce of Silver is going for about $21 to $25 per ounce in physical form (depending on my sources).  The current SPOT price of silver is $14.50. That means the premium for physical Silver is between +45% to +75% right now in the open market.

Daily Gold Chart

This Daily Gold chart highlights the upside Fibonacci price targets using our Adaptive Fibonacci Price Modeling system.  We believe the next upside price target for Gold is $1825. A higher upside price target is visible on this chart near $1950 and we believe Gold prices will reach this level eventually.  But we believe the current $1825 level is the immediate target.  This would represent an immediate +10 upside price advance and would establish NEW HIGH prices for the past 9 years.

Silver Daily Chart

This Silver Daily chart also highlights our Adaptive Fibonacci Price Modeling system and shows an upside price target of $17.25.  Remember, the current physical demand for Gold and Silver has skyrocketed over the past 2+ weeks. The Spot price is really not indicative of the open market price of physical at the moment.  If Spot Silver moves to $17.25 as we predict, that would be a +19% upside price advance.  If Silver advances to $18.25, that would be a +26% upside price advance.

You should also take a look at our silver chart from 1999 and what happened then, and should happen again now as well.

Silver Bugs are loving the setup right now because they know the pattern that sets up in the Metals market when a crisis hits.  First, Gold begins to rally faster than Silver and the Gold to Silver ratio spikes higher.  Then, once the shock-wave of the market crisis subsides, the metals begin a fairly usual price advance where both Gold and Silver advance – in unequal forms.  This is when the real fun for Gold & Silver Bugs begins.

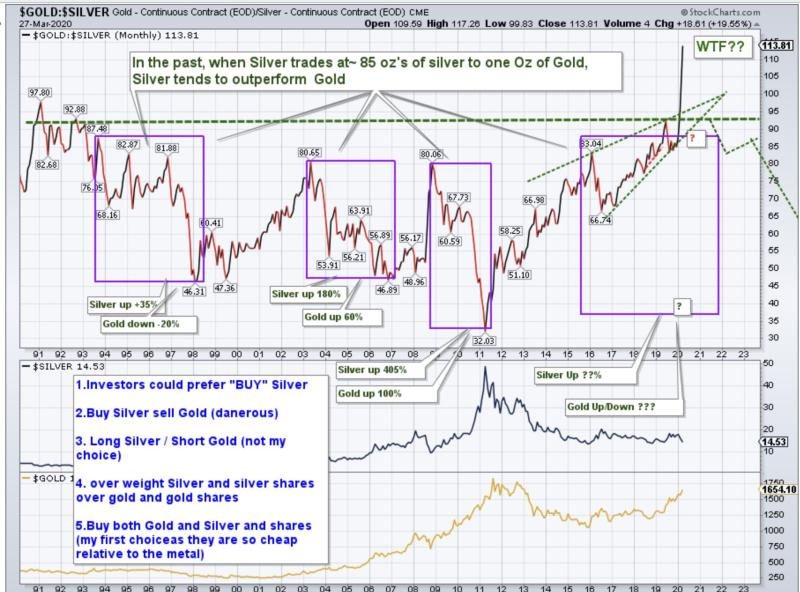
Gold to Silver Weekly Ratio Chart

THE SILVER LINING

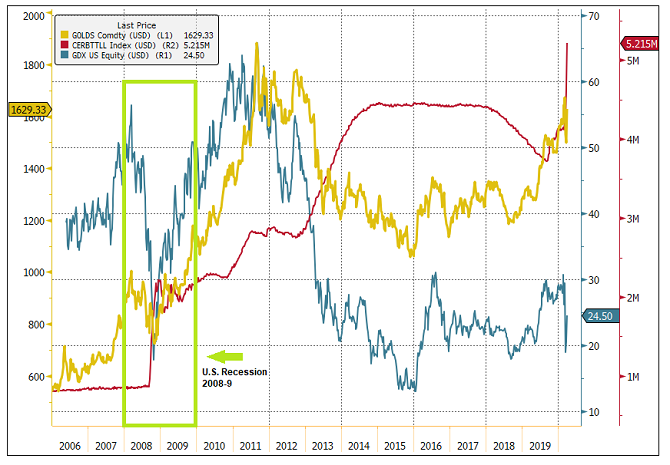
Take a look at this Gold to Silver Weekly Ratio chart.  This chart measures how much one ounce Silver it takes to purchase one ounce of gold at current prices.  Notice that spike in the ratio back in 2008?  That was the spike in gold prices relative to Silver prices as the top formed in 2008 and the “shock wave” struck global investors.  What happened?  Everyone tried to pile into the Gold trade and ignored Silver for about 6+ weeks.

Then what happened to the Gold to Silver Ratio?  It COLLAPSED from levels near 85 to a bottom hear 31.  That means the price of Silver advance almost 3x faster than the price of Gold over that span.  In order for the ratio to fall from near 90 to levels near 30, that indicates a very expansive price increase in the price of Silver.

Now, take a look at what has happened just recently in the Gold to Silver Ratio…  another massive price spike.  This time, the spike reached levels near 120 (Yikes).  Can you guess why Gold and Silver Bugs are so excited right now? If another price advance takes place in precious metals which is similar to the 2008~2011 rally, Gold may see a 300% to 500% rally and Silver may see a 450% to 900% rally over the next 2 to 3 years.

This is no joke.  Physical metals are why Gold and Silver Bugs believe the value of having it in your hands is much better than owning an IOU from a broker or bank.

Get ready for some incredible price moves in the metals markets and congrats to all the Gold and Silver bugs out there.  Our analysis says our patience and accumulation of physical metals will soon pay off in a big way.

As a technical analyst and trader since 1997, I have been through a few bull/bear market cycles. I believe I have a good pulse on the market and timing key turning points for short-term swing traders.

SOURCE:https://finance.yahoo.com/news/precious-metals-reset-2008-gold-223755361.html

Chris Vermeulen
Chief Market Strategies
Founder of Technical Traders Ltd.

Gold Dealers Report Big Shortages of Small Bars and Coins SPONSOR: Labrador Gold $LAB.ca $RIO.ca $WHM.ca $SIC.ca $NXS.ca

Posted by AGORACOM at 11:27 AM on Friday, April 3rd, 2020

SPONSOR: Labrador Gold – Two successful gold explorers lead the way in the Labrador gold rush targeting the under-explored gold potential of the province. Exploration has already outlined district scale gold on two projects, including a 40km strike length of the Florence Lake greenstone belt, one of two greenstone belts covered by the Hopedale Project. Recently acquired 14km of the potential extension of the new discovery by New Found Gold’s Queensway project to the south. Click Here for More Info

  • Small gold bars and coins are in high demand from consumers
  • The size of different products is a key reason for the crunch

Surging demand and disruptions from the coronavirus pandemic have created a shortage of the small gold bars most popular with consumers.

When people are worried about the future they turn to gold to protect their savings. That’s rarely been more true than today.

Surging demand and disruptions from the coronavirus pandemic have created a shortage of the small gold bars most popular with consumers. Those who do manage to get their hands on metal have to pay up –- well above the per-ounce prices being quoted on financial markets in London and New York.

Some dealers are desperately contacting clients to see if anyone is willing to sell their gold bars and coins, and offering a rare premium over spot prices. Others have given up trying to trade altogether.

“People want to buy, not to sell gold,” said Mark O’Byrne, the founder of GoldCore, a dealer based in Dublin. “We have a buyers’ waiting list and we emailed our clients seeing who wished to sell their gold. At this time there is roughly only one or two sellers for every 99 buyers.”

Size is a key reason for the crunch. While there’s plenty of gold in a big trading hub like London, banks and other institutional investors there typically use large bars of 400 ounces. That’s not practical for a regular person who may not want to cough up more than $600,000 for a single bar. Instead, retail investors prefer kilobars (about 32 ounces), 1-ounce bars and coins, or something even smaller.

Those smaller items are getting hard to find for several reasons. First, of course, demand has exploded. But there’s also been pressure on supply, as global travel shuts down and some refineries and mints have stopped operating or capped production because of local lockdowns.

Premiums in the retail market “have exploded,” said Markus Krall, chief executive of German precious-metals retailer Degussa. The average price of products in shops is somewhere between 10% and 15% over spot prices, which he’s never seen before, Krall said. Demand, too, is at the highest level he’s experienced.

Certain products also command more of a premium than others. Kilobars manufactured by Argor-Heraeus SA, one of the big Swiss refiners whose plant has been closed since last week due to the health crisis, were selling for over 6% above spot, said Ronan Manly, an analyst at Singapore dealer BullionStar.

“We are seeing an unprecedented situation where huge customer demand and the disconnect between physical prices and spot prices is driving buy premiums high,” he said. Spot prices coming from London or New York “are completely detached from the reality on the ground.”

Source: https://www.bloomberg.com/amp/news/articles/2020-04-02/want-a-gold-bar-under-your-mattress-get-in-line-and-pay-up

Which Countries Across the World Control the Most Gold? Here’s the Top 25 SPONSOR: American Creek Resources $AMK.ca $TUD.ca $SII.ca $GTT.ca $AFF.ca $SEA.ca $SA $PVG.ca $AOT.ca $ESK.ca

Posted by AGORACOM at 9:54 AM on Friday, April 3rd, 2020

SPONSOR: American Creek owns a 20% Carried Interest to Production at the Treaty Creek Project in the Golden Triangle. 2019’s first hole averaged 0.683 g/t Au over 780m in a vertical intercept. 2020 drilling plans 18,000 to 20,000 metres from 7-10 drill platforms with four diamond drill rigs. The Treaty Creek property is located in the same hydrothermal system as the Pretivm and Seabridge’s KSM deposits and is fully funded for exploration in 2020. Click Here For More Info

https://www.gannett-cdn.com/media/2020/03/23/USATODAY/usatsports/gettyimages-172446421.jpg?width=1280
The nations of the world had 34,700 tons of gold reserves, as of January 2020.

Countries maintain gold reserves to stabilize currency against hyperinflation, particularly in the event of a major crisis like the one many economies worldwide currently face as a result of the coronavirus pandemic. Relatively few countries, however, have large gold reserves. In fact, over 80% of the world’s national gold reserves is held by the central banks and finance ministries of just 25 countries. 

To determine the countries that control the world’s gold, 24/7 Wall St. reviewed data on gold reserves by country in tonnes – or metric tons – as of January 2020 from the World Gold Council. Data on gold as a share of a country’s total foreign exchange reserves also came from the WGC and is current as of January 2020. 

The value of a country’s gold reserves in U.S. dollars was calculated using exchange rates current as of March 13, 2020. GDP and GDP per capita figures in 2018 are from the World Bank and are in constant 2011 international dollars. Data on population is also from the World Bank and is for 2018 or for the most recent period available.

Many, but not all of the countries on this list, are among the wealthiest nations on Earth, as these countries are able to buy up substantial gold reserves. These are the 25 richest countries in the world. 

While some countries on this list have obtained gold reserves by purchasing from other countries, many of the nations with the biggest gold reserves, such as China, the United States, and Russia, are also the top gold-producing countries. China, the largest producer of gold in the world, alone accounted for 14% of global gold production in 2016. 

25. Venezuela

• Gold reserves as of January 2020: 161.2 tonnes

• Gold reserves in USD as of January 2020: $8.1 billion

• Gold as % of total foreign exchange reserves: 81.0%

• GDP: $271 billion ($9,402 per capita)

• Population: 28.9 million

24. Algeria

• Gold reserves as of January 2020: 173.6 tonnes

• Gold reserves in USD as of January 2020: $8.7 billion

• Gold as % of total foreign exchange reserves: 11.6%

• GDP: $580 billion ($13,737 per capita)

• Population: 42.2 million

23. Philippines

• Gold reserves as of January 2020: 197.9 tonnes

• Gold reserves in USD as of January 2020: $9.9 billion

• Gold as % of total foreign exchange reserves: 11.2%

• GDP: $847 billion ($7,943 per capita)

• Population: 106.7 million

22. Belgium

• Gold reserves as of January 2020: 227.4 tonnes

• Gold reserves in USD as of January 2020: $11.4 billion

• Gold as % of total foreign exchange reserves: 39.5%

• GDP: $498 billion ($43,582 per capita)

• Population: 11.4 million

21. Poland

• Gold reserves as of January 2020: 228.6 tonnes

• Gold reserves in USD as of January 2020: $11.5 billion

• Gold as % of total foreign exchange reserves: 9.3%

• GDP: $1.1 trillion ($28,786 per capita)

• Population: 38 million

20. Austria

• Gold reserves as of January 2020: 280.0 tonnes

• Gold reserves in USD as of January 2020: $14.1 billion

• Gold as % of total foreign exchange reserves: 56.1%

• GDP: $409 billion ($46,260 per capita)

• Population: 8.8 million

19. Spain

• Gold reserves as of January 2020: 281.6 tonnes

• Gold reserves in USD as of January 2020: $14.1 billion

• Gold as % of total foreign exchange reserves: 19.1%

• GDP: $1.6 trillion ($34,831 per capita)

• Population: 46.7 million

18. Lebanon

• Gold reserves as of January 2020: 286.8 tonnes

• Gold reserves in USD as of January 2020: $14.4 billion

• Gold as % of total foreign exchange reserves: 27.3%

• GDP: $79 billion ($11,607 per capita)

• Population: 6.8 million

17. United Kingdom

• Gold reserves as of January 2020: 310.3 tonnes

• Gold reserves in USD as of January 2020: $15.6 billion

• Gold as % of total foreign exchange reserves: 9.3%

• GDP: $2.7 trillion ($40,522 per capita)

• Population: 66.5 million

16. Saudi Arabia

• Gold reserves as of January 2020: 323.1 tonnes

• Gold reserves in USD as of January 2020: $16.2 billion

• Gold as % of total foreign exchange reserves: 3.2%

• GDP: $1.7 trillion ($49,101 per capita)

• Population: 33.7 million

15. Uzbekistan

• Gold reserves as of January 2020: 333.7 tonnes

• Gold reserves in USD as of January 2020: $16.8 billion

• Gold as % of total foreign exchange reserves: 56.7%

• GDP: $250 billion ($7,592 per capita)

• Population: 33 million

14. Portugal

• Gold reserves as of January 2020: 382.5 tonnes

• Gold reserves in USD as of January 2020: $19.2 billion

• Gold as % of total foreign exchange reserves: 76.8%

• GDP: $298 billion ($28,999 per capita)

• Population: 10.3 million

13. Kazakhstan

• Gold reserves as of January 2020: 386.5 tonnes

• Gold reserves in USD as of January 2020: $19.4 billion

• Gold as % of total foreign exchange reserves: 67.1%

• GDP: $452 billion ($24,738 per capita)

• Population: 18.3 million

12. Taiwan, province of China

• Gold reserves as of January 2020: 422.4 tonnes

• Gold reserves in USD as of January 2020: $21.2 billion

• Gold as % of total foreign exchange reserves: 4.3%

• GDP: N/A

• Population: N/A

11. Turkey

• Gold reserves as of January 2020: 428.7 tonnes

• Gold reserves in USD as of January 2020: $21.5 billion

• Gold as % of total foreign exchange reserves: 21.8%

• GDP: $2.1 trillion ($25,358 per capita)

• Population: 82.3 million

10. Netherlands

• Gold reserves as of January 2020: 612.5 tonnes

• Gold reserves in USD as of January 2020: $30.8 billion

• Gold as % of total foreign exchange reserves: 70.2%

• GDP: $858 billion ($49,787 per capita)

• Population: 17.2 million

9. India

• Gold reserves as of January 2020: 635 tonnes

• Gold reserves in USD as of January 2020: $31.9 billion

• Gold as % of total foreign exchange reserves: 7%

• GDP: $9.3 trillion ($6,888 per capita)

• Population: 1.4 billion

8. Japan

• Gold reserves as of January 2020: 765.2 tonnes

• Gold reserves in USD as of January 2020: $38.4 billion

• Gold as % of total foreign exchange reserves: 2.9%

• GDP: $5 trillion ($39,294 per capita)

• Population: 126.5 million

7. Switzerland

• Gold reserves as of January 2020: 1,040.0 tonnes

• Gold reserves in USD as of January 2020: $52.3 billion

• Gold as % of total foreign exchange reserves: 6.2%

• GDP: $505 billion ($59,317 per capita)

• Population: 8.5 million

6. China

• Gold reserves as of January 2020: 1,948.3 tonnes

• Gold reserves in USD as of January 2020: $97.9 billion

• Gold as % of total foreign exchange reserves: 3.1%

• GDP: $22.5 trillion ($16,182 per capita)

• Population: 1.4 billion

5. Russia

• Gold reserves as of January 2020: 2,279.2 tonnes

• Gold reserves in USD as of January 2020: $114.5 billion

• Gold as % of total foreign exchange reserves: 20.6%

• GDP: $3.8 trillion ($24,791 per capita)

• Population: 144.5 million

4. France

• Gold reserves as of January 2020: 2,436.0 tonnes

• Gold reserves in USD as of January 2020: $122.4 billion

• Gold as % of total foreign exchange reserves: 63.6%

• GDP: $2.6 trillion ($39,556 per capita)

• Population: 67 million

3. Italy

• Gold reserves as of January 2020: 2,451.8 tonnes

• Gold reserves in USD as of January 2020: $123.2 billion

• Gold as % of total foreign exchange reserves: 69.3%

• GDP: $2.2 trillion ($35,828 per capita)

• Population: 60.4 million

2. Germany

• Gold reserves as of January 2020: 3,366.5 tonnes

• Gold reserves in USD as of January 2020: $169.1 billion

• Gold as % of total foreign exchange reserves: 74%

• GDP: $3.8 trillion ($45,936 per capita)

• Population: 82.9 million

1. United States

• Gold reserves as of January 2020: 8,133.5 tonnes

• Gold reserves in USD as of January 2020: $408.7 billion

• Gold as % of total foreign exchange reserves: 77.9%

• GDP: $18.2 trillion ($55,719 per capita)

• Population: 327.2 million

SOURCE: https://www.usatoday.com/story/money/2020/04/02/countries-that-control-the-worlds-gold/111459474/

24/7 Wall Street is a USA TODAY content partner offering financial news and commentary. Its content is produced independently of USA TODAY.

BMO Hikes #Gold Forecast; Prices ‘Natural Beneficiary’ of Low interest Rates SPONSOR: Affinity Metals $AAF.ca $SII.ca $TUD.ca $GTT.ca $AMK.ca $OSK.ca $RKR.ca

Posted by AGORACOM at 8:03 PM on Thursday, April 2nd, 2020

This image has an empty alt attribute; its file name is Affinity_Metals_Corp_Logo.png

Sponsor: Affinity Metals Corp. (TSX-V: AFF) is a Canadian mineral exploration company building a strong portfolio of mineral projects in North America. The Corporation’s flagship property is the drill ready Regal Property near Revelstoke, BC where Affinity Metals is making preparations for a spring drill program to test two large Z-TEM anomalies. Click Here for More Info

BMO Capital Markets upgraded its forecast for gold prices Wednesday while downgrading the outlook for many other commodities.

BMO sees gold averaging $1,660 an ounce in the second quarter and rising to $1,700 in the fourth. The bank’s full-year forecast is now at $1,654, increasing to $1,698 next year.

The bank looks for silver to average $15.50 an ounce in the second quarter, then $18.50 in the next two quarters, with a full-year average of $17.18. The 2021 outlook was put at $18.05.

A previously expected global economic and industrial recovery in 2020 has been “stopped in its tracks” by the COVID-19 pandemic, BMO said. Businesses are shutting down around the world to slow the spread of the virus. As a result, the bank now expects a 0.8% contraction in global industrial production this year, the first slowdown since 2009.  â€œAnd as a result, we have revised down our 2020 outlook across many of the commodities we cover, while pushing gold expectations higher,” BMO said.

Nevertheless, prices for all commodities – with the exception of iron ore – are likely to be higher next year, as supportive government stimulus efforts take hold, BMO said.

“We see gold as a natural beneficiary of even lower global interest rates and its safe-haven status should receive another airing in 2020,” BMO said. “Meanwhile, we see silver as not only hanging on gold’s coattails, but also potentially outperforming should governments move towards fiscal spending on 5G and solar technology.”

Analysts pointed out that after the 2008 global financial crisis, gold and silver prices recovered months ahead of the global industrial economy.

Meanwhile, BMO said the platinum and palladium markets are likely to be volatile with both weaker auto sales and supply. However, since palladium stocks are already low, another price rally is likely when the auto industry restarts, BMO continued.

Platinum is seen averaging $950 an ounce in the second quarter and $1,000 in the fourth, with a full-year forecast of $971. Palladium is seen averaging $2,500 in the second quarter but falling to $2,250 in the fourth for a full-year average of $2,313.

BMO said its biggest downward revision to commodity prices in 2020 was in copper, but the outlook for other base metals was also lowered, including aluminum, zinc and nickel. These are all industrial metals. Copper is seen averaging $2.27 a pound in the second quarter and $2.33 for the full year.

Source: https://www.kitco.com/news/2020-04-01/BMO-hikes-gold-forecast-prices-natural-beneficiary-of-low-interest-rates.html

Blood in the Streets SPONSOR: Labrador Gold $LAB.ca $RIO.ca $WHM.ca $SIC.ca $NXS.ca

Posted by AGORACOM at 4:21 PM on Tuesday, March 31st, 2020

SPONSOR: Labrador Gold – Two successful gold explorers lead the way in the Labrador gold rush targeting the under-explored gold potential of the province. Exploration has already outlined district scale gold on two projects, including a 40km strike length of the Florence Lake greenstone belt, one of two greenstone belts covered by the Hopedale Project. Recently acquired 14km of the potential extension of the new discovery by New Found Gold’s Queensway project to the south. Click Here for More Info

 Dear Investors:

Are you looking for securities to buy to take advantage of the carnage in the financial markets from the coronavirus? Baron Rothschild, the 18th-century British banker advised that “The time to buy is when there’s blood in the streets, even if it is your own.” He made a fortune buying government bonds in the panic that followed the Battle of Waterloo against Napoleon. But it’s not sovereign debt of the world’s superpowers that is on sale today; it’s not the S&P 500 or Dow either.

US government bonds already had their biggest year-over-year rally ever, and at record low yields, they are no bargain. As for US stocks, it’s only the first month after what we believe was a historic market top. The problem is that the pandemic just so happened to strike at the time of the most over-valued US stock market ever based on a composite of eight valuation indicators tracked by Crescat, even higher than 1929 and 2000. It also hit after a record long bull market and economic expansion. The stock market was already ripe for a major downturn based on an onslaught of deteriorating macro and fundamental data even before the global health emergency.

As we show in the chart above, we believe there is much more downside still ahead for US stocks as a major global recession from nosebleed debt-to-GDP levels has only just begun. Corporate earnings are now poised to plunge and unemployment to surge. These things are perfectly normal. There is a business cycle after all. It must play out as always to purge the economy and markets of their sins and prepare the way for the next growth phase. From the February top for large cap stocks, it would take a 56% selloff just to get to long term mean valuations, a 74% decline to get to one standard deviation below that. In the worst bear markets, valuations get to two standard deviations below the mean. Such realities happened at the depth of the Great Depression, the 1973-4 bear market, and the 1982 double-dip recession. 1932 was an 89% drop from the peak. The initial decline in this market so far is comparable to 1929 in speed and magnitude. There will certainly be bounces, but even after an almost 30% fall in the S&P 500 through yesterday’s close, we are not even close to the “blood in the street” valuations that should mark the bottom for stocks in the current global recession that has only just begun.

But value investors do not have to despair today. There is one area of the stock market that already offers historic low valuations and an incredible buying opportunity right now. Small cap gold and silver mining companies just retested the lows of a 9-year bear market. Last Friday, they were down 84% from their last bull market peak in December 2010! This was a double-bottom retest at a likely higher low compared to the January 2016 low when they were down 87%. Now that is what we call mass murder! In the chart below, we show that precious metals juniors reached record low valuations last Friday relative to gold which is still up 18% year-over-year. Mad value. Look at that beautiful divergence and base. The baby was thrown out with the bathwater in a mass margin call. Last time the ratio was in this vicinity, junior gold and silver miners rallied 200% in 8 months. Crescat owns a portfolio of premier, hand-picked juniors as part of our precious metals SMA and in both hedge funds where clients can gain exposure today. We significantly increased our exposure in our hedge funds amidst the massacre last week.

The entire precious metals group was a casualty of a liquidity crisis, the forced margin call selling for stocks and corporate credit at large in the precipitous market decline. But it was also a victim of a meltdown in dubious levered gold and silver ETF products. These products such as JNUG and NUGT already had a horrific tracking error. Nobody should have ever been investing in them in the first place. Gold stocks are volatile enough on an unlevered basis.

The chief culprit in the ETF space last week was the $3 billion leveraged assets, Direxion Daily Jr. Gold Bull 3x ETF. It absolutely imploded, dropping 95% through last Friday from its recent high on February 21. The fiasco in JNUG was insult to injury for long-time precious metals investors, especially those invested in silver and in junior miners. It was also an incredible buying opportunity that Crescat took advantage of, especially in its hedge funds, where the profits from our short positions at large allowed us to step up. Last week’s action may have marked a major bottom for precious metals mining stocks and ideally a bottom for battered silver this week. As of Friday, miners were on track for their worst quarter ever as we show below.

The gold and silver stock selloff has exposed enormous free cash flow yields today among precious metals mining producers of 10, 20, 30, 40, even 50%. This is completely opposite the stock market at large. Meanwhile, the pure-play junior mining explorers have some of the world’s most attractive gold and silver deposits that can be bought at historic low valuations to proven reserves and resources in the ground. These companies are the beneficiaries of under-investment in exploration and development by the senior producers over the entire precious metals bear market. That rebound may have started yesterday in the mining stocks especially the juniors. It is a historic setup right now for the entire precious metals complex. Central banks are coming in, guns blazing.

Meanwhile, the fundamentals have never been better for gold and silver prices to rise making the discounted present value of these companies even better. Global central bank money printing is poised to explode which is important because the world fiat monetary base is the biggest single macro driver of gold prices. Gold itself is already undervalued relative to global central bank assets which targets gold at $2400 an ounce today.

At the same time, the price of gold is the biggest macro driver of the price of silver, which is gold on steroids. Silver today is the absolute cheapest it has ever been relative to gold and represents an incredible bargain. We think silver is poised to skyrocket along with mining stocks in what should be one of the biggest V-shaped recoveries in the entire financial markets in the near term.

As we have shown in our prior letters, when the yield curve first inverts by 70% or more, there is a high probability of a recession and bear market. At that point, historically it has paid to buy gold and sell stocks for the next 2 years. We went above 70% inversions in August 2019. At Crescat, we continue to express both sides of this trade in our hedge funds and our firm at large. The gold-to-S&P 500 ratio is up 28% since last August. The first part of the move was mostly driven by the rise in gold. Since February 19, its been driven by the decline in stocks. Now we’re at the place where historically both legs start to work in tandem, and yesterday that was evident with one of our best days ever in both Crescat hedge funds.

The Fed has not exhausted all its bullets. It has many forms of monetary stimulus. It can print more money and take interest rates into negative territory if need be. As the downturn in the business cycle becomes more pronounced, these policies will become increasingly called upon. That’s precisely what we are seeing today. Rate cuts everywhere, QE announcements, even forms of helicopter money are being implemented. It won’t save the economic cycle from its normal course, instead, it should only invigorate the reasons for owning precious metals. Central bank money printing and inflationary fiscal policy will almost certainly intensify. This is incredibly bullish for precious metals. We are in a global synchronized debasement environment. Gold has already been appreciating in all major fiat currencies in the world over the last year.

While yields continue to make historic lows worldwide, in real terms they have reached even more extreme levels. For instance, the US 10-year yield is now almost 2 percentage points below inflation. This just further strengthens our precious metals’ long thesis.

Even investment grade (IG) bonds are now blowing up. Implied volatility for IG bonds is surging! It’s now at its highest level since the Great Recession. Last week, the LQD (ETF) plunged 8% in 3 days, which is equivalent to a 10 standard deviation move. Declines as such only happened one other time in history, September 2008. We believe the corporate debt market crisis has just begun.

Stocks are acting like it’s the Great Depression again and we believe a recession has already begun. The probability for a US recession, as measure by this Bloomberg indicator, just surged above 50%. It’s currently at its highest level since the global financial crisis. This indicator leads changes in unemployment by 5 months with a 0.81 correlation. It suggests that the labor market has peaked.

We have also recently noted that the number of full-time employed people is now contracting. This was already rolling over in January. With the recent impacts from the virus outbreak, we believe this number will be plunging imminently.

Macro Trade of the Century

Crescat’s “Macro Trade of the Century” has been working phenomenally well since the market top. We believe our in-depth analysis looking at the history of economic cycles and the development of macro models is paying off tremendously. This is just the beginning of this three-legged trade. The global economy has just entered a recession and the fundamental damage of the virus outbreak on an already over-leveraged economy will be greater than anything we have ever seen. We have massive underfunded pensions with governments and corporations record indebted, while wealth inequality is at an extreme across the globe. It is not the ideal mix for asset prices that remain grossly overvalued worldwide.

When investors ask us if our macro themes to position for the downturn have already played out, the answer is absolutely not. There is so much more to go. We explain it in three ways:

1) The bursting of China’s credit bubble, the largest we’ve seen in history, has yet to materialize in its most brutal manner. As macro imbalances unfold worldwide, the Chinese current account should only continue to shrink and exacerbate its dollar shortage problem. We expect that a large devaluation in its currency versus USD is coming soon. We haven’t seen anything yet. We remain positioned for this in an asymmetric way through put options in our global macro fund in the yuan and the Hong Kong dollar.

2) Except for last year, gold, silver, and the precious metals’ miners haven’t yet performed in the way we think they will. Instead they have recoiled in a major way YTD. Meanwhile, central banks are clearly losing control of financial markets and further monetary stimulus appears unavoidable. The entire precious metals’ industry should benefit from this macro backdrop. The near- and medium-term upside opportunity in the entire precious metals complex has never looked more attractive than it does today.

3) Equity markets remain about 30% above their median valuations throughout history. The coming downturn is one that will likely not stop at the median. As we showed above, we believe there is much more downside ahead for stocks at large before we reach the trough of the current global recession.

In our hedge funds, we added significantly to our precious metals positions with gains from our short sales late last week. We have also recently been harvesting profits in some of the most beaten down of our shorts. We remain net short global equities but much less so than a month ago and with less gross exposure overall. As a value-oriented global macro asset management firm, we believe there is so much more to play out as the economic cycle has only just begun to turn down. We are not perma-bears, but we are determined to capitalize on this downturn.

Crescat Performance Update

We have been telling our hedge fund clients for the past several quarters that we have been tactically positioned for a market and economic downturn ripe to unfold. Indeed, it has finally begun. Below, we show how our hedge funds have been performing since the top in the S&P 500 on February 19:

If you are interested in learning more about Crescat or investing with us, we encourage you to contact Linda Carleu Smith at [email protected] or (303) 228-7371.

Download PDF Version

Sincerely,

Kevin C. Smith, CFA

Chief Investment Officer

 Tavi Costa

Portfolio Manager

© 2020 Crescat Capital LLC

A Historical Perspective on Silver SPONSOR: Affinity Metals $AAF.ca $SII.ca $TUD.ca $GTT.ca $AMK.ca $OSK.ca $RKR.ca

Posted by AGORACOM at 3:04 PM on Tuesday, March 31st, 2020
This image has an empty alt attribute; its file name is Affinity_Metals_Corp_Logo.png

Sponsor: Affinity Metals Corp. (TSX-V: AFF) is a Canadian mineral exploration company building a strong portfolio of mineral projects in North America. The Corporation’s flagship property is the drill ready Regal Property near Revelstoke, BC where Affinity Metals is making preparations for a spring drill program to test two large Z-TEM anomalies. Click Here for More Info

When we don’t understand the present, we can turn to the past. It is believed the natural ratio in the earth’s crust is ~10 ounces of silver for one ounce of gold.

Back in 3000 BC in Mesopotamia (modern day Turkey, Iraq, Iran), silver and gold were used to enable trade at a rate of 5 ounces of silver to 1 ounce of gold. For about 2,000 years, from 1670 B.C. to 432 AD, the rate was between a low of 9 to 1 in 59-44 BC to a high of 18 to 1 in 422 AD.

For the next 1,000 years from 527 to1453, the price was roughly 15 to 1. For the next three centuries the ratio was a low of 10.75 to 1 to a high of 15.52 to 1.

When the United States passed its first coinage law in 1792, the ratio was fixed at 15 to 1 but at that rate gold was considered undervalued and disappeared from circulation, so to correct the situation Congress moved the ratio to 16 to 1 in 1834.

At that rate gold was slightly overvalued and silver undervalued and silver coins began to disappear and were dropped from the list of coins by the Act of February 12, 1873, or the “Crisis of 1873,” and so thereafter the U.S. was on the Gold Standard, which became law in the Gold Act of March 14, 1900. (Hint: two 60 year cycles to today).

In 1919 the ratio was 15.20 to 1; by 1932 the ratio was up to 72.27 to 1 or about five times.

John Newell is a portfolio manager at Fieldhouse Capital Management and president and CEO of Golden Sky Minerals Corp. He has 38 years of experience in the investment industry acting as an officer, director, portfolio manager and investment advisor with some of the largest investment firms in Canada. Newell is a specialist in precious metal equities and related commodities and is a registered portfolio manager in Canada (advising representative)

https://www.streetwisereports.com/article/2020/03/30/an-historical-perspective-on-silver.html

Gold Continues to Prove its Safe Haven Status SPONSOR: American Creek $AMK.ca $TUD.ca $SII.ca $GTT.ca $AFF.ca $SEA.ca $SA $PVG.ca $AOT.ca $ESK.ca

Posted by AGORACOM at 12:26 PM on Monday, March 30th, 2020

SPONSOR: American Creek owns a 20% Carried Interest to Production at the Treaty Creek Project in the Golden Triangle. 2019’s first hole averaged 0.683 g/t Au over 780m in a vertical intercept. 2020 drilling plans 18,000 to 20,000 metres from 7-10 drill platforms with four diamond drill rigs. The Treaty Creek property is located in the same hydrothermal system as the Pretivm and Seabridge’s KSM deposits and is fully funded for exploration in 2020. Click Here For More Info

Gold continues to deliver strong relative performance and was up 7.31% on a year-to-date basis through Friday’s close. This compares to -20.96% for the S&P 500 Total Return Index.

AssetYTD1 YR3 YR*5 YR*
Gold Bullion7.31%24.33%9.07%6.32%
S&P 500 TR Index-20.96%-7.58%4.82%6.42%

* Average annual total returns. Bloomberg. Data as of Friday close, 3/27/2020.

Gold and precious metal equities have been collateral damage during this most recent market correction. The broader markets had become a tinder box with grossly elevated valuation metrics never seen before, coupled with an economy burdened by record amounts of leverage (government, corporate, personal) and widespread investor complacency. All that was required was a spark — enter COVID-19. The speed of the correction was historical. The February to March 30% drawdown was the fastest 30% drawdown of all time (Figure 1). 

For us at Sprott, the corresponding selloff in gold bullion and precious metal equities was not surprising. During violent broader market corrections, liquidity is priority number one. This time was no different as broader markets gapped down in response to the greatest demand shock in modern economic history. This resulted in many entities selling gold bullion to meet liquidity requirements that surfaced because of margin calls, and the shuttering of both credit and debt markets. This pattern is similar to what the market witnessed as the Global Financial Crisis (GFC) unfolded in 2008-2009. 

Figure 1. Feb.-Mar. 2020 Selloff was the Fastest 30% Drawdown in History
Measured by Number of Days

fig 1

Source: BofA Global Research, Bloomberg.

Gold Serves its Function as Portfolio Insurance

Before hypothesizing where we will go from here, it is important to highlight that gold bullion has served its function as portfolio insurance. Year to date through March 27, 2020, gold bullion has appreciated 6.84%, while the S&P 500 Index1 has declined 20.96%. At the same time, gold mining equities have not fared as well gold bullion, because during the early stages of a correction, gold stocks are first and foremost stocks; GDX2 was down 10.45% YTD. 

The GFC as Playbook

As we are seeing today, there was a material demand shock as the GFC unfolded, with demand across economies declining suddenly and sharply.  Although not a perfect analog, the GFC can serve as a playbook. As liquidity became paramount for many market sectors during the GFC, gold bullion was sold to meet liquidity requirements. From the beginning of 2008 to November 12, 2008 (gold bullion’s low price), the S&P 500 fell 41.11%, gold equities (GDX2) cratered 60.60% and gold bullion depreciated by a relatively modest 16.94%. Once the U.S. Federal Reserve (“Fed”) stabilized liquidity conditions, gold bullion and precious metals stocks generated superior absolute and relative returns. From November 12, 2008 to the end of 2009, gold bullion rallied 54.02% and GDX rebounded 138.20%. The S&P 500 declined another 20.62% from November 12, 2008, to its bottom in March 2009 and then appreciated 64.83% to year-end 2009.

Fed Announces Unlimited QE on March 23

This time around, the Fed and the U.S. federal government are pulling no punches. Initially the Fed said it would undertake various operations to provide market liquidity that could total $1.5 trillion. This would include purchases of treasuries across all maturities and repo market operations. President Trump then announced interest on student loans would be waived in addition to a moderate $50 billion emergency aid package. The Fed then announced another $700 billion quantitative easing program which would include purchases of municipal bonds.

This past week, the biggest bazooka of all time was pulled out of the Fed’s arsenal as it amended its previously announced QE program by removing limits on its asset purchases and adding corporate bonds to its list of eligible securities it can purchase. Finally, the U.S. announced a $2.3 trillion fiscal package. The package equates to 10.6% of US GDP. The total budget deficit is expected to widen to at least 11.5% of GDP, which are levels not seen since WWII. The package includes grants (hundreds of billions) and direct payments to taxpayers ($290 billion), both of which are forms of helicopter money.3

This is very good news for gold bullion and gold equities. There is an 80% correlation between the Fed’s balance sheet and the price of gold bullion. Similar to what occurred during the GFC, gold bullion should move first followed by gold equities (see Figure 2).

A Tailwind for Gold and Gold Stocks

This response has not been limited to the U.S. Globally, we are seeing central banks and governments deploying unprecedented amounts of monetary and fiscal stimulus in response to the economic fallout caused by Covid-19. All these actions should debase fiat currencies while providing a tremendous tailwind for gold bullion and gold equities.

We believe the table is set for a move in gold bullion and gold equities that could dwarf the second half of 2008.

Figure 2. Fed Balance Sheet vs. Price of Gold Bullion and Gold Equities

Fed Balance Sheet vs Gold

Source: Bloomberg. Data as of 3/27/2020. The red line represents reserve credit outstanding in $ trillions ($5.125 trillion as of 3/27/2020). The yellow line is the gold spot price based on GOLDS Comdty Index. The blue line is the price of gold mining equities represented by GDX.3

Barrick Unveils 10-Year Plan to Become World’s Most Valued Gold Miner SPONSOR: Loncor Resources $LN.ca $ABX.ca $TECK.ca $RSG $NGT.to $GOLD $NEM

Posted by AGORACOM at 11:24 AM on Monday, March 30th, 2020

Sponsor: Loncor, a Canadian gold explorer controlling over 2,400,000 high grade ounces outside of a Barrick JV. The Ngayu JV property is 200km southwest of the Kibali gold mine, operated by Barrick, which produced 800,000 ounces of gold in 2018. Barrick manages and funds exploration at the Ngayu project until the completion of a pre-feasibility study on any gold discovery meeting their Tier One investment criteria. Newmont $NGT $NEM owns 7.8%, Resolute $RSG owns 27% Click Here for More Info

This image has an empty alt attribute; its file name is Loncor-Small-Square.png
Barrick unveils 10-year plan to become world’s most valued gold miner
  • Barrick unveiled a 10-year production plan aimed at becoming the most valued bullion company
  • Increasing production to 5 million ounces of gold a year
  • Boosted production at Kibali, Congo’s biggest gold mine, which last year beat its production guidance of 750,000 ounces of gold by a substantial margin, delivering a new record of 814,027 ounces.

Barrick Gold (TSX: ABX) (NYSE: GOLD), the world’s second largest gold miner, has unveiled a 10-year production plan, boosting Barrick’s production to about 5 million ounces of gold a year

The strategy, outlined in its first annual report since its merger with Randgold Resources, includes boosting Barrick’s production to about 5 million ounces of gold a year, with the bulk coming from its North American operations.

President and chief executive officer, Mark Bristow, said Nevada Gold Mines — its recent joint venture with Newmont (NYSE: NEM) — would be the “value foundation” of its business moving forward.

“Already the world’s largest gold mining complex, it holds enormous potential for growth,” Bristow said.

Bristow warned the new guidance might be impacted if operations were disrupted due to efforts to slow the spread of the covid-19.  He called the pandemic “a global disaster which is changing the way we work and live in a radically disruptive process with currently no clear end in sight.”

In the past year, Barrick has been focusing on its tier one assets and has reported strong performance across the group, particularly at Cortez mine in Nevada and Veladero in Argentina.

It has also boosted production at Kibali, Congo’s biggest gold mine, which last year beat its production guidance of 750,000 ounces of gold by a substantial margin, delivering a new record of 814,027 ounces.

Porgera in Papua New Guinea has tier one potential but faces many challenges in the form of legacy issues and an unruly neighbourhood,” Bristow said, adding the mine had exceeded guidance and the company continued to negotiate a 20-year lease extension with the government.

The executive, who took the helm in January 2019, said the work done over the past year had equipped Barrick to move to the next level.

“All in all, I am confident that we are more than capable of delivering on our promise: to build the world’s most valued gold company,” he said.

Bristow noted that Barrick’s definition of value was more wide-ranging and included factors such as economic benefits, the care with which it treated its people, communities and environments, its strategic focus on long-term sustainability and returns for investors.

There Is No Gold.’ Bullion Dealers Sell Out In Panic Buying SPONSOR: American Creek $AMK.ca $TUD.ca $SII.ca $GTT.ca $AFF.ca $SEA.ca $SA $PVG.ca $AOT.ca

Posted by AGORACOM at 10:56 AM on Thursday, March 26th, 2020

SPONSOR: American Creek owns a 20% Carried Interest to Production at the Treaty Creek Project in the Golden Triangle. 2019’s first hole averaged 0.683 g/t Au over 780m in a vertical intercept. 2020 drilling plans 18,000 to 20,000 metres from 7-10 drill platforms with four diamond drill rigs. The Treaty Creek property is located in the same hydrothermal system as the Pretivm and Seabridge’s KSM deposits and is fully funded for exploration in 2020. Click Here For More Info

If you think gold GC00, +1.85% has jumped about 10% in a couple of days to $1,638 an ounce, the official price quoted on Wall Street, think again.

The real price? Nearer $1,800. If you can get it.

“There’s no gold,” says Josh Strauss, partner at money manager Pekin Hardy Strauss in Chicago (and a bullion fan). “There’s no gold. There’s roughly a 10% premium to purchase physical gold for delivery. Usually it’s like 2%. I can buy a one ounce American Eagle for $1,800,” said Josh Strauss. “$1,800!”

Major gold dealers have sold out of coins and gold bars amid panic buying as the U.S. economy plunges and the government agreed to a record $2 trillion emergency lifeline.

Kitco, the Canadian gold dealing giant, reported Wednesday that it was out of almost all standard one ounce gold coins. American Eagles and Buffaloes, issued by the U.S. Mint, were out of stock, it reported. Ditto Canadian “Maple Leafs,” issued by the Royal Canadian Mint, “Britannias” issued by the Royal Mint of Great Britain, and “Kangaroos” issued by Australia.

It was out of Krugerrands, issued by the South African government. Those are by far the most widely traded gold coins in the world.

Kitco did not immediately return an email for comment.

Read: Gold faces unique pricing, supply and delivery challenges amid COVID-19 shutdowns

“Due to extreme order volumes, please expect shipping delays of 15+ business days,” warned gold dealer JM Bullion.

Giant U.S. dealer Apmex admits Krugerrands are also out of stock. Deliveries of other coins, including Maple Leafs and Eagles, are delayed “due to extreme demand.” And it is charging a hefty premium for physical gold.

For a one ounce American Eagle: $1,788.

Meanwhile, over at the U.S. Mint, customer service reports they have Eagles available but to buy them direct will cost you $2,175. The media relations team could not immediately be reached.

Almost nobody on Wall Street has noticed the full price surge for actual gold bars and coins. That’s because financial traders mostly just deal in paper “contracts” for gold. Those are basically gold IOUs—a mere promise to deliver gold if the buyer ever wants.

Gold is among the most contentious financial topics around. It pits passionate true believers against total skeptics. People get heated and angry on both sides. Some say it is “the only true money.” Others call it little better than an unproductive superstition. The late British economist John Maynard Keynes called the gold standard, which pegged paper currency to the value of gold, a “barbarous relic” of a bygone age.

What should the average investor make of it? More critically, right now: Is there a case for putting holding some of your retirement account in gold? If so, how and how much?

“We’ve sold most of our gold as interest rates are rising and gold hasn’t liked that for a long time,” says Dennis Nolte, a financial adviser at Seacoast Bank. He adds: “As an asset class gold does best in certain environments, like declining interest rates. We like to own it tactically but not “all weather” as a core ETF (exchange-traded fund) or mutual fund holding.”

“We don’t view gold as a building block when constructing portfolios,” says Rob Greenman, a financial planner at Vista Capital Partners. “The hopes of appreciation are rooted in speculation—perhaps somebody is willing to pay more per ounce in the future versus the price per ounce today. Gold doesn’t produce any interest or earnings. We believe in building portfolios with mix of productive asset classes like stocks, real estate, and bonds around the globe.”

On the other hand, Thomas McCarthy, a financial planner at McCarthy & Cox, a firm that specializes in retirement planning and estates, says putting some of your retirement portfolio into gold isn’t crazy. “Gold can be a hedge against fear and holding a small 5% position of gold in an IRA or 401(k) (very few offer it) is not a bad hedge,” he says. “For clients looking to do so, we use a gold [exchange-traded fund] as opposed to actually buying the physical gold because its significantly less costly and easier to trade.”

But, he warns, “Investors in gold need to remember that gold doesn’t pay interest, doesn’t earn dividends and you make money only if the demand pushes the price higher. Many gold bugs who invested heavily in gold at its peak are still waiting many years later just to break even.”

There is no perfect answer because investing in gold ultimately requires someone else to want to buy it from you. It goes not generate income, like a stock or bond. And it’s not useful either—like food or, as people recently discovered, toilet paper.

Gold requires faith.

The good news? In this crisis you don’t have to choose one side definitely. You can be agnostic and keep your options open.

The events of the past month have upended the financial system. The Federal Reserve—and central banks overseas—have promised to print as much money as is needed to keep economies alive. The U.S. government has agreed to spend $2 trillion propping up the economy, and unless the crisis dissipates quickly that may not be the end of it.

Ordinarily, investors who wanted to protect their accounts from the twin perils of depression and inflation would look to appropriate Treasury bonds. But they are already extremely expensive by any historic measure, so they may offer limited protection. So-called “nominal” or regular Treasury bonds, the type most people own, now sport minuscule interest rates. Even the longest dated, 30 year Treasurys, yield just 1.4%. That is below most expected rates of inflation. Meanwhile Treasury inflation-protected securities or TIPS, a type of Treasury bond that is designed specifically to protect your money against any rise in consumer prices, now offer inflation-adjusted yields that are actually slightly negative. In other words, you’re almost guaranteed to lose a small amount of purchasing power over the life of the bond.

In these circumstances, gold ceases to look quite so crazy as portfolio insurance. There is genuine debate about whether gold offers a “long term hedge” against inflation. And no one actually knows what gold is “really” worth, if it is “really” worth anything. Intelligent, sane financial experts can make plausible cases for a range of values from a few hundred dollars an ounce to many thousands.

But gold makes more sense when viewed, not as an investment, but as a type of currency. It doesn’t produce anything, but it can be used as a medium of exchange. And history strongly suggests that it has a low correlation with other assets. In other words, it tends to “zig” when everything else zags.

It’s certainly done that under the current administration. Gold has risen by 38% since Donald Trump’s inauguration. Meanwhile the S&P 500 SPX, +3.85% index of large U.S. companies is up 13%, and the Russell 2000 RUT, +4.32% index of small U.S. companies is down 8%.

“The case for gold is simple,” says Strauss. “You want to own gold in times of financial dislocation and or inflation. And that’s been the case since time immemorial. And gold behaves well in those cases. In those cases stocks behave poorly. It’s a great portfolio hedge. Gold does poorly when you’ve got strong economic growth and low inflation. Tell me when that’s going to happen. Gold held its value during 2008 and after all that money printing it tripled over the next three years.”

Strauss recommends Sprott Physical Gold, PHYS, +1.41% an exchange-traded fund where shares are matched to actual bullion in a vault. He says he holds 25% of his personal wealth in gold. For those who are agnostics? “I think it’s criminal to go below 10%,” he joked, “but start with 5%.”

https://www.marketwatch.com/story/there-is-no-gold-bullion-dealers-sell-out-in-panic-buying-2020-03-25

Blood in the Streets SPONSOR: Affinity Metals $AAF.ca $SII.ca $TUD.ca $GTT.ca $AMK.ca $OSK.ca $RKR.ca

Posted by AGORACOM at 10:32 AM on Thursday, March 26th, 2020
This image has an empty alt attribute; its file name is Affinity_Metals_Corp_Logo.png

Sponsor: Affinity Metals Corp. (TSX-V: AFF) is a Canadian mineral exploration company building a strong portfolio of mineral projects in North America. The Corporation’s flagship property is the drill ready Regal Property near Revelstoke, BC where Affinity Metals is making preparations for a spring drill program to test two large Z-TEM anomalies. Click Here for More Info

 Dear Investors:

Are you looking for securities to buy to take advantage of the carnage in the financial markets from the coronavirus? Baron Rothschild, the 18th-century British banker advised that “The time to buy is when there’s blood in the streets, even if it is your own.” He made a fortune buying government bonds in the panic that followed the Battle of Waterloo against Napoleon. But it’s not sovereign debt of the world’s superpowers that is on sale today; it’s not the S&P 500 or Dow either.

US government bonds already had their biggest year-over-year rally ever, and at record low yields, they are no bargain. As for US stocks, it’s only the first month after what we believe was a historic market top. The problem is that the pandemic just so happened to strike at the time of the most over-valued US stock market ever based on a composite of eight valuation indicators tracked by Crescat, even higher than 1929 and 2000. It also hit after a record long bull market and economic expansion. The stock market was already ripe for a major downturn based on an onslaught of deteriorating macro and fundamental data even before the global health emergency.

As we show in the chart above, we believe there is much more downside still ahead for US stocks as a major global recession from nosebleed debt-to-GDP levels has only just begun. Corporate earnings are now poised to plunge and unemployment to surge. These things are perfectly normal. There is a business cycle after all. It must play out as always to purge the economy and markets of their sins and prepare the way for the next growth phase. From the February top for large cap stocks, it would take a 56% selloff just to get to long term mean valuations, a 74% decline to get to one standard deviation below that. In the worst bear markets, valuations get to two standard deviations below the mean. Such realities happened at the depth of the Great Depression, the 1973-4 bear market, and the 1982 double-dip recession. 1932 was an 89% drop from the peak. The initial decline in this market so far is comparable to 1929 in speed and magnitude. There will certainly be bounces, but even after an almost 30% fall in the S&P 500 through yesterday’s close, we are not even close to the “blood in the street” valuations that should mark the bottom for stocks in the current global recession that has only just begun.

But value investors do not have to despair today. There is one area of the stock market that already offers historic low valuations and an incredible buying opportunity right now. Small cap gold and silver mining companies just retested the lows of a 9-year bear market. Last Friday, they were down 84% from their last bull market peak in December 2010! This was a double-bottom retest at a likely higher low compared to the January 2016 low when they were down 87%. Now that is what we call mass murder! In the chart below, we show that precious metals juniors reached record low valuations last Friday relative to gold which is still up 18% year-over-year. Mad value. Look at that beautiful divergence and base. The baby was thrown out with the bathwater in a mass margin call. Last time the ratio was in this vicinity, junior gold and silver miners rallied 200% in 8 months. Crescat owns a portfolio of premier, hand-picked juniors as part of our precious metals SMA and in both hedge funds where clients can gain exposure today. We significantly increased our exposure in our hedge funds amidst the massacre last week.

The entire precious metals group was a casualty of a liquidity crisis, the forced margin call selling for stocks and corporate credit at large in the precipitous market decline. But it was also a victim of a meltdown in dubious levered gold and silver ETF products. These products such as JNUG and NUGT already had a horrific tracking error. Nobody should have ever been investing in them in the first place. Gold stocks are volatile enough on an unlevered basis.

The chief culprit in the ETF space last week was the $3 billion leveraged assets, Direxion Daily Jr. Gold Bull 3x ETF. It absolutely imploded, dropping 95% through last Friday from its recent high on February 21. The fiasco in JNUG was insult to injury for long-time precious metals investors, especially those invested in silver and in junior miners. It was also an incredible buying opportunity that Crescat took advantage of, especially in its hedge funds, where the profits from our short positions at large allowed us to step up. Last week’s action may have marked a major bottom for precious metals mining stocks and ideally a bottom for battered silver this week. As of Friday, miners were on track for their worst quarter ever as we show below.

The gold and silver stock selloff has exposed enormous free cash flow yields today among precious metals mining producers of 10, 20, 30, 40, even 50%. This is completely opposite the stock market at large. Meanwhile, the pure-play junior mining explorers have some of the world’s most attractive gold and silver deposits that can be bought at historic low valuations to proven reserves and resources in the ground. These companies are the beneficiaries of under-investment in exploration and development by the senior producers over the entire precious metals bear market. That rebound may have started yesterday in the mining stocks especially the juniors. It is a historic setup right now for the entire precious metals complex. Central banks are coming in, guns blazing.

Meanwhile, the fundamentals have never been better for gold and silver prices to rise making the discounted present value of these companies even better. Global central bank money printing is poised to explode which is important because the world fiat monetary base is the biggest single macro driver of gold prices. Gold itself is already undervalued relative to global central bank assets which targets gold at $2400 an ounce today.

At the same time, the price of gold is the biggest macro driver of the price of silver, which is gold on steroids. Silver today is the absolute cheapest it has ever been relative to gold and represents an incredible bargain. We think silver is poised to skyrocket along with mining stocks in what should be one of the biggest V-shaped recoveries in the entire financial markets in the near term.

As we have shown in our prior letters, when the yield curve first inverts by 70% or more, there is a high probability of a recession and bear market. At that point, historically it has paid to buy gold and sell stocks for the next 2 years. We went above 70% inversions in August 2019. At Crescat, we continue to express both sides of this trade in our hedge funds and our firm at large. The gold-to-S&P 500 ratio is up 28% since last August. The first part of the move was mostly driven by the rise in gold. Since February 19, its been driven by the decline in stocks. Now we’re at the place where historically both legs start to work in tandem, and yesterday that was evident with one of our best days ever in both Crescat hedge funds.

The Fed has not exhausted all its bullets. It has many forms of monetary stimulus. It can print more money and take interest rates into negative territory if need be. As the downturn in the business cycle becomes more pronounced, these policies will become increasingly called upon. That’s precisely what we are seeing today. Rate cuts everywhere, QE announcements, even forms of helicopter money are being implemented. It won’t save the economic cycle from its normal course, instead, it should only invigorate the reasons for owning precious metals. Central bank money printing and inflationary fiscal policy will almost certainly intensify. This is incredibly bullish for precious metals. We are in a global synchronized debasement environment. Gold has already been appreciating in all major fiat currencies in the world over the last year.

While yields continue to make historic lows worldwide, in real terms they have reached even more extreme levels. For instance, the US 10-year yield is now almost 2 percentage points below inflation. This just further strengthens our precious metals’ long thesis.

Even investment grade (IG) bonds are now blowing up. Implied volatility for IG bonds is surging! It’s now at its highest level since the Great Recession. Last week, the LQD (ETF) plunged 8% in 3 days, which is equivalent to a 10 standard deviation move. Declines as such only happened one other time in history, September 2008. We believe the corporate debt market crisis has just begun.

Stocks are acting like it’s the Great Depression again and we believe a recession has already begun. The probability for a US recession, as measure by this Bloomberg indicator, just surged above 50%. It’s currently at its highest level since the global financial crisis. This indicator leads changes in unemployment by 5 months with a 0.81 correlation. It suggests that the labor market has peaked.

We have also recently noted that the number of full-time employed people is now contracting. This was already rolling over in January. With the recent impacts from the virus outbreak, we believe this number will be plunging imminently.

Macro Trade of the Century

Crescat’s “Macro Trade of the Century” has been working phenomenally well since the market top. We believe our in-depth analysis looking at the history of economic cycles and the development of macro models is paying off tremendously. This is just the beginning of this three-legged trade. The global economy has just entered a recession and the fundamental damage of the virus outbreak on an already over-leveraged economy will be greater than anything we have ever seen. We have massive underfunded pensions with governments and corporations record indebted, while wealth inequality is at an extreme across the globe. It is not the ideal mix for asset prices that remain grossly overvalued worldwide.

When investors ask us if our macro themes to position for the downturn have already played out, the answer is absolutely not. There is so much more to go. We explain it in three ways:

1) The bursting of China’s credit bubble, the largest we’ve seen in history, has yet to materialize in its most brutal manner. As macro imbalances unfold worldwide, the Chinese current account should only continue to shrink and exacerbate its dollar shortage problem. We expect that a large devaluation in its currency versus USD is coming soon. We haven’t seen anything yet. We remain positioned for this in an asymmetric way through put options in our global macro fund in the yuan and the Hong Kong dollar.

2) Except for last year, gold, silver, and the precious metals’ miners haven’t yet performed in the way we think they will. Instead they have recoiled in a major way YTD. Meanwhile, central banks are clearly losing control of financial markets and further monetary stimulus appears unavoidable. The entire precious metals’ industry should benefit from this macro backdrop. The near- and medium-term upside opportunity in the entire precious metals complex has never looked more attractive than it does today.

3) Equity markets remain about 30% above their median valuations throughout history. The coming downturn is one that will likely not stop at the median. As we showed above, we believe there is much more downside ahead for stocks at large before we reach the trough of the current global recession.

In our hedge funds, we added significantly to our precious metals positions with gains from our short sales late last week. We have also recently been harvesting profits in some of the most beaten down of our shorts. We remain net short global equities but much less so than a month ago and with less gross exposure overall. As a value-oriented global macro asset management firm, we believe there is so much more to play out as the economic cycle has only just begun to turn down. We are not perma-bears, but we are determined to capitalize on this downturn.

Crescat Performance Update

We have been telling our hedge fund clients for the past several quarters that we have been tactically positioned for a market and economic downturn ripe to unfold. Indeed, it has finally begun. Below, we show how our hedge funds have been performing since the top in the S&P 500 on February 19:

If you are interested in learning more about Crescat or investing with us, we encourage you to contact Linda Carleu Smith at [email protected] or (303) 228-7371.

Download PDF Version

Sincerely,

Kevin C. Smith, CFA

Chief Investment Officer

 Tavi Costa

Portfolio Manager

© 2020 Crescat Capital LLC