Agoracom Blog Home

Posts Tagged ‘#NewmontGold’

Loncor $LN.ca – The Road To Retirement: Millennials Put Their Faith In Bitcoin But Goldman Says Go With Gold $ABX.ca $TECK.ca $RSG $NGT.to

Posted by AGORACOM at 3:32 PM on Monday, December 9th, 2019
This image has an empty alt attribute; its file name is Loncor-Small-Square.png

Sponsor: Loncor is a Canadian gold exploration company focused on two projects in the DRC – the Ngayu and North Kivu projects. Both projects have historic gold production. Exploration at the Ngayu project is currently being undertaken by Loncor’s joint venture partner Barrick Gold. The Ngayu project is 200km southwest of the Kibali gold mine, operated by Barrick, which produced 800,000 ounces of gold in 2018. Barrick manages and funds exploration at the Ngayu project until the completion of a pre-feasibility study on any gold discovery meeting the investment criteria of Barrick. Click Here for More Info

  • Millennials’ willingness to accept ever-increasing central-planning means gold is the go-to asset to preserve wealth over long-term horizons
  • Goldman keeps its 3,6 and 12m forecasts at $1,600toz.

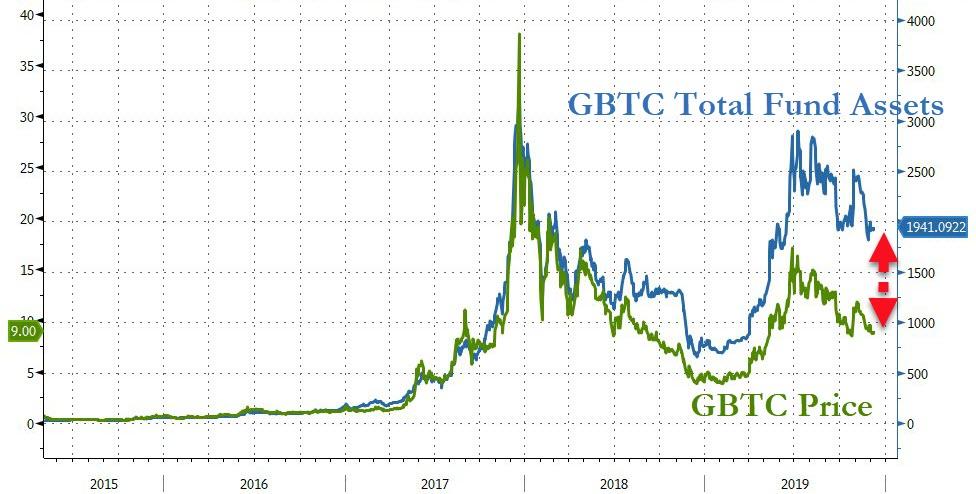
“Drop Gold” – the ever-present tagline of Grayscale’s Bitcoin Trust TV commercial – appears to be working its magic on a certain cohort of society.

https://youtu.be/x6B6cj1CIMk

2019 has seen assets under management in GBTC soar…

Source: Bloomberg

And for Millennials, according to the latest data from Charles Schwab, the Grayscale Bitcoin Trusts is the 5th largest holding in retirement accounts (including 401(k)s) with almost 2% of their assets tied to the success (or failure) of the largest cryptocurrency.

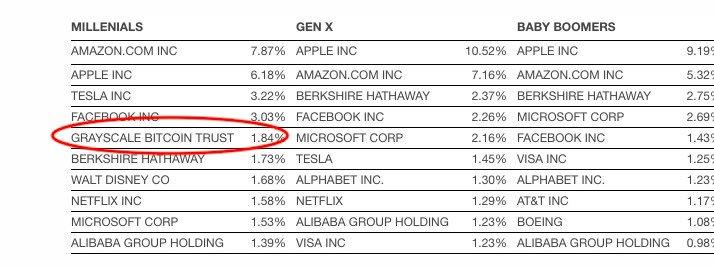
For now this remains a relatively small number…

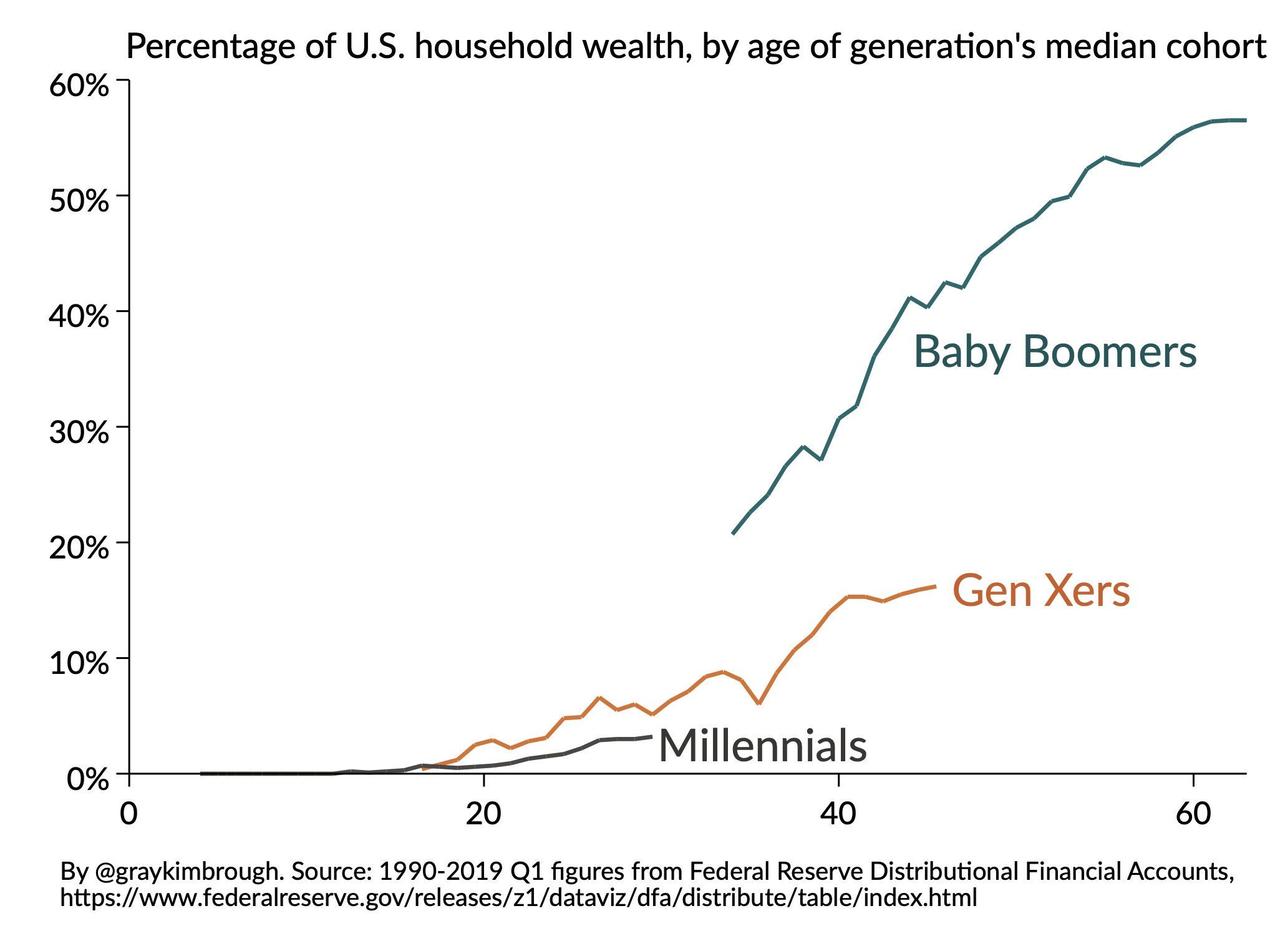
But, given the increasing acceptance of socialist policies, and the historically-ignorant promise of MMT (and don’t forget UBI), Goldman Sachs suggests that Millennials’ willingness to accept ever-increasing central-planning means gold is the go-to asset to preserve wealth over long-term horizons.

And, at least in the short-term, gold has held its value (relative to Bitcoin) as the world’s volume of negative-yielding assets has shrunk on the latest round of optimism that ‘this time is different’…
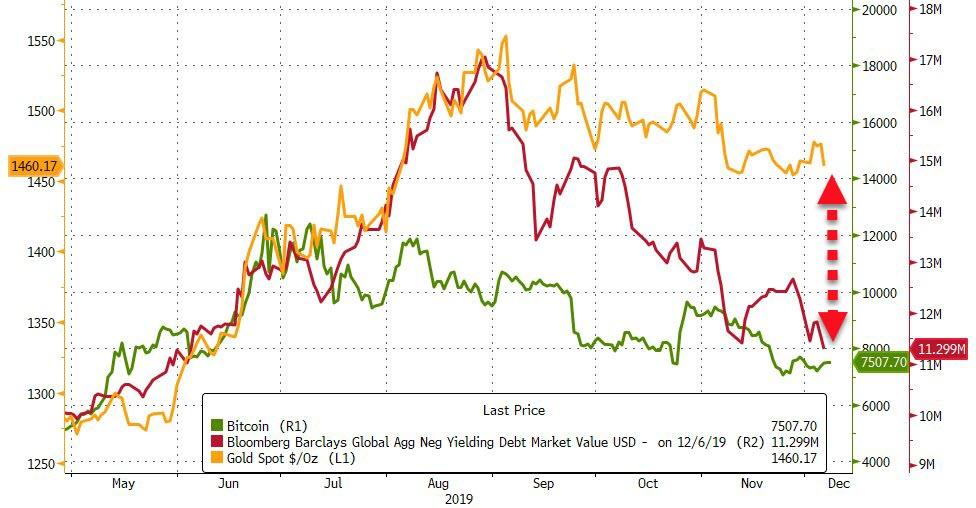
Source: Bloomberg

Indeed, Goldman notes that gold looks attractive particularly relative to DM bonds. Both bonds and gold are defensive assets which go up in value when fear spikes. Exhibit 5 shows that investment and central bank demand for gold has been highly correlated with US 10 year real rates.

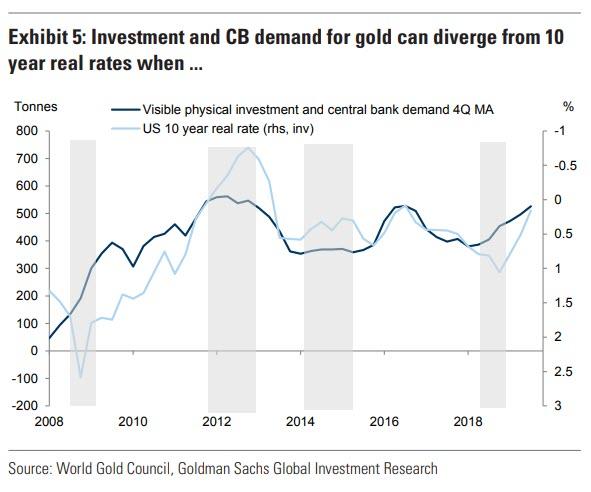
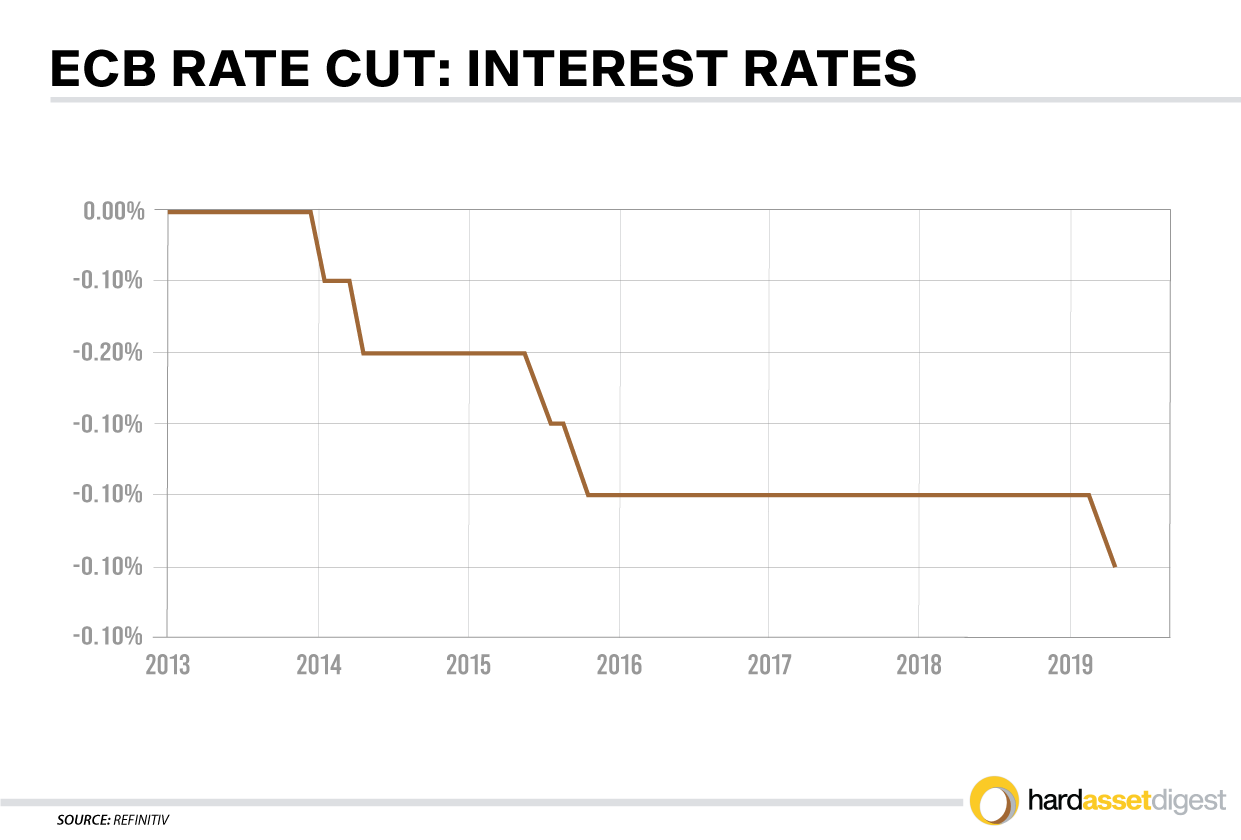
During the next recession gold may offer better diversification value to bonds because the latter may be capped by the lower bound in rates limiting their ability to appreciate materially. This is particularly relevant for Europe where rates are already close to the lower bound. This means that during the next recession when fear spikes, gold may decouple from rates and outperform them.

Specifically, Goldman says that Gold is a particularly good diversifier for investors with long term investment horizon.

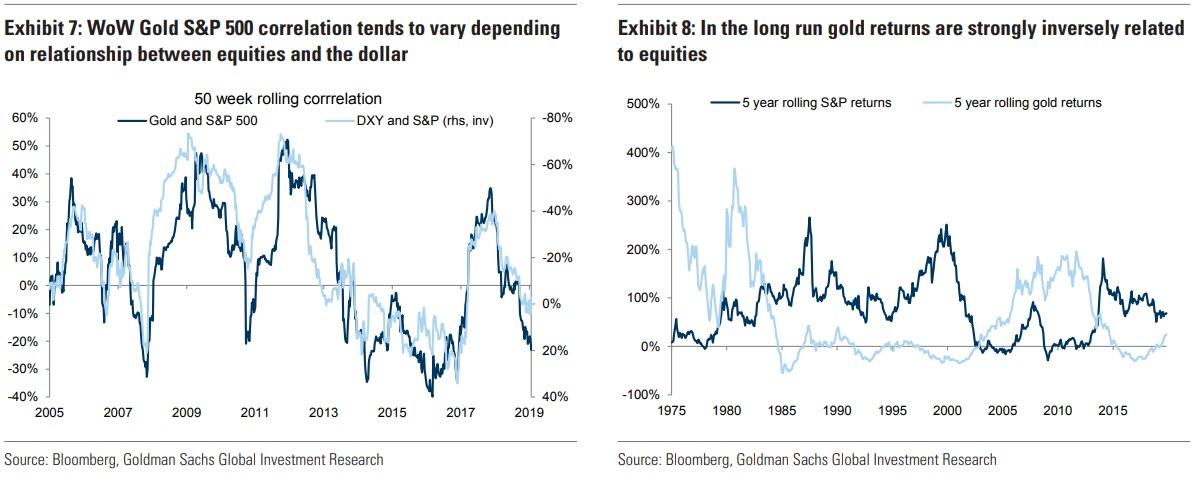
If we look at week on week changes in gold they tend to be dominated by the dollar. As a result the gold S&P500 weekly changes correlation looks almost identical to correlation of S&P 500 and the dollar (see Exhibit 7).

However, if we look at 5 year returns gold and S&P 500 display strong inverse relationship with gold performing great during the 1970ies and 2000s when the S&P 500 underperformed (see Exhibit 8).

This makes sense given that gold is ultimately a hedge against systematic macro risks, which can lead to long periods of equity underperformance. Our strategy team also finds that gold historically has been a good hedge against periods of large drawdowns of the 60/40 portfolio. This was particularly true when a drawdown is caused by accelerating inflation as it was in the 1970ies. Therefore, if one is concerned that the low macro volatility of 2010s will be followed by higher volatility in the 2020s, which would hurt equities, gold would be a good addition to the portfolio.

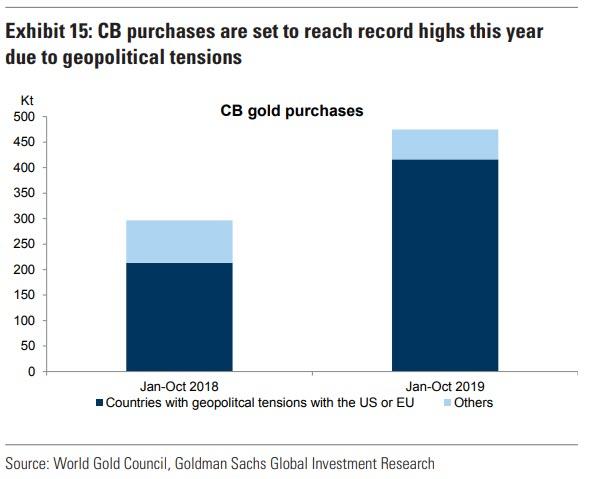
Geopolitical uncertainty is already translating into greater gold demand. CBs globally have been buying gold at a very strong pace, albeit more recently the rate of CB purchases has cooled off as China and Russia have moderated their buying. Nevertheless, 2019 still looks to be a record year for CB gold purchases with our target of 750 tonnes combined purchases likely to be met (see Exhibit 15).

Rising political risk – together with negative European rates – may be an important reason behind the large share of unaccounted gold investment over the past several years.

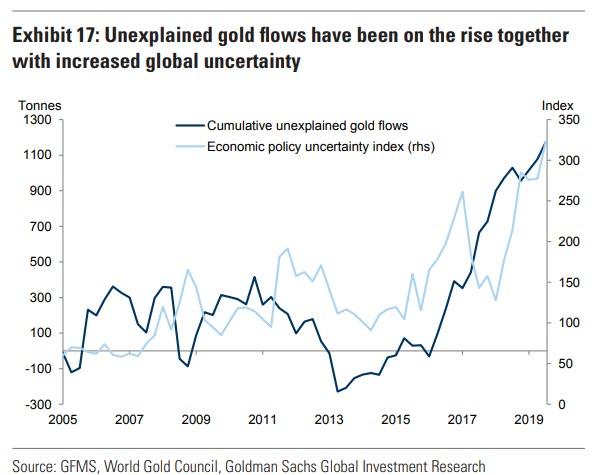
Exhibit 17 shows cumulative unexplained gold demand based on World Gold Council (post 2010) and GFMS (pre 2010) balances data. It surged since 2016. Similar dynamics can be seen when we look at implied vaulted gold stocks built in the UK and Switzerland, which is calculated as implied cumulative total net imports minus transparent ETF gold stocks. In fact, since the end of 2016 the implied build in non-transparent gold investment has been much larger than the build in visible gold ETFs. This is consistent with reports that vault demand globally is surging.

Political risks, in our view, help explain this because if an individual is trying to minimize the risks of sanctions or wealth taxes, then buying physical gold bars and storing them in a vault, where it is more difficult for governments to reach them, makes sense. Finally, this build can also reflect hedges by global high net worth individuals against tail economic and political risk scenarios in which they do not want to have any financial entity intermediating their gold positions due to the counterparty credit risk involved.

Finally, Modern Monetary Theory (MMT) – which advocates for central bank financed fiscal deficits – has been gaining more airtime recently, with former Fed Chair Ben Bernanke and former Fed Vice Chair Stanley Fischer offering similar proposals. The logic is that persistent low inflation and lack of borrowing capacity in many developed markets means that direct CB financing of government deficit is warranted. This is especially true for countries where monetary policy is close to the limits of its capacity. Whilst there are arguments to be made in favor of MMT there are also risks associated with it. Notably some economists stress that if not used responsibly it could lead to a material acceleration in inflation.

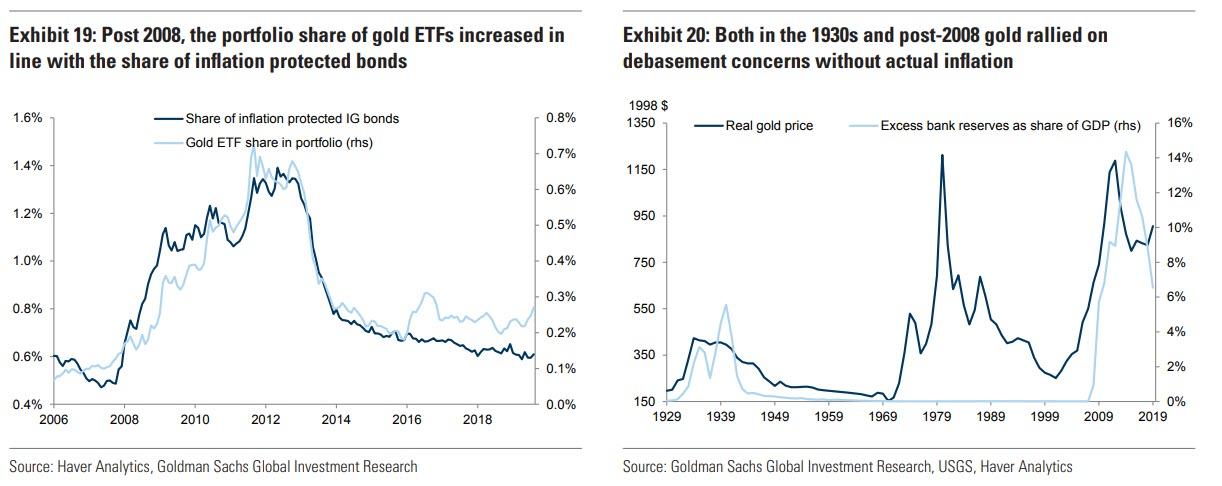
In the next recession, our US economists do not expect governments to adopt direct monetary financing and expect inflation to remain firmly anchored. But this doesn’t necessarily prevent an increase in debasement concerns if conversations around MMT become more widespread — a potential boost to demand for gold as a debasement hedge. False debasement concerns have led to gold rallies in the past. Post 2008 aggressive QE in the US led to a considerable push into inflation protected assets including gold (see Exhibit 19). These inflationary concerns did not materialise and the allocation to gold and inflation protected bonds fell sharply in 2013. Another period, currently is less talked about, is the Great Depression when the Fed pumped a lot of money into the economy leading to debasement concerns (see Exhibit 20). What followed was actually disinflation and the gold price eventually moderated.

Overall, while Goldman acknowledges the risks related to still high gold positions we believe the strategic case is still strong, particularly for investors with long term horizons.

This is based on a deteriorated attractiveness of long term DM bonds as portfolio diversifiers and real return generation instruments, exposure to growing EM wealth, limited mine supply growth, elevated political risks and a potential increase in debasement concerns sparked by rising airtime of Modern Monetary Theory.

As such Goldman keeps its 3,6 and 12m forecasts at $1,600toz.

So – will Millennials keep saying “bye gold” or come over the ‘dark side’ and “buy gold”?

Loncor $LN.ca – Gold is Looking More and More Attractive $ABX.ca $TECK.ca $RSG $NGT.to

Posted by AGORACOM at 1:42 PM on Monday, November 25th, 2019
This image has an empty alt attribute; its file name is Loncor-Small-Square.png

Sponsor: Loncor is a Canadian gold exploration company focused on two projects in the DRC – the Ngayu and North Kivu projects. Both projects have historic gold production. Exploration at the Ngayu project is currently being undertaken by Loncor’s joint venture partner Barrick Gold. The Ngayu project is 200km southwest of the Kibali gold mine, operated by Barrick, which produced 800,000 ounces of gold in 2018. Barrick manages and funds exploration at the Ngayu project until the completion of a pre-feasibility study on any gold discovery meeting the investment criteria of Barrick. Click Here for More Info

Rising US liabilities for entitlements could undermine the dollar

The Dutch Central Bank recently argued in an article that if there were to be a major monetary reset, “gold stock can serve as a basis” to rebuild the global monetary system. “Gold bolsters confidence in the stability of the central bank’s balance sheet and creates a sense of security.”

Talk of gold, however, does not. Investor Ray Dalio recently spooked attendees at the Institute for International Finance conference when he mentioned the possibility of a flight to gold because of his concerns about America’s fiscal position.

That is not a new point. Since at least 2016, financial titans including JPMorgan chief Jamie Dimon and hedge fund manager Stanley Druckenmiller have pointed out that unfunded pension and healthcare entitlements are a looming iceberg for the US economy. Indeed, one theory about the recent crisis in the “repo” overnight lending market is that it was caused by the federal deficit and the increasing unwillingness of investors outside the US to fund it.

But Mr Dalio went further, concluding that the American entitlement crisis meant the US Federal Reserve would have to continue to inflate its own balance sheet indefinitely, and keep rates low (or even negative) well into the future so the US could keep paying its bills.

That would depreciate the US dollar. Taken to its extreme, that never ends well. Prior experiments with rapidly falling currencies include late-third century Rome, Germany’s interwar Weimar Republic and Zimbabwe. At some point, Mr Dalio argued, nobody would want to own US debt or the dollar, and investors would look to other assets for safety. “The question is, what else?” he asked. “That’s the environment I think that we’ll be in. And there’s a saying that gold is the only asset you can have that’s not somebody else’s liability.”

I haven’t bought any gold yet myself, though I did sell out of equities entirely in August. That decision has been somewhat painful given the recent upsurge in the S&P 500, and yet it is one that I do not regret. There is logic in believing — as I do — that US blue-chips and bonds are no longer a safe haven while also believing that prices could stay high for some time to come. After all, holding two seemingly contradictory thoughts in your head at once is the sign of a mature mind. I believe US stock prices are staying up for precisely the same reason that investors might need to be in gold someday.

Analyst Luke Gromen laid out the mathematical logic of this very well in a recent newsletter. He calculates that US annual entitlement payments, which he defines as Medicare, Medicaid and Social Security, plus defence spending plus interest on the federal debt adds up to 112 per cent of US federal tax receipts.

That total has risen from 103 per cent only 15 months ago and 95 per cent two years ago, as government revenue fell due to President Donald Trump’s tax cuts. The proceeds of those cuts helped to further inflate equity prices. The US has become “utterly dependent on asset price inflation for tax receipts”, Mr Gromen writes, adding that the only way the US will be able pay its yearly bills is for asset prices to climb on their own, or for the Fed to “print enough money to make asset prices rise”.

I expect the Fed will, like every central bank before it, do what is politically required. Neither the US nor the world can afford for America to nominally default on its Treasury bills. So, stock prices will rise — for now. The essence of economic policy is, as Joseph Schumpeter reportedly put it, “politics, politics, politics”.

Share price inflation has been under way since the Fed switched gears and began lowering rates in July. It will probably be helped along by the easing of financial regulations enacted after the 2008 crisis, and possibly even a new round of tax cuts before the 2020 elections. Mr Trump measures his own success by that of the market.

But in the longer run, this financially engineered growth must erode confidence in the dollar, particularly at a time when the US and China are going in different directions. China is now the world’s largest natural gas buyer, and is looking to start setting prices for this and other commodities in its own currency. China is also doing more business in euros, as it tries to woo Europe into its own economic orbit. China recently issued its first euro-denominated bonds in 15 years. It is also moving away from buying oil in dollars and strengthening ties with EU companies such as Airbus.

The de-dollarisation of Eurasia would support Mr Dalio’s worldview. So would a shift to a non-dollar reserve asset such as gold. Such a change would force the US to sell dollars in order to settle its balance of payments in the new, neutral reserve asset.

One could argue that even if the US dollar were to weaken and creditors to lose faith in America’s ability to repay its debt, markets might still remain high for a period of time. But we are undergoing a period of deglobalisation. And history shows that when that happens, it eventually tends to trigger asset price collapses in whatever country is associated with the “old order”. No wonder gold bugs abound.
Source: [email protected]

Loncor $LN.ca – Technical Studies Indicate Possible Bottom and Support for Gold $ABX.ca $TECK.ca $RSG $NGT.to

Posted by AGORACOM at 1:54 PM on Wednesday, November 13th, 2019
This image has an empty alt attribute; its file name is Loncor-Small-Square.png

Sponsor: Loncor is a Canadian gold exploration company focused on two projects in the DRC – the Ngayu and North Kivu projects. Both projects have historic gold production. Exploration at the Ngayu project is currently being undertaken by Loncor’s joint venture partner Barrick Gold. The Ngayu project is 200km southwest of the Kibali gold mine, operated by Barrick, and produced 800,000 ounces of gold in 2018. Barrick manages and funds exploration at the Ngayu project until the completion of a pre-feasibility study on any gold discovery meeting the investment criteria of Barrick. Click Here for More Info

While it is an accepted fact that fundamental events shape the financial markets, many analysts use technical indicators as a way to mathematically quantify market sentiment. One of the simplest and most widely used technical indicators used to determine a current trend for a stock or commodity are moving averages. 

The use of a simple 200-day moving average is used to determine on a long-term basis whether a financial market is currently in a bullish or bearish trend. The use of a 50-day moving average is commonly accepted as determining the short-term trend. In both cases if current pricing is above the moving average than the trend is bullish.

Another widely accepted technical study is based upon the mathematician Leonardo Fibonacci’s golden ratio is Fibonacci retracement theory.

According to Investopedia, “A Fibonacci retracement is a term used in technical analysis that refers to areas of support or resistance. Fibonacci retracement levels use horizontal lines to indicate where possible support and resistance levels are. Each level is associated with a percentage. The percentage is how much of a prior move the price has retraced. The Fibonacci retracement levels are 23.6%, 38.2%, 61.8% and 78.6%. While not officially a Fibonacci ratio, 50% is also used.”

In this article we will use two Fibonacci retracement studies. The first study will be a long-term study; however, this study will utilize much less data then chart number two. The study will begin at the end of 2015 when gold hit a bottom of $1045 per ounce, and concludes at this year’s current high of $1565 per ounce. The second study will be derived from another long-term Fibonacci retracement study which begins in 2008, and concludes in the middle of 2011 when gold reached its record high price against the U.S. dollar.

Of particular interest in the first study are the Fibonacci retracement areas found at the .23%, and .382% retracement levels. Currently gold futures are trading at $1457.40, which is a net decline of $5.50 on the day. This continues the current bearish trend which has been predominant since gold hit its highest value this year in August. When you look at the .38% retracement level on this chart you can see that it precisely defines a level of resistance at approximately $1370.

This was the defined and unbreakable resistance level which began in 2016, the first occurrence of hitting this price point and then trading lower. This resistance was unbreakable throughout 2017 and 2018. In fact, it was not until June of this year that gold was able to breach that price point and trade to its highest value since bottoming out at the end of 2015.

The other level of particular interest is the .23% Fibonacci retracement level which occurs at $1446 per ounce. Currently gold pricing is approximately $11 above that price point. While this study alone will not confirm a potential bottom or support at $1446, it can when combined with other technical indicators, be highly effective in providing price targets for support and resistance.

The second study uses an extremely large data set from 2008 to the middle of 2011 defining the rally which took gold to its all-time record high. Of particular interest is the .38% Fibonacci retracement level which occurs at $1451 per ounce. This defines the lowest price point gold has traded to this month. It also occurs within dollars of the .23% Fibonacci retracement level we looked at on chart 1. When you have two different time sequences which have key Fibonacci retracement levels occur at the same price point, we label this a Fibonacci harmonic.

While one should never use these technical indicators alone, they are excellent tools to define price points to look at when a market is in a corrective stage, which is the current scenario in gold pricing

https://www.kitco.com/commentaries/2019-11-11/Technical-Studies-Indicate-Possible-Bottom-and-Support-for-Gold.html

Loncor $LN.ca – Loncor Announces Additional Drill Targets Identified by Barrick on Loncor’s Ngayu Joint Venture Project $ABX.ca $TECK.ca $RSG $NGT.to

Posted by AGORACOM at 9:20 AM on Thursday, November 7th, 2019

Loncor Resources Inc. (“Loncor” or the “Company”) (TSX: “LN”; OTCQB: “LONCF”), a Canadian gold exploration company with significant projects in the Democratic Republic of the Congo (“DRC”), is pleased to provide an update on exploration activities undertaken by Barrick Gold Corporation (NYSE: “GOLD”; TSX: “ABX”) (through its subsidiary, Barrick Gold (Congo) SARL) (“Barrick”) on Loncor’s Ngayu Joint Venture Project in northeastern DRC.  Recent exploration has focussed on the major Imva fold structure where a number of drill targets have been developed.  Drilling is now expected to commence during the coming dry season.  

The opening of the Mambati airstrip in September is expected to assist in expediting the forthcoming drilling program.  The Ngayu Archaean Greenstone Belt is 200 kilometres southwest of Barrick/AngloGoldAshanti’s Kibali Gold Mine.  Barrick’s exploration at Ngayu during the most recent quarter has focused on four priority areas all located along the 30 kilometre-long Imva fold structure (see Figure 1 below).  These blocks are Bavadili/Bavanidi, Bakpau, Lybie (Matete east)/Salisa and Bikira-Makasi.

At Bavadili, further trenching was undertaken to test the concept of a mineralized northwest trending shear corridor parallel to the interpreted F2 axial plane.  Results were encouraging and included 24 metres @ 0.94 g/t Au and confirmed the mineralized corridor with mineralization associated with brecciated cherty “BIF” (Banded Ironstone Formation) with disseminated limonite, weak hematite alteration along with sugary quartz veins and fine cubic boxworks (~ 5% pyrite).  The mineralization occurs along a strongly foliated northwest-southeast structure between dolerite to the south and basalt to the north.  Results support and confirm the model of a +1.5 kilometre potential mineralized structure from Bavadili Hill to Bavanidi.  At Bavadili Hill, additional trenching undertaken to test the continuity of the folded, mineralized cherty BIF, 250 metres southwest from the mineralized cherty BIF intersected in trench BVTR0114A, gave results of 24 metres @ 0.94 g/t Au.

Additional work involved a geological re-assessment of the Bavadili Block, integrating all data including gold and multi-element soil geochemical and geophysical data to improve the understanding of the regional model.  The new interpretation highlights more than 6 kilometres of multiple folded layers of anomalous BIF displaying two sets of regional F1 and F2 folds with the P1 axial plane, trending northeast, reactivated by P2, trending east-northeast, producing the S-shape fold configuration which is interpreted to host the mineralised shoots within the Bavadili Block.  The interpretation further suggests the same BIF continues 12 kilometres to the east of the Lybie/Salisa targets.

At Lybie, encouraging results from trench NZTR0006 confirmed a continuous mineralized corridor of +1 kilometre hosted within volcanoclastic and brecciated cherty BIF within an interpreted fold limb.  The trench revealed at least two continuous mineralized structures – the northwestern most of the two structures is from colonial trenching which returned 20 metres @ 0.58g/t Au, whereas trench NZTR0006 returned 20 metres @ 0.54g/t Au.  

At Salisa, results from rock sampling assayed up to 3.75 g/t Au in volcaniclastic and 3.05 g/t Au hosted in BIF and coincide with the soil source line trending northeast-southwest.  To better trace the mineralized system and constrain the potential and the source of the higher grade rock samples, a scout trenching program is underway.

At Bakpau, trenching has been completed on northwest-southeast and north-south trending sections on widely spaced trench lines.  The two trenches, BKTR0005 and BKTR0006, respectively, at 500 metres northeast and southwest of trench BKTR0001 (70 metres @ 0.34g/t Au), returned 26 metres @ 0.35 g/t Au and 30 metres @ 0.12 g/t Au, respectively.  These trenches have exposed and confirmed the continuity of anomalous grade, near surface mineralization in the Bakpau East Zone over a strike length of 1.2 kilometres.

At Medere, trenching on the +800 metre long 80ppb soil anomaly along the northeast trending hill, focused on establishing the controls on mineralization (structure and alteration) and trends of mineralization along strike between the zones exposed in previous trenches and artisanal pits.  Significant gold results from the first trench across quartz stockwork style mineralization were received during the most recent quarter with a trench intersection of 48 metres @ 0.51g/t Au and is still open to the southeast.  The current trenching has only been able to expose the margin of the soil anomaly due to thick scree/talus cover on the hill slopes towards the southeast.

In addition to outlining drill targets along the Imva fold, drilling is also planned to be undertaken during the forthcoming drill campaign at the Anguluku prospect area (including Golgotha, Baberu and Bayinga) in the southwest side of the Ngayu greenstone where a sequence of fine grained metasediment, carbonaceous shale, metabasalt and BIF trend approximately east-west and dip moderately to south-southwest within an antiformal structure.  An initial 10 core hole (2,490 metres) drilling program is proposed to test 4,500 metres of potential strike.

A photo accompanying this announcement is available at https://www.globenewswire.com/NewsRoom/AttachmentNg/0534ef90-fef8-4230-b2b1-3ceb21b3f74c

About Loncor Resources Inc.
Loncor is a Canadian gold exploration company focused on two projects in the DRC – the Ngayu and North Kivu projects.  Both projects have historic gold production.  Exploration at the Ngayu project is currently being undertaken by Loncor’s joint venture partner Barrick Gold Corporation through its DRC subsidiary Barrick Gold (Congo) SARL (“Barrick”).  The Ngayu project is 200 kilometres southwest of the Kibali gold mine, which is operated by Barrick and in 2018 produced approximately 800,000 ounces of gold.  As per the joint venture agreement signed in January 2016, Barrick manages and funds exploration at the Ngayu project until the completion of a pre-feasibility study on any gold discovery meeting the investment criteria of Barrick.  Subject to the DRC’s free carried interest requirements, Barrick would earn 65% of any discovery with Loncor holding the balance of 35%.  Loncor will be required, from that point forward, to fund its pro-rata share in respect of the discovery in order to maintain its 35% interest or be diluted. 

Certain parcels of land within the Ngayu project surrounding and including the Makapela and Yindi prospects have been retained by Loncor and do not form part of the joint venture with Barrick.  Barrick has certain pre-emptive rights over these two areas.  Loncor’s Makapela prospect has an Indicated Mineral Resource of 614,200 ounces of gold (2.20 million tonnes grading 8.66 g/t Au) and an Inferred Mineral Resource of 549,600 ounces of gold (3.22 million tonnes grading 5.30 g/t Au).  Loncor also recently acquired a 71.25% interest in the KGL-Somituri gold project in the Ngayu gold belt which has an Inferred Mineral Resource of 1.675 million ounces of gold (20.78 million tonnes grading 2.5 g/t Au), with 71.25% of this resource being attributable to Loncor via its 71.25% interest. 

Resolute Mining Limited (ASX/LSE: “RSG”) owns 27% of the outstanding shares of Loncor and holds a pre-emptive right to maintain its pro rata equity ownership interest in Loncor following the completion by Loncor of any proposed equity offering.  Newmont Goldcorp Corporation (NYSE: “NEM”; TSX: “NGT”) owns 7.8% of Loncor’s outstanding shares.

Additional information with respect to Loncor and its projects can be found on Loncor’s website at www.loncor.com. 

Loncor $LN.ca – Hard Asset Digest October 2019 Gold Market Update $ABX.ca $TECK.ca $RSG $NGT.to

Posted by AGORACOM at 2:34 PM on Friday, November 1st, 2019

Sponsor: Loncor is a Canadian gold exploration company focused on two projects in the DRC – the Ngayu and North Kivu projects. Both projects have historic gold production. Exploration at the Ngayu project is currently being undertaken by Loncor’s joint venture partner Barrick Gold (Congo) SARL (“Barrick”). The Ngayu project is 200 kilometres southwest of the Kibali gold mine, which is operated by Barrick and in 2018 produced approximately 800,000 ounces of gold. As per the joint venture agreement signed in January 2016, Barrick manages and funds exploration at the Ngayu project until the completion of a pre-feasibility study on any gold discovery meeting the investment criteria of Barrick. Subject to the DRC’s free carried interest requirements, Barrick would earn 65% of any discovery with Loncor holding the balance of 35%. Loncor will be required, from that point forward, to fund its pro-rata share in respect of the discovery in order to maintain its 35% interest or be diluted. Click Here for More Info

The first thing is gold 

It’s true that gold has made a significant upward move from $1,300 per ounce in May to currently around $1,500 per ounce with at least some of that move being attributable to bullish market fundamentals. Yet, we can also count on a lot more whipsaw action as gold continues to be ping-ponged about from geopolitical headline to geopolitical headline. 

The devaluation of fiat currencies in the face of rising and unsustainable debt loads across all developed economies will be the true driver of the long-term bull market that’s beginning to take form now.

 US government spending is so wildly out of control, and has been for more than a decade, that the federal debt will become unmanageable in the very near future. 

 Not that long ago, economists didn’t really have to think in terms of “Trillions of Dollars.” Yet today, we’ve grown accustomed to the fact… however dire it may be…that our federal debt is ballooning at a rate of nearly $1.5 Trillion each and every year. It’s simply not sustainable. 

At this rate, it will only be a few years until America can no longer afford to service its federal debt — no matter where interest rates go. 

Add to that the fact that we’re seeing this exact pattern of excessive money printing combined with unsustainable debt accumulation emerge across all developed economies. 

The end result can be only one thing: A devaluation of all fiat currencies. 

This doomed race to the bottom will leave gold, along with silver, standing alone as the only real store of value.

The EU is nearing recession

The Eurozone continues to experiment with negative interest rates in an attempt to spur economic growth by encouraging bank lending and also by boosting exports. Yet, the bottom line is that banks simply cannot make money in a negative deposit rate environment. 

 As much as banks may continue to try and sway lenders to do something more useful with their money than simply parking it with the European Central Bank, it’s doubtful such an ill-devised monetary policy can stave off recession. 

Thus far, growth has remained anemic, raising the specter of a recession hitting the Eurozone sometime next year.  

US/China Trade War: A trickle down effect across Europe’s largest economies

Germany, Europe’s largest economy, is suffering its worst manufacturing downturn in almost seven years as the US/China trade war spills over into european economies. 

 It’ll be interesting to see if Germany resorts to injecting fiscal stimulus (aka, the printing of even more money!) to boost its sagging export-reliant economy. Growth forecasts for 2020 have already fallen below the key 1% threshold.

Britain, Europe’s second largest economy, remains mired in its self-induced Brexit maelstrom, which certainly isn’t helping things from an economic standpoint. 

In what looks to be a warning sign of impending stagnation, the British economy took its first step backward (in Q2) in more than 7 years. Amid all the turmoil, it seems increasingly doubtful Britain will be exiting the EU on October 31st, with or without a deal, as the Brexit cloud continues to darken.

New reports are also revealing weakness in Europe’s third largest economy, France. In fact, the export sectors of both France and Germany – which includes their high-profile automobile industries – are being hit hard by flagging demand from China.

 The luster is coming off the Chinese economy

While growth in China held steady at 6.4% in Q1 this year, it proceeded to slip to 6.2% in Q2. Economic numbers over the last few months reveal that the worst may not yet be over for China with analysts projecting weakening third quarter data. 

 A recent survey by China Beige Book reveals slowing growth and soaring debt levels for the world’s second largest economy.

 Here at home, the trade war continues to stoke recession fears

US gross domestic product grew at a 2% annual pace from April to June, which was in-line with expectations. Yet, how long can that last?