Agoracom Blog Home

Posts Tagged ‘#43-101’

Great Atlantic Resources $GR.ca – Central Banks See Ravenous Demand For Gold In Q2 To Protect Against Looming Risks $OM.ca $GGX.ca $GWM.ca $CNX.ca $SIC.ca $MOZ.ca $AGB.ca

Posted by AGORACOM at 9:40 AM on Thursday, August 1st, 2019

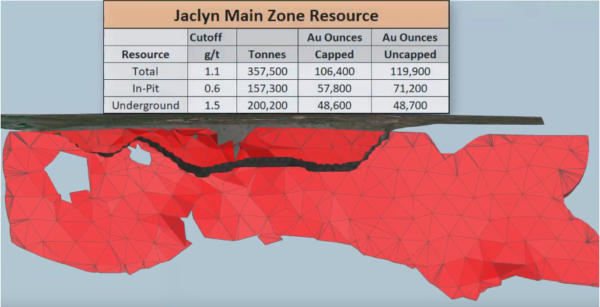
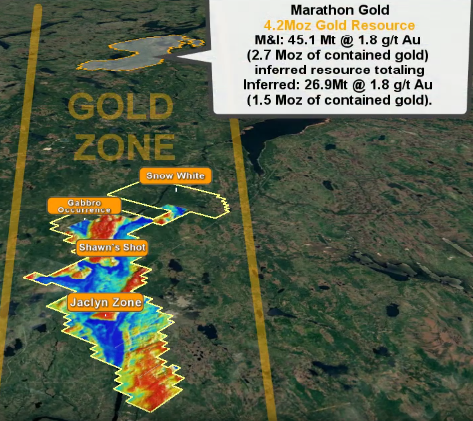
SPONSOR: Great Atlantic Resources Corp (TSX-V: GR) Great Atlantic Resources. A Canadian exploration company focused on the discovery and development of mineral assets in the resource-rich and sovereign risk-free realm of Atlantic Canada, one of the number one mining regions of the world. Great Atlantic is currently surging forward building the company utilizing a Project Generation model, with a special focus on the most critical elements on the planet that are prominent in Atlantic Canada, Antimony, Tungsten and Gold. Click Here for More Info

  • Central banks’ insatiable appetite for gold dominated the marketplace between April and June, according to the latest data from the World Gold Council
  • Global gold demand totaled 1,123 tonnes in the second quarter, up 8% from the second quarter of 2018.
  • For the first half of the year, physical gold demand rose of 2,181.7 tonnes, its highest level in three years.

(Kitco News) – Central banks’ insatiable appetite for gold dominated the marketplace between April and June, according to the latest data from the World Gold Council (WGC).

In its second-quarter Gold Demand Trends report, the council said that central banks bought a total of 224 tonnes of gold between April and June. Official gold reserves increased by 374.1 tonnes in the first half of the year — “the largest net H1 increase in global gold reserves in our 19-year quarterly data series,” the analysts said in the report.

“Buying was again spread across a diverse range of – largely emerging market – countries,” the WGC said.

The WGC said that nine central banks bought gold in the first half of the year.

“Central banks, like other investors, sought safety in gold as they looked to protect themselves in the face of many looming risks,” the analysts said.

The report said that global gold demand totaled 1,123 tonnes in the second quarter, up 8% from the second quarter of 2018. For the first half of the year, physical gold demand rose of 2,181.7 tonnes, its highest level in three years.

The report highlighted renewed strength in key sectors of the gold market. In particular, gold jewelry demand in India increased by 12% to 168.8 tonnes, compared to the second quarter of 2018. This was the best year-over-year quarterly increase since the second quarter of 2017.

“Indian demand was boosted early in the quarter by the wedding season and festival buying, before slowing sharply as the gold price rallied in June,” the report said.

The WGC noted that India’s gold demand faces strong headwinds as purchases have come to a “virtual standstill.”

“The slowing economic environment and restrictions on the movement of cash during the elections were a drag on demand in April and May,” the report said.

The India gold market was also hit with higher tariffs in early July with import duties rising to 12.5% from 10%.

“Although we do not expect this to have a long-term impact on gold demand in India, we do see it having a dampening impact on Q3, particularly as gold prices have remained elevated,” the WGC said.

While India saw strong growth in the second quarter, the world’s largest gold consuming nation saw its third consecutive quarterly drop. The WGC said that Chinese jewelry demand dropped by 4% in Q2 to 137.8 tonnes.

“Demand ground to a halt once the June price rally began and retailer’s promotional efforts could not tempt consumers back. Reportedly, showrooms were deserted as the quarter came to a close,” the analysts said.

ETF Investment Demand Remains Robust

The second quarter started on a sour note for gold investors but ended with a bang, according to the report. Renewed interest in gold-backed exchange-traded products led the investment surge, increasing by 67.2 tonnes in the second quarter an increase of 99% from the second quarter of 2018.

The gains were predominantly seen in June as the month saw inflows of 126.7 tonnes, reversing April’s outflows of 57.2 tonnes. The WGC said that total hold holding reached a six-year high of 2,548 tonnes in the first half of the year.

“Geopolitical uncertainty, dovish monetary policy commentary by central banks, and a rising gold price were among the key factors that drove investors to increase their holdings,” the analysts said.

The WGC highlighted the growing trend of European and U.K. investors leading the way in the gold market. It noted that U.K.-listed funds accounted for 75% of all global inflows during the second quarter.

“Investors sought the safe haven of gold amid the uncertainty surrounding Brexit and the leadership battle that followed Theresa May’s resignation as Prime Minister,” the analysts said. “The sharp drop in the value of the pound also fueled inflows during the quarter as the U.K.’s growth prospects were cut following repeated failures in Brexit negotiations.”

The WGC added that historic negative bond yields in German bonds also added to gold’s investment appeal.

Lackluster Coin and Bar Demand

Although investors have been jumping into gold-backed ETFs, interest in physical gold was fairly muted. The WGC said that gold coin and bar demand dropped 12% in Q2 to 476.9 tonnes, the lowest level since 2009. They noted that June’s sharp price rally has weighed on physical demand.

“This market has been struggling for some time, with many traditional gold investors focused on America’s healthy economic growth, low unemployment, and continued wage growth,” the WGC said. “The gold price rally in June triggered selling by some investors, and coin premiums in the secondary market fell to their lowest level since before the global financial crisis, spurring gold exports from the US to Germany.”

Tech Sector Sees Lower Gold Demand

Although not a significant factor for the physical gold market, analysts said that the tech sector saw gold demand drop by 3% in the second quarter to 81.1 tonnes.

“This was the third consecutive quarter of falling demand, due to a range of challenges in the electronics sector, including the ongoing trade dispute between China and the US. However, there are signs of recovery and we expect declines to continue to slow throughout H2 2019,” the WGC said.

Gold Supply Rises Due To Record Production

The council noted that robust gold demand is being met with strong production; the analysts said that gold supply increased by 6% in the second quarter to 1,186.7 tonnes. The supply was led by record gold production between April and June.

The WGC added that gold production increased by 2% to 882.6 tonnes in the second quarter. “This is a record level of global output for a second quarter and follows on from a Q1 record of 847.5t.

Global gold production was let by Canada, Russia and the U.S. that saw their domestic production increase by 9% in the third quarter. Australia, which has reported record gold production in 2018 saw an increase of 6% in the second quarter.

The WGC also noted an increase in recycled gold as consumers sold into higher prices late in the quarter.

SOURCE: By Neils Christensen

Great Atlantic Resources $GR.ca – Gold Heats Up And Silver Joins The Race $OM.ca $GGX.ca $GWM.ca $CNX.ca $SIC.ca $MOZ.ca $AGB.ca

Posted by AGORACOM at 11:06 AM on Tuesday, July 23rd, 2019

SPONSOR: Great Atlantic Resources. A Canadian exploration company focused on the discovery and development of mineral assets in the resource-rich and sovereign risk-free realm of Atlantic Canada, one of the number one mining regions of the world. Great Atlantic is currently surging forward building the company utilizing a Project Generation model, with a special focus on the most critical elements on the planet that are prominent in Atlantic Canada, Antimony, Tungsten and Gold. Click Here for More Info

https://s3.amazonaws.com/s3.agoracom.com/public/companies/logos/564603/hub/GREATATLANTIC_LOGO_TESTER-e1480712241913.jpg
GR: TSX-V
  • Next level for gold is $1500
  • Ray Dalio, Billionaire hedge fund manager pro gold
  • Potential interest rate cuts gold positive

Now that gold has broken through the $1,450 an ounce level, a six-high year high, the next big test is $1,500. And as I’ve said before, it can do this in the blink of an eye under the right conditions.

We may end up seeing those conditions emerge sooner rather than later.

Last Thursday, Federal Reserve Bank of New York President John Williams seemed to indicate that a rate cut could be expected later this month, saying that central bankers need to “act quickly” as economic growth cools. Although he later clarified his comment, claiming he was simply citing research and not forecasting central bank action, the price of gold jumped as much as 2 percent on the news before closing above $1,440 for the first time since May 2013.

Investors took some profits last Friday, knocking the price down around 1 percent after gold started to look overbought a day earlier. The metal was up two standard deviations over the past 60 trading days, its highest level since April 2016. I would consider each pullback such as this a buying opportunity, though, because I believe the best is yet to come for the metal.

Gold Price Up Two Standard Deviations

Gold Price Up Two Standard Deviations U.S. Global Investors

Ray Dalio seems to agree. In a lengthy post on LinkedIn—Dalio’s favorite platform for getting the word out—the billionaire hedge fund manager writes that he thinks we’re on the verge of a new economic paradigm shift and that central banks’ accommodative policies, from low rates to quantitative easing (QE), are unsustainable. To hedge against this, Dalio says, “I believe that it would be both risk-reducing and return-enhancing to consider adding gold to one’s portfolio.” Most investors are underweighted in gold, “meaning that if they just wanted to have a better balanced portfolio to reduce risk, they would have more of this sort of asset,” he writes.

A Monster Rally for Juniors

Select junior and micro-cap gold and precious metal miners also posted very strong growth over the past week, mostly on positive drilling results. In a press release dated July 15, Brixton Metals announced encouraging results at its wholly owned Thorn Gold-Copper-Silver Project in British Columbia. Gary Thompson, chairman and CEO of the Vancouver-based explorer and developer, said that Brixton “continues to unlock a mountain of value” at the property, which exhibits even greater mineralization than was previously thought.

Junior Miners Had a Strong Week

Junior Miners Had a Strong Week U.S. Global Investors

As for silver, I’m pleased to see that it’s finally playing “catch up” to gold, its price having hit a 52-week high after an incredible six straight days of gains.

Silver Is Trying to Narrow Its Gap With Gold

Silver Is Trying to Narrow Its Gap With Gold U.S. Global Investors

The Bullish Calls on Gold Continue

With gold having already broken out of its five-year trading range, is the best still yet to come?

I believe it is. And I’m not alone. Read what some analysts and strategists have to say:

Alpine Macro

“The Fed is getting ready to cut interest rates, which should set in motion a multi-year bear market in the dollar,” write analysts at Alpine Macro in a research note dated June 28. A weaker U.S. dollar is one of three “key ingredients” for a bull market, according to Alpine Macro, the other two being a more accommodative Fed and rising geopolitical risks.

“The technical break above $1,400 an ounce is a positive sign,” the firm adds. “New all-time highs for gold should be seen in the coming years.”

World Gold Council (WGC)

“The prospect of lower interest rates should support gold investment demand,” the World Gold Council (WGC) says in its mid-year outlook. “Our research indicates that the gold price was higher in the 12 months following the end of a tightening cycle. Moreover, historical gold returns are more than twice their long-term average during periods of negative real rates—like the one we are likely to see later this year.”

Canadian Imperial Bank of Commerce (CIBC)

“We continue to see no signs of rate hikes on the horizon over the next several years, and historically have seen gold continue on an upward trajectory beyond the last rate cut,” writes CIBC in a note dated July 14.

The bank points out that in two previous gold bull market cycles—in the 1970s and 2000s—negative real rates were the main contributing factor.

“During the last two major periods when real rates stayed below the 2 percent level and actually ticked into negative territory, the gold price moved over 320 percent in the 1970s… and approximately 400 percent from 2004 to peak in 2011.”

For full disclosures pertaining to this post click here.

Great Atlantic Resources $GR.ca Gold Weaker, Bigger Price Move Pending $SIC.ca $MOZ.ca $AGB.ca

Posted by AGORACOM at 9:21 AM on Wednesday, July 17th, 2019

SPONSOR: Great Atlantic Resources. A Canadian exploration company focused on the discovery and development of mineral assets in the resource-rich and sovereign risk-free realm of Atlantic Canada, one of the number one mining regions of the world. Great Atlantic is currently surging forward building the company utilizing a Project Generation model, with a special focus on the most critical elements on the planet that are prominent in Atlantic Canada, Antimony, Tungsten and Gold. Click Here for More Info

https://s3.amazonaws.com/s3.agoracom.com/public/companies/logos/564603/hub/GREATATLANTIC_LOGO_TESTER-e1480712241913.jpg
GR: TSX-V
  • A bigger price move is right on the horizon, probably this week
  • Odds favor that bigger price move being to the upside.

Gold prices are modestly down in early U.S. trading Tuesday. The daily chart for gold shows a “collapse in volatility,” whereby the past three sessions have seen significantly quieter price action. This suggests that a bigger price move is right on the horizon, probably yet this week. Given that the daily gold chart remains bullish, odds favor that bigger price move being to the upside. August gold futures were last down $2.90 an ounce at 1,410.20. September Comex silver prices were last up $0.045 at $15.41 an ounce.

The just-released U.S. retail sales report for June showed a stronger-than-expected rise of 0.4%, which pushed the U.S. dollar index to solid gains on the day and in turn put some downside pressure on the gold market. Asian and European stocks were mixed overnight. U.S. stock indexes are pointed toward narrowly mixed openings when the New York day session beings, and are at or near their record and contract highs. So far this week there have been no major news developments in the world to significantly move markets. Thus, typical lackluster mid-summertime trading has set in. However, a very busy day of U.S. economic data may shake loose the present summertime doldrums.

In overnight news, there was a downbeat economic report coming out of Germany, as the ZEW economic expectations index and current conditions index worsened in July. Germany is the economic workhorse for the European Union.

The other key “outside market” today sees Nymex crude oil prices firmer and trading just below $60.00 a barrel.

U.S. economic data due for release Tuesday includes the weekly Johnson Redbook and Goldman Sachs retail sales reports, retail sales, import and export prices, industrial production and capacity utilization, the NAHB housing market index, manufacturing and trade inventories, and Treasury international capital data. Several Federal Reserve officials are also slated for speeches today.

SOURCE: https://www.kitco.com/news/2019-07-16/Gold-Firmer-Bigger-Price-Move-Pending.html

CLIENT FEATURE: Great Atlantic’s $GR.ca Golden Promise located in Emerging Gold District $SIC.ca $MOZ.ca $AGB.ca

Posted by AGORACOM at 1:50 PM on Friday, June 14th, 2019
  • Golden Promise located in the Victoria Lake Supergroup, with over 130 VMS deposits and occurrences, including 30 significant deposits and prospects.
  • Golden Promise neighbors Marathon Golds 4.2m gold resource
  • Drilling has focused on small area called Jaclyn Main Zone where multiple quartz veins comprise the 100,000 ounce resource
  • Jaclyn Main quartz vein system is open ended with a strike dimension of 975m and open vertical depth extension of 400m

Great Atlantic Hub on Agoracom

FULL DISCLOSURE: Great Atlantic is an advertising client of AGORA Internet Relations Corp

CLIENT FEATURE: Great Atlantic’s $GR.ca Golden Promise located in Emerging Gold District $SIC.ca $MOZ.ca $AGB.ca

Posted by AGORACOM at 9:48 AM on Wednesday, May 29th, 2019
  • Golden Promise located in the Victoria Lake Supergroup, with over 130 VMS deposits and occurrences, including 30 significant deposits and prospects.
  • Golden Promise neighbors Marathon Golds 4.2m gold resource
  • Drilling has focused on small area called Jaclyn Main Zone where multiple quartz veins comprise the 100,000 ounce resource
  • Jaclyn Main quartz vein system is open ended with a strike dimension of 975m and open vertical depth extension of 400m

Great Atlantic Hub on Agoracom

FULL DISCLOSURE: Great Atlantic is an advertising client of AGORA Internet Relations Corp

CLIENT FEATURE: Great Atlantic’s $GR.ca Golden Promise located in Emerging Gold District $SIC.ca $MOZ.ca $AGB.ca

Posted by AGORACOM at 1:23 PM on Friday, May 10th, 2019
  • Golden Promise located in the Victoria Lake Supergroup, with over 130 VMS deposits and occurrences, including 30 significant deposits and prospects.
  • Golden Promise neighbors Marathon Golds 4.2m gold resource
  • Drilling has focused on small area called Jaclyn Main Zone where multiple quartz veins comprise the 100,000 ounce resource
  • Jaclyn Main quartz vein system is open ended with a strike dimension of 975m and open vertical depth extension of 400m

Great Atlantic Hub on Agoracom

FULL DISCLOSURE: Great Atlantic is an advertising client of AGORA Internet Relations Corp

American Creek $AMK.ca Reports That JV Partner Tudor Gold Has Retained P&E Mining Consultants for 2019 Treaty Creek Project Drilling and Future Initial Resource Estimate $SEA $SA $SKE.ca $TUD.ca $PVG $MRO.ca

Posted by AGORACOM at 9:37 AM on Wednesday, April 17th, 2019
https://s3.amazonaws.com/s3.agoracom.com/public/companies/logos/562696/hub/HubLogoLarge2_copy.jpg
  • JV partner Tudor Gold has retained P&E Mining Consultants Inc. for assistance in planning the upcoming 2019 drilling season.
  • Purpose is to create a National Instrument 43-101 for the Treaty Creek Property
  • Treaty Creek is located immediately adjacent to Seabridge Gold’s KSM and just north of Pretivm’s now producing Brucejack/Valley of the Kings high grade gold mine in northwestern British Columbia.

Cardston, Alberta–(Newsfile Corp. – April 17, 2019) – American Creek Resources Ltd. (TSXV: AMK) (“American Creek”) is pleased to announce that JV partner Tudor Gold has retained P&E Mining Consultants Inc. (“P&E”) of Brampton, Ontario for assistance in planning the upcoming 2019 drilling season, with a view to eventually compiling an initial Mineral Resource Estimate pursuant to National Instrument 43-101 for the Treaty Creek Property located immediately adjacent to Seabridge Gold’s KSM and just north of Pretivm’s now producing Brucejack/Valley of the Kings high grade gold mine in northwestern British Columbia.

P&E Mining Consultants Inc., established in 2004, provides geological and mine engineering consulting reports, Mineral Resource Estimate technical reports, Preliminary Economic Assessments and Pre-Feasibility Studies. P&E undertook the initial Mineral Resource Estimate for Pretium Resources Inc.’s Brucejack Property and the resulting Technical Report that supported the $100M IPO.

Ken Konkin, Tudor Gold’s Exploration Manager stated, “I have had the pleasure of working with Mr. Eugene Puritch, P. Eng, FEC and President of P&E Mining Consultants Inc. and his team of professional geologists and professional engineers on several projects in North and South America. P&E Mining Consultants specialize in geological modeling and mine design and their work is of the highest standards. I look forward to working again with Eugene and his geo-scientists and engineers in order to determine the optimum drill hole spacing required for the drill program. Our goal is to fast-track the exploration program at Treaty Creek during this summer adding value to Tudor’s Goldstorm target in the most efficient and economic methods possible. Once drilling begins, P&E Mining Consultants will conduct a site visit and complete a project review.”

Darren Blaney, CEO of American Creek stated: “We very much look forward to having Tudor and Mr. Konkin commence the much anticipated 2019 Treaty Creek drill program building on the last hole from 2018 that ran 563 meters of 0.98 g/t gold. Securing a top tier firm to oversee the drilling and maiden resource calculation is a very positive step in the advancement of the Treaty JV. The Golden Triangle region is heating up and attracting attention and this upcoming season is shaping up to be very significant.”

About American Creek

American Creek is a Canadian junior mineral exploration company with a strong portfolio of gold and silver properties in British Columbia. Three of those properties are located in the prolific “Golden Triangle”; the Treaty Creek and Electrum joint venture projects with Tudor Gold/Walter Storm as well as the 100% owned past producing Dunwell Mine.

The Corporation also holds the Gold Hill, Austruck-Bonanza, Ample Goldmax, Silver Side, and Glitter King properties located in other prospective areas of the province.

For further information please contact Kelvin Burton at: Phone: 403 752-4040 or Email: [email protected]. Information relating to the Corporation is available on its website at www.americancreek.com

$GR.ca Great Atlantic Resources Corp. Files 43-101 Report on Golden Promise Project, Newfoundland $SIC.ca $MOZ.ca $LAB.ca

Posted by AGORACOM at 2:35 PM on Thursday, December 6th, 2018

https://s3.amazonaws.com/s3.agoracom.com/public/companies/logos/564603/hub/GREATATLANTIC_LOGO_TESTER-e1480712241913.jpg

  • Completed 43-101 includes a mineral resource estimate (Inferred ) for the Jaclyn Main Zone, Golden Promise
  • Golden Promise hosts multiple gold bearing quartz veins and is located in a region of recent significant gold discoveries
  • significant gold discoveries in this region include those of Sokoman Iron Corp. (TSXV.SIC) at the Moosehead Project and Marathon Gold Corp. (TSXV.MOZ) at the Valentine Lake Gold Camp.


VANCOUVER, BC / ACCESSWIRE / December 6, 2018 / GREAT ATLANTIC RESOURCES CORP. (TSX-V: GR) (the “Company” or “Great Atlantic”) announces that it has received and filed on SEDAR a National Instrument 43-101 Technical Report, dated December 4, 2018 (revising a previous filed version dated November 28, 2018) (the “Report“) on the Company’s Golden Promise Gold Property, located in the central Newfoundland gold belt. The report was completed by Mr. Greg Z. Mosher, M.Sc. App., P.Geo., and Mr. Larry Pilgrim, B.Sc., P.Geo. The amendments in the December 4 version of the technical report principally relate to disclosure of QA/QC programs in Part 11 and data verification in Part 12. The material conclusions of both versions of the Report are the same.

The Report includes the following mineral resource estimate (Inferred resources) for the Jaclyn Main Zone, the maiden resource estimate for the Company on the property:

Resource Cutoff Au g/t Au Cap g/t Au Uncap g/t Tonnes Au Ounces Capped Au Ounces Uncapped
Total 1.1 9.3 10.4 357,500 106,400 119,900
Pit-Constrained 0.6 11.4 14.1 157,300 57,800 71,200
Underground 1.5 7.5 7.6 200,200 48,600 48,700

(To view the full-sized image, please click here)

The Golden Promise Property hosts multiple gold bearing quartz veins and is located in a region of recent significant gold discoveries. The property is located within the Exploits Subzone of the Newfoundland Dunnage Zone. Within the Exploits Subzone, the property lies along the north-northwestern fringe of the Victoria Lake Supergroup (VLSG), a volcano-sedimentary terrane. The northwestern margin of the Golden Promise Property occurs proximal to, and, in part, contiguous with a major (Appalachian-scale) collisional boundary, and suture zone, known as the Red Indian Line (RIL). The RIL forms the western boundary of the Exploits Subzone. Recent significant gold discoveries in this region of the Exploits Subzone include those of Sokoman Iron Corp. (TSXV.SIC) at the Moosehead Project and Marathon Gold Corp. (TSXV.MOZ) at the Valentine Lake Gold Camp.


(To view the full-sized image, please click here)


(To view the full-sized image, please click here)

High-grade gold is reported in quartz veins and quartz vein boulders within the Golden Promise Property. Gold bearing quartz veins are reported in multiple areas of the property, including at least 5 gold bearing quartz vein systems reported in one zone referred to as the Jaclyn Zone, located in the northern half of the property. Much of the reported historical exploration within the property has been focused on the Jaclyn Zone with gold bearing vein systems reported at the Jaclyn Main, Jaclyn East, Jaclyn West, Jaclyn North and Jaclyn South Sub-zones. The majority of historic drilling (2002-2010) was conducted at the Jaclyn Main Zone. Significant historical work is also reported in the southwest region of the property at the Linda / Snow White vein, including grab sample reported to return 105 and 232 g/t gold, a reported channel sample returning 29.7 g/t gold / 0.5 meters, and a diamond drillhole intersection of 19.5 g/t gold / 1.15 meter core length. Gold bearing veins and gold bearing float are reported in other regions of the property.

The Report includes a mineral resource estimate for the Jaclyn Main Zone, the only area within the Property for which sufficient data exists to support a mineral resource estimate. The resource estimate was completed by Mr. Greg Z. Mosher, M.Sc. App., P.Geo.


(To view the full-sized image, please click here)

The current mineral resource estimate for the Jaclyn Main Zone is based on assays from 107 drillholes (2002 – 2010). The drill core from most of these holes has been preserved at a Provincial Government storage facility in Buchans, NL. As part of the data verification process prior to the resource estimate, core from five (5) holes, representing a range of contained gold grades and locations within the zone, were examined and six (6) quarter-core samples were collected from three of these holes for verification of the original assay values. The six check samples were assayed for gold in 2018 at ALS Canada in North Vancouver. The following table shows the comparison of original and check assay values.

Drill Hole From (m) To (m) Length (m) Original Au g/t Check Au g/t Sample #
GP02-09 47.6 48.3 0.7 1.4 1.455 CNF10434
GP02-09 48.3 48.7 0.4 1.0 0.005 CNF10435
GP06-51 153.5 153.8 0.3 14.1 25.1 CNF13676
GP06-51 153.8 154.2 0.4 9.4 4.27 CNF13677
GP07-74 181.0 181.5 0.5 5.2 1.79 CNF19937
GP07-74 181.5 182.0 0.5 2.4 0.083 CNF19938

Discrepancies between the original and check assays are attributable to the fact that 1) original and check samples were collected from different portions of the core; 2) the gold is particulate in nature and therefore a high degree of variability exists between the half-core and quarter-core samples; and 3) the original samples were assayed using screened metallics to capture any coarse particles of gold whereas the check samples were of too small a volume to permit the use of screening and therefore some gold particles may not have been captured by the analytical process.

Original assay certificates for approximately 60% of the Jaclyn Main Zone assays were checked against assay values in the dataset used for the mineral resource estimate and no discrepancies were found. The results of QA/QC monitoring of drill core samples submitted for analysis during the period 2004 – 2008 and 2010 – 2011, were compiled and assessed. These measures include use of standards, blanks and duplicate samples, although not all measures were employed in all programs. Regardless, all QA/QC metrics fall within acceptable limits.

The zone was modelled as a single quartz vein that strikes east-west and dips steeply to the south. Modelled vein thickness was based on true thickness derived from quartz vein intercepts. The estimate is based on 220 assays that were composited to 135 one-meter long composites. A bulk density of 2.7 g/cm3 was used. Blocks in the model measured 15 meters east-west, 1-meter north-south and 10 meters vertically. The block model was not rotated. Grades were interpolated using inverse-distance squared (ID2) weighting and a search ellipse that measured 100 meters along strike, two meters across strike and 50 meters vertically. Grades were interpolated based on a minimum of two and a maximum of 10 composites with a maximum of one composite per hole so the grade of each block is based on at least two drillholes thereby demonstrating continuity of mineralization. For the capped mineral resource estimate, all assays that exceed 65 g/t gold were capped at 65 g/t gold. All resources were classified as Inferred because of the relatively wide spacing of drill holes through most of the zone.

Because part of the vein is near surface the resource estimate was constrained by a conceptual open pit to demonstrate reasonable prospects of eventual economic extraction. Generic mining costs of US$2.50/tonne and processing costs of US$25.00/tonne were used together with a gold price of US$1,300/ounce. A conceptual pit slope of 45° was assumed with no allowance for mining loss or dilution. Based on the combined hypothetical mining and processing costs and the assumed price of gold, a pit-constrained cutoff grade of 0.6 g/t was adopted. For the underground portion of the resource a cutoff of 1.5 g/t was assumed. The cutoff grade for the total resource is the weighted average of the pit-constrained and underground cutoff grades. The resource estimate for conceptual pit-constrained and underground at various gold cutoff grades and total resource estimate are tabulated as follows:

Jaclyn Main Zone Inferred Mineral Resource Estimate: Pit-Constrained

Cutoff Au g/t Au Cap g/t Au Uncap g/t Tonnes Au Ounces Capped Au Ounces Uncapped
10 21.9 28.5 63,300 44,600 57,900
5 16.4 20.5 101,100 53,300 66,700
4 15.2 18.9 112,300 54,900 68,300
3 14.1 17.5 124,000 56,300 69,600
2 13.7 17 128,400 56,700 70,000
1.5 13.2 16.3 134,100 57,000 70,300
1 11.8 14.6 151,500 57,700 71,000
0.8 11.5 14.2 155,700 57,800 71,100
0.6 11.4 14.1 157,300 57,800 71,200
0.4 11.4 14 157,800 57,800 71,200
0.2 11.4 14 158,200 57,800 71,200

Mineral Resources are not Mineral Reserves and do not have demonstrated economic viability.
There is no certainty that all or any part of the Mineral Resources estimated will be converted into Mineral Reserves.
Mineral resource tonnage and contained metal have been rounded to reflect the accuracy of the estimate, and numbers may not add due to rounding.
Mineral resource tonnage and grades are reported as undiluted.
Contained Au ounces are in-situ and do not include recovery losses.

Jaclyn Main Zone Inferred Mineral Resource Estimate: Underground

Cutoff Au g/t Au Cap g/t Au Uncap g/t Tonnes Au Ounces Capped Au Ounces Uncapped
10 15.7 15.7 51,100 25,700 25,800
5 11.1 11.2 111,300 39,800 39,900
4 10.1 10.2 130,800 42,600 42,700
3 9.1 9.1 155,400 45,300 45,500
2 8 8.1 184,500 47,700 47,800
1.5 7.5 7.6 200,200 48,600 48,700
1 7 7 218,500 49,300 49,500
0.8 6.7 6.7 230,400 49,700 49,800
0.6 6.5 6.5 239,300 49,900 50,000
0.4 6 6 262,100 50,200 50,400
0.2 5.2 5.2 305,100 50,600 50,800

Mineral Resources are not Mineral Reserves and do not have demonstrated economic viability.
There is no certainty that all or any part of the Mineral Resources estimated will be converted into Mineral Reserves.
Mineral resource tonnage and contained metal have been rounded to reflect the accuracy of the estimate, and numbers may not add due to rounding.
Mineral resource tonnage and grades are reported as undiluted.
Contained Au ounces are in-situ and do not include recovery losses.

Jaclyn Main Zone Total Inferred Mineral Resource Estimate

Resource Cutoff Au g/t Au Cap g/t Au Uncap g/t Tonnes Au Ounces Capped Au Ounces Uncapped
Total 1.1 9.3 10.4 357,500 106,400 119,900
Pit-Constrained 0.6 11.4 14.1 157,300 57,800 71,200
Underground 1.5 7.5 7.6 200,200 48,600 48,700

Jaclyn Main Zone Block Model


(To view the full-sized image, please click here)

As discussed previously in this News Release, significant recent gold discoveries in the central Newfoundland gold belt within the Exploits Subzone include that of Sokoman Iron Corp. and Marathon Gold Corp. Sokoman Iron Corp. (TSXV.SIC) recently announced a high grade gold discovery on its Moosehead Property, located approximately 40 kilometers east-northeast of the Golden Promise Property. The discovery was made during the 2018 diamond drilling program. A drill intersection of 44.96 g/t gold over 11.90 meter core length was reported including a 1.35 meter core length quartz vein intersection of 385.85 g/t gold (Sokoman Iron Corp. News Release of July 24, 2018). The Valentine Lake Gold Camp of Marathon Gold Corp. (TSXV.MOZ) is located approximately 55 kilometers southwest of the Golden Promise Property. As reported on Marathon’s website, the Valentine Lake Gold Camp currently hosts four near-surface, mainly pit-shell constrained, deposits with measured and indicated resources totaling 2,691,400 oz. of gold at 1.85 g/t gold and inferred resources totalling 1,531,600 oz. of gold at 1.77 g/t. Readers are warned that mineralization at the Moosehead Property and Valentine Lake Gold Camp is not necessarily indicative of mineralization on the Golden Promise Property.

The Report may be subject to review by the British Columbia Securities Commission.

David Martin, P.Geo., a Qualified Person as defined by NI 43-101 and VP Exploration for Great Atlantic, is responsible for the technical information contained in this News Release.

On Behalf of the board of directors

“Christopher R Anderson

Mr. Christopher R Anderson ” Always be positive, strive for solutions, and never give up ”
President CEO Director
604-488-3900
[email protected]

About Great Atlantic Resources Corp.: Great Atlantic Resources Corp. is a Canadian exploration company focused on the discovery and development of mineral assets in the resource-rich and sovereign risk-free realm of Atlantic Canada, one of the number one mining regions of the world. Great Atlantic is currently surging forward building the company utilizing a Project Generation model, with a special focus on the most critical elements on the planet that are prominent in Atlantic Canada, Antimony, Tungsten and Gold.

$GR.ca Great Atlantic Commissions National Instrument 43-101 Technical Report on Golden Promise Gold Property – Central Newfoundland Gold Belt $ANX.ca $MOZ.ca $LAB.ca

Posted by AGORACOM at 8:58 AM on Tuesday, October 30th, 2018

https://s3.amazonaws.com/s3.agoracom.com/public/companies/logos/564603/hub/GREATATLANTIC_LOGO_TESTER-e1480712241913.jpg

  • Summaries of historic work and work by Great Atlantic within the property.
  • 43-101 – compliant mineral resource estimates for the Jaclyn Main Zone which will also include data from 2010 work (27 diamond drill holes) which was completed after the previous 2008 historic mineral resource estimates.


VANCOUVER, BRITISH COLUMBIA / ACCESSWIRE / October 30, 2018 / GREAT ATLANTIC RESOURCES CORP. (TSXV.GR) (the “Company” or “Great Atlantic”) is pleased to announce it has commissioned Mr. Greg Z. Mosher, M.Sc. App., P.Geo., and Larry Pilgrim, B.Sc., P.Geo. to complete a National Instrument 43-101 Technical Report on the Company’s Golden Promise Gold Property, located in the central Newfoundland gold belt. The report will include the following:

  • Summaries of historic work and work by Great Atlantic within the property.
  • 43-101 – compliant mineral resource estimates for the Jaclyn Main Zone which will also include data from 2010 work (27 diamond drill holes) which was completed after the previous 2008 historic mineral resource estimates.
  • Make recommendations for future work.

The Property hosts multiple gold bearing quartz veins and is located in a region of recent significant gold discoveries. The Golden Promise Property is located approximately 40 kilometers west-southwest of the Moosehead Project of Sokoman Iron Corp. (TSXV.SIC) and approximately 55 kilometers northeast of the Valentine Lake Gold Camp of Marathon Gold Corp. (TSXV.MOZ) High grade gold is reported in quartz veins and quartz vein boulders within the Golden Promise Property.

Gold bearing quartz veins are reported in multiple areas of the Golden Promise Property, including at least 5 gold bearing quartz vein systems reported in one zone referred to as the Jaclyn Zone, located in the northern half of the Property. Much of the reported historical exploration at the Property has been focused on the Jaclyn Zone with gold bearing vein systems reported at the Jaclyn Main, Jaclyn East, Jaclyn West, Jaclyn North and Jaclyn South Sub-zones.

Gold Bearing Jaclyn West (Christopher) Vein

Most historic work was conducted at the Jaclyn Main Zone. Reported diamond drilling gold (Au) intercepts (core length and estimated true thickness in meters) at the Jaclyn Main Zone include:

  • GP02-01: 16.57 g/t Au over 2.55m core length (1.64 m estimated true thickness)
  • GP02-09: 7.05 g/t Au over 4.90 m core length (2.22 m estimated true thickness)
  • GP06-52: 93.71 g/t Au over 1.40 m core length (1.25 m estimated true thickness)
  • GP07-91: 141.21 g/t Au over 0.45 m core length (0.33 m estimated true thickness)
  • GP07-92: 10.41 g/t Au over 4.70 m core length (1.60 m estimated true thickness)

Gold recovery from a reported 2,241 tonne bulk sample collected in 2010 at the Jaclyn Main Zone was reported to average 4.47 g/t gold. The average tails grade for the sample was reported to be 1.12 g/t gold. A “back-calculated head grade of 5.59 g/t gold” was reported for the bulk sample.

Quartz float samples collected by the Company during 2017 in one target area (referred to as the Branden Zone) in the northern region of the Property returned 57.2 and 200 grams / tonne (g/t) gold (News Release of August 28, 2017). A 0.32 meter long chip sample collected across the Shawn’s Shot Vein by the Company in 2017 returned 48.2 g/t gold (news Release of August 28, 2017).

Significant recent gold discoveries in the central Newfoundland gold belt include that of Sokaman Iron Corp. and Marathon Gold Corp. Sokoman Iron Corp. recently announced a high grade gold discovery on its Moosehead Property, located approximately 40 kilometers east-northeast of the Golden Promise Property. The discovery was made during the 2018 diamond drilling program. A drill intersection of 44.96 g/t gold over 11.90 meter core length was reported including a 1.35 meter core length quartz vein intersection of 385.85 g/t gold (Sokoman Iron Corp. News Release of July 24, 2018). The Valentine Lake Gold Camp of Marathon Gold Corp. is located approximately 55 kilometers southwest of the Golden Promise Property. As reported on Marathon’s website, the Valentine Lake Gold Camp currently hosts four near-surface, mainly pit-shell constrained, deposits with measured and indicated resources totalling 2,137,100 oz. of gold at 1.99 g/t and inferred resources totalling 1,104,800 oz. of gold at 1.99 g/t.

Readers are warned that mineralization at the Moosehead Property and Valentine Lake Gold Camp is not necessarily indicative of mineralization on the Golden Promise Property.

Readers are warned that historical records for the Golden Promise Property referred to in this News Release have been examined but not verified by a Qualified Person. Further work is required to verify that historical records referred to in this News Release are accurate.

David Martin, P.Geo., a Qualified Person as defined by NI 43-101 and VP Exploration for Great Atlantic, is responsible for the technical information contained in this News Release.

On Behalf of the board of directors

“Christopher R Anderson

Mr. Christopher R Anderson ” Always be positive, strive for solutions, and never give up ”
President CEO Director
604-488-3900
[email protected]