Posted by AGORACOM
at 10:10 AM on Thursday, October 10th, 2019
Previous drilling found a network of veins with widespread gold and silver mineralization.
The first phase geophysical survey revealed a large chargeability anomaly right below these veins.
The anomaly is quite large, allowing AAX to expand the grid to the south with fewer lines so we expect to complete this survey within 2 weeks and then begin drilling
12 miles to the west is the San Nicolas VMS mine owned by Teck Corporation and 12 miles to the south is the El Coronel open pit gold mine located in the same geological environment as the Tabasquena project.
Kamloops, British Columbia–(Newsfile Corp. – October 10, 2019) – Advance Gold Corp. (TSXV: AAX) (“Advance Gold” or “the Company”) is
pleased to announce that the second phase of geophysics is underway on
the Company’s Tabasquena project in Zacatecas, Mexico. The goal of this
second 3D induced polarization (IP) survey is to expand the grid
completed in the first phase to the south where the anomaly comes
closest to surface.
The
first phase survey identified a large continuous chargeability anomaly
just below an area of widespread gold and silver mineralization in
epithermal veins. The anomaly is approximately 250 metres wide and 800
metres long from north to south. The second phase IP survey will extend
the grid approximately 1000 metres to the south where due to the
elevation change the anomaly is closest to surface. The chargeability
anomaly remains open to the north, south and at depth.
An
IP survey is a geophysical imaging technique used to identify the
electrical chargeability of subsurface materials such as ore. The
technique involves the measurement of the slow decay of voltage in the
ground following the cessation of an excitation current. The method
makes use of the capacitive action of the subsurface to locate zones
where chargeable minerals are present. Disseminated sulphides and other
chargeable minerals have distinct IP signatures.
It is important to note that approximately 12 miles to the west is the San Nicolas VMS mine owned by Teck Corporation and 12 miles to the south is the El Coronel open pit gold mine located in the same geological environment as the Tabasquena project.
Allan Barry Laboucan, President and CEO of Advance Gold Corp. commented: “It’s
a very exciting time for Advance Gold, previous drilling found a
network of veins with widespread gold and silver mineralization.
Following this the first phase geophysical survey revealed a large
chargeability anomaly right below these veins. Another impressive aspect
of the first IP survey is that as we move to the south there is a
decrease in the depth to the IP anomaly that would indicate that the
anomaly is getting nearer to the surface as we move to the south. A
possible reason for this is that the elevation decreases as we go
southward, so it is important for us to extend the IP grid to the south
before we drill test the IP anomaly. In our recent news release
announcing the addition of our geophysical advisor, he described the
anomaly as ‘quite remarkable in its size and continuity.’ As the anomaly
is quite large, we are able to expand the grid to the south with fewer
lines so we expect to complete this survey within 2 weeks and then begin
drilling. We are in a region with very large mines, including El
Coronel which is an open pit mine in production since 2008 which is 12
miles to the south of Tabasquena. Our team looks forward to further
advancing the Tabasquena project with the second phase of geophysics and
upcoming drilling.”
Julio
Pinto Linares is a QP, Doctor in Geological Sciences with specialty in
Economic Geology and Qualified Professional No. 01365 by MMSA., and QP
for Advance Gold and is the qualified person as defined by National
Instrument 43-101 and he has read and approved the accuracy of technical
information contained in this news release.
About Advance Gold Corp. (AAX.V)
Advance
Gold is a TSX-V listed junior exploration company focused on acquiring
and exploring mineral properties containing precious metals. The Company
acquired a 100% interest in the Tabasquena Silver Mine in Zacatecas,
Mexico in 2017, and the Venaditas project, also in Zacatecas state, in
April 2018.
The
Tabasquena project is located near the Milagros silver mine near the
city of Ojocaliente, Mexico. Benefits at Tabasquena include road access
to the claims, power to the claims, a 100-metre underground shaft and
underground workings, plus it is a fully permitted mine.
Venaditas
is well located adjacent to Teck’s San Nicolas mine, a VMS deposit, and
it is approximately 11km to the east of the Tabasquena project, along a
paved road.
In
addition, Advance Gold holds a 13.23% interest on strategic claims in
the Liranda Corridor in Kenya, East Africa. The remaining 86.77% of the
Kakamega project is held by Barrick Gold Corporation.
For further information, please contact:
Allan Barry Laboucan, President and CEO Phone (604) 505-4753 www.advancegold.ca
Posted by AGORACOM
at 1:52 PM on Thursday, October 3rd, 2019
SPONSOR: Advance Gold AAX.v – Advance Gold controls 100% interest in the Tabasquena Silver Mine in Zacatecas, Mexico. A cluster of 30 Epithermal veins have been discovered, with recent emphasis on exploring a large anomaly to drill. Advance also owns 15% of the Kakamega JV attached to Barrick Takeover Offer for Acacia Mining. Click Here For More Info
Recession fears are once again gripping financial markets and
pushing gold prices higher as sentiment within the U.S. service sector
fell more than expected, according to the latest data from the
Institute for Supply Management (ISM).
Thursday, the ISM said its nonmanufacturing index showed a reading
of 52.6% for September, down from August’s reading of 56.4%. The data
was much weaker than expected as consensus forecasts were calling for a
reading of 55.1%.
According to reports this is the lowest reading in three years.
Readings above 50% in such diffusion indexes are seen as a sign of
economic growth, and vice-versa. The farther an indicator is above or
below 50%, the greater or smaller the rate of change.
Ahead of the report, the gold market was holding its own above
$1,500 an ounce, recovering from a 2% selloff at the start of the week.
The latest economic data has added to gold’s gains. December gold
futures last traded at $1,518.80 an ounce, up 0.72% on the day.
Economists and analysts warned that disappointing service sector
data could boost recession fears as this is the largest component of
the U.S. economy.
The nonmanufacturing data comes just two days after the ISM said
that its manufacturing index fell even further into contraction
territory, also missing economist expectations.
“The non-manufacturing sector pulled back after reflecting strong
growth in August. The respondents are mostly concerned about tariffs,
labor resources and the direction of the economy,†said Anthony Nieves,
chair of the ISM Non-Manufacturing Business Survey Committee.
Looking at the components of the report, the Business Activity Index
dropped to a reading of 55.2%, down from August’s level of 61.5%.
The labor market also lost some momentum in September, with the
Employment Index falling to 50.4%, down from August’s level of 53.1%.
This indicator is closely watched by economists as it is used as a
predictor for Friday’s nonfarm employment report.
Some economists have noted that the miss in the ISM employment data points to downside risk to Friday’s employment report.
Posted by AGORACOM
at 9:19 AM on Wednesday, September 18th, 2019
Kamloops, British Columbia–(Newsfile Corp. – September 18, 2019) –
Advance Gold Corp. (TSXV: AAX) (“Advance Gold” or “the Company”) is
pleased to provide an exploration update on its Tabasquena gold and
silver project in Zacatecas, Mexico. To date, 10 drill holes have been
completed hitting widespread gold and silver mineralization in near
surface epithermal veins. Recently, a 3D induced polarization (IP)
survey was completed that identified a significant continuous
chargeability anomaly, with an east-west width of approximately 250
metres and an apparent strike length of over 800 metres. This anomaly is
located directly below the Tabasquena vein. The anomaly remains open
to the north and to the south and at depth. A second phase 3D IP
geophysical survey is scheduled to begin in the first week of October to
extend the grid to the south.
The purpose of the extended grid to
the south will be threefold, firstly it will establish the continuity
of the anomaly to the south, secondly whether or not the target anomaly
becomes shallower and lastly it will assist in positioning the upcoming
drill hole locations. It is planned to commence drilling once the IP
survey has been completed.
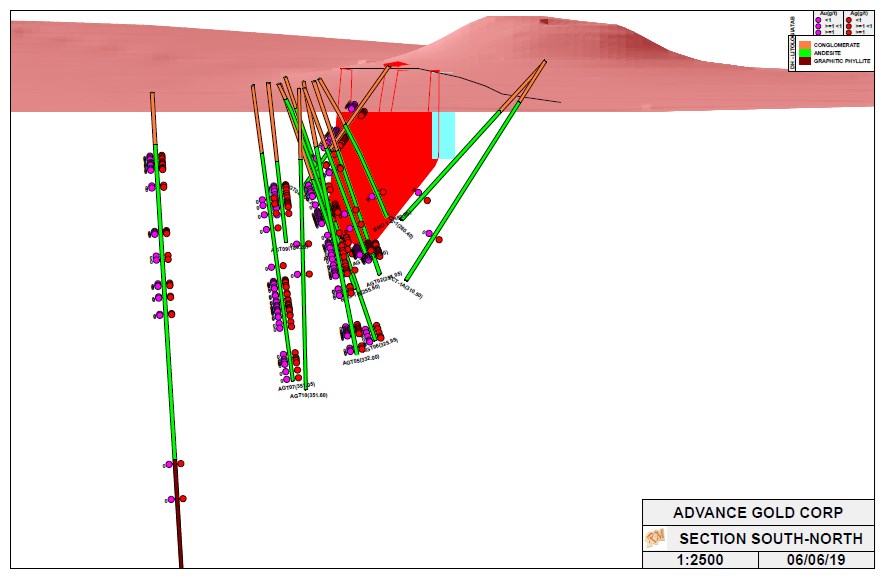
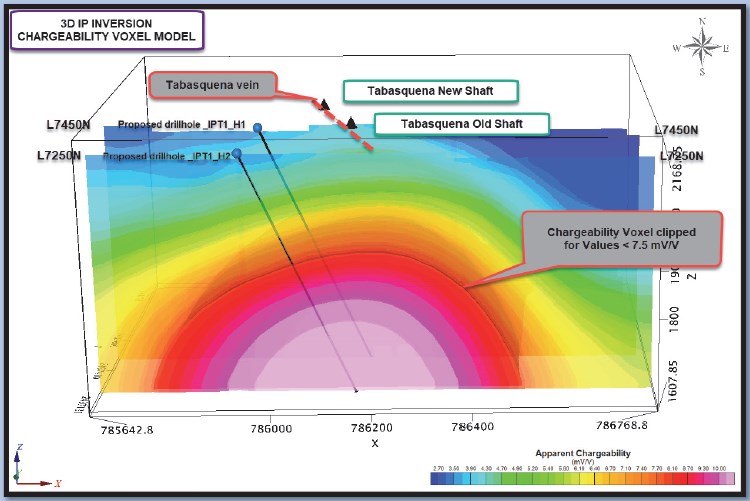
Images shown below are a 3D model of
the epithermal veins hit in previous drilling and a voxel inversion
model showing the extent of the large chargeability anomaly for lines
L7450N and L7250N. These two diagrams are an excellent representation of
the emerging targets at Tabasquena.
The black line at the surface
of the 3D model of drill holes is the surface projection of the
Tabasquena vein. The red shaded area is the historical mining done by
Penoles. The chargeability anomaly is approximately 250 metres below the
historical mining, and it follows the strike direction of the
Tabasquena vein. The epithermal veins, with highlighted widespread gold
and silver mineralization, are above and slightly to the west of the
deeper chargeability anomaly.
Allan Barry Laboucan, President and CEO of Advance Gold Corp., commented: “Our
exploration efforts at Tabasquena are coming together nicely with the
past drilling and the recent IP geophysical survey. It is important to
point out, the IP survey is meant to reveal sulphides through
chargeability. The epithermal veins are low sulphidation and relatively
small and don’t show up well in the IP survey, however right below these
veins is the large continuous chargeability anomaly of over 800 metres
from north to south and approximately 250 metres from east to west.
Before starting our next round of drilling, we wanted to extend the IP
grid to the south, where the anomaly is closer to surface. There is a
significant elevation change of approximately 300 metres from the
northernmost line of the geophysical survey to the most southerly one.
We have approximately 1500 metres to the southern limits of our claims.
The chargeability anomaly is open to the north, but due to the higher
elevation and more cover it exceeds the depth limits of the IP survey.
We are very excited to extend the grid to the south as that is the
direction of the highest intensity of the chargeability and where it
becomes closest to surface. The combination of the quality of Tabasquena
and our various projects, our low share count and a tight share
structure, with substantial insider ownership and tiny valuation, puts
us in a unique position relative to our exploration focused peers as the
market for gold and silver are gaining strength.”
Julio Pinto
Linares is a QP, Doctor in Geological Sciences with specialty in
Economic Geology and Qualified Professional No. 01365 by MMSA., and QP
for Advance Gold and is the qualified person as defined by National
Instrument 43-101 and he has read and approved the accuracy of technical
information contained in this news release.
About Advance Gold Corp. (AAX.V)
Advance
Gold is a TSX-V listed junior exploration company focused on acquiring
and exploring mineral properties containing precious metals. The Company
acquired a 100% interest in the Tabasquena Silver Mine in Zacatecas,
Mexico in 2017, and the Venaditas project, also in Zacatecas state, in
April, 2018.
The Tabasquena project is located near the Milagros
silver mine near the city of Ojocaliente, Mexico. Benefits at Tabasquena
include road access to the claims, power to the claims, a 100-metre
underground shaft and underground workings, plus it is a fully permitted
mine.
Venaditas is well located adjacent to Teck’s San Nicolas
mine, a VMS deposit, and it is approximately 11km to the east of the
Tabasquena project, along a paved road.
In addition, Advance Gold
holds a 13.23% interest on strategic claims in the Liranda Corridor in
Kenya, East Africa. The remaining 86.77% of the Kakamega project is held
by Barrick Gold Corporation.
Posted by AGORACOM
at 2:11 PM on Thursday, September 12th, 2019
SPONSOR: Advance Gold AAX.v – Advance Gold controls 100% interest in the Tabasquena Silver Mine in Zacatecas, Mexico. A cluster of 30 Epithermal veins have been discovered, with recent emphasis on exploring a large anomaly to drill. Advance also owns 15% of the Kakamega JV attached to Barrick Takeover Offer for Acacia Mining. Click Here For More Info
Diversify Well To Protect Oneself Against The Coming ‘Paradigm Shift’
The most important forces that now exist are:
1) The End of the Long-Term Debt Cycle (When Central Banks Are No Longer Effective) +
2) The Large Wealth Gap and Political Polarity +
3) A Rising World Power Challenging an Existing World Power = The Bond Blow-Off, Rising Gold Prices, and the Late 1930s Analogue
In other words now 1) central banks have limited ability to stimulate, 2) there is large wealth and political polarity and 3) there is a conflict between China as a rising power and the US as an existing world power.
If/when
there is an economic downturn, that will produce serious problems in
ways that are analogous to the ways that the confluence of those three
influences produced serious problems in the late 1930s.
Before I get into the meat of what I hope to convey, I will repeat my
simple timeless and universal template for understanding and
anticipating what is happening in the economy and markets.
My Template
There are four important influences that drive economies and markets:
Productivity
The short-term debt/business cycle
The long-term debt cycle
Politics (within countries and between countries).
There are three equilibriums:
Debt growth is in line with the income growth required to service the debt,
The economy’s operating rate is neither too high (because that will
produce unacceptable inflation and inefficiencies) nor too low (because
economically depressed levels of activity will produce unacceptable pain
and political changes), and
The projected returns of cash are below the projected returns of
bonds, which are below the projected returns of equities and the
projected returns of other “risky assets.â€
And there are two levers that the government has to try to bring things into equilibrium:
Monetary policy
Fiscal policy
The equilibriums move around in relation to each other to produce
changes in each like a perpetual motion machine, simultaneously trying
to find their equilibrium level. When there are big deviations from one
or more of the equilibriums, the forces and policy levers react in ways
that one can pretty much expect in order to move them toward their
equilibriums.
For example, when growth and inflation fall to lower than the desired
equilibrium levels, central banks will ease monetary policies which
lowers the short-term interest rate relative to expected bond returns,
expected returns on equities, and expected inflation. Expected bond
returns, equity returns, and inflation themselves change in response to
changes in expected conditions (e.g. if expected growth is falling, bond
yields will fall and stock prices will fall).
These price changes happen until debt and spending growth pick up to
shift growth and inflation back toward inflation. And of course all this
affects politics (because political changes will happen if the
equilibriums get too far out of line), which affects fiscal and monetary
policy. More simply and most importantly said, the central bank has the
stimulant which can be injected or withdrawn and cause these things to
change most quickly.
Fiscal policy, which changes taxes and spending in politically
motivated ways, can also be changed to be more stimulative or less
stimulative in response to what is needed but that happens in lagging
and highly inefficient ways.
For a simpler explanation of this template see my 30-minute animated video “How the Economic Machine Works†and for a more comprehensive explanation see my book Understanding the Principles of Big Debt Crises, which is available free as a PDF here or in print on Amazon. Also, to learn more about our extensive debt cycle research, please visit our debt crises research library on Bridgewater.com.
Looking at What Is Happening Now in the Context of That Template
Regarding the above template and where we are now, in my opinion, the most important things that are happening (which last happened in the late 1930s) are
a) we are approaching the ends of both the short-term and long-term
debt cycles in the world’s three major reserve currencies, while
b) the debt and non-debt obligations (e.g. healthcare and
pensions) that are coming at us are larger than the incomes that are
required to fund them,
c) large wealth and political gaps are producing political conflicts
within countries that are characterized by larger and more extreme
levels of internal conflicts between the rich and the poor and between
capitalists and socialists,
d) external politics is driven by the rising of an emerging power
(China) to challenge the existing world power (the US), which is leading
to a more extreme external conflict and will eventually lead to a
change in the world order, and [Ian Bremmer calls this the return of a
bi-polar world but with significant differences in the goals of the
powers—JM]
e) the excess expected returns of bonds is compressing relative to the returns on the cash rates central banks are providing.
As for monetary policy and fiscal policy responses, it seems to me that we
are classically in the late stages of the long-term debt cycle when
central banks’ power to ease in order to reverse an economic downturn is
coming to an end because:
Monetary Policy 1 (i.e. the ability to lower interest rates) doesn’t
work effectively because interest rates get so low that lowering them
enough to stimulate growth doesn’t work well,
Monetary Policy 2 (i.e. printing money and buying financial assets)
doesn’t work well because that doesn’t produce adequate credit in the
real economy (as distinct from credit growth to leverage up investment
assets), so there is “pushing on a string.†That creates the need for…
Monetary Policy 3 (large budget deficits and monetizing of them)
which is problematic especially in this highly politicized and
undisciplined environment.
More specifically, central bank policies will push short-term
and long-term real and nominal interest rates very low and print money
to buy financial assets because they will need to set
short-term interest rates as low as possible due to the large debt and
other obligations (e.g. pensions and healthcare obligations) that are
coming due and because of weakness in the economy and low inflation.
Their hope will be that doing so will drive the expected returns of cash
below the expected returns of bonds, but that won’t work well because:
a) these rates are too close to their floors,
b) there is a weakening in growth and inflation expectations which is also lowering the expected returns of equities,
c) real rates need to go very low because of the large debt and other obligations coming due, and
d) the purchases of financial assets by central banks stays in the
hands of investors rather than trickles down to most of the economy
(which worsens the wealth gap and the populist political responses).
This has happened at a time when investors have become increasingly leveraged long due to the low interest rates and their increased liquidity. As a result we see the market driving down short-term rates while central
banks are also turning more toward long-term interest rate and yield
curve controls, just as they did from the late 1930s through most of the
1940s.
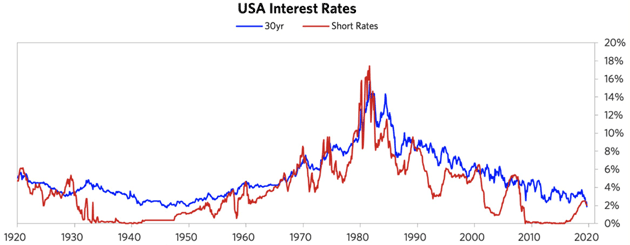
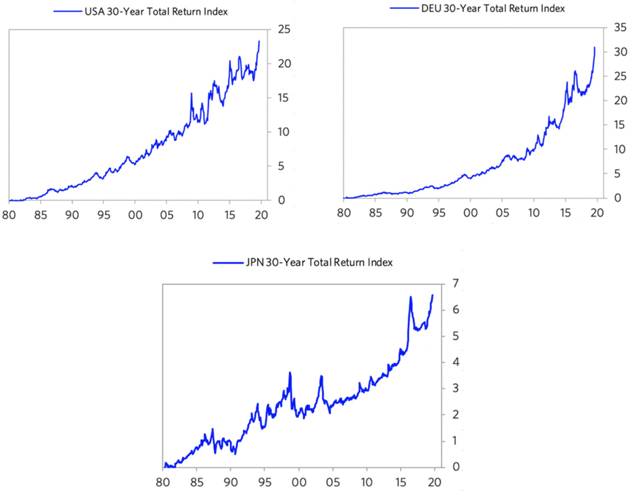
To put this interest rate situation in perspective, see the long-term
debt/interest rate wave in the following chart. As shown below, there
was a big inflationary blow-off that drove interest rates into a
blow-off in 1980–82. During that period, Paul Volcker raised real and
nominal interest rates to what were called the highest levels “since the
birth of Jesus Christ,†which caused the reversal.
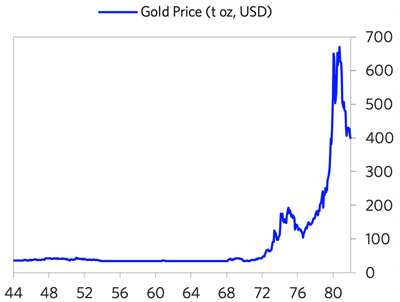
During the period leading into the 1980–82 peak, we saw the blow-off
in gold. The below chart shows the gold price from 1944 (near the end of
the war and the beginning of the Bretton Woods monetary system) into
the 1980–82 period (the end of the inflationary blow-off). Note that the
bull move in gold began in 1971, when the Bretton Woods monetary system
that linked the dollar to gold broke down and was replaced by the
current fiat monetary system. The de-linking of the dollar from gold set
off that big move. During the resulting inflationary/gold
blow-off, there was the big bear move in bonds that reversed with the
extremely tight monetary policies of 1979–82.
Since then, we have had a mirror-like symmetrical reversal (a dis/deflationary blow-off). Look
at the current inflation rates at the current cyclical peaks (i.e. not
much inflation despite the world economy and financial markets being
near a peak and despite all the central banks’ money printing) and
imagine what they will be at the next cyclical lows. That is because there
are strong deflationary forces at work as productive capacity has
increased greatly. These forces are creating the need for extremely
loose monetary policies that are forcing central banks to drive interest
rates to such low levels and will lead to enormous deficits that are
monetized, which is creating the blow-off in bonds that is the
reciprocal of the 1980–82 blow-off in gold. The charts below show the 30-year T-bond returns from that 1980–82 period until now, which highlight the blow-off in bonds.
To understand the current period, I recommend that you understand the
workings of the 1935–45 period closely, which is the last time similar
forces were at work to produce a similar dynamic.
Please understand that I’m not saying that the past is
prologue in an identical way. What I am saying that the basic
cause/effect relationships are analogous:
a) approaching the ends of the short-term and long-term debt cycles, while
b) the internal politics is driven by large wealth and political
gaps, which are producing large internal conflicts between the rich and
the poor and between capitalists and socialists, and
c) the external political conflict that is driven by the rising of an
emerging power to challenge the existing world power, leading to
significant external conflict that eventually leads to a change in the
world order.
As a result, there is a lot to be learned by understanding the mechanics of what happened then (and in other analogous times before then) in order to understand the mechanics of what is happening now.
It is also worth understanding how paradigm shifts work and how to diversify well to protect oneself against them.
by Ray Dalio, Bridgewater Associates, August 28, 2019
Posted by AGORACOM
at 9:45 PM on Tuesday, September 10th, 2019
SPONSOR: Advance Gold AAX.v – Advance Gold controls 100% interest in the Tabasquena Silver Mine in Zacatecas, Mexico. A cluster of 30 Epithermal veins have been discovered, with recent emphasis on exploring a large anomaly to drill. Advance also owns 15% of the Kakamega JV attached to Barrick Takeover Offer for Acacia Mining. Click Here For More Info
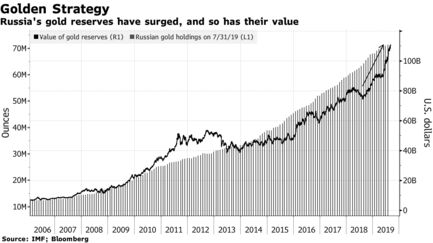
Value of Russia’s gold reserves climbed 42% in the past year
Russia is diversifying from U.S. assets and gold has rallied
Russia’s long-running bet on gold is looking better every month.
The
country quadrupled gold reserves in the past decade as it diversified
away from U.S. assets, a move that has paid off recently as haven demand
sent prices to a six-year high. In the past year, the value of the
nation’s gold jumped 42% to $109.5 billion and the metal now makes up the biggest share of Russia’s total reserves since 2000.
Russia’s central bank has been the largest buyer of gold in
the past few years as President Vladimir Putin seeks to break reliance
on the U.S. dollar as relations between the countries remain strained.
If Russia did need to tap its gold holding, it would fetch a hefty price
— the metal is heading for the best year since 2010 as the U.S.-China
trade war hurts global growth and central banks ease monetary policy.
“Russia
prefers to cushion its macroeconomic stability through politically
neutral tools,†said Vladimir Miklashevsky, a strategist at Danske Bank
A/S in Helsinki. “There is a massive substitution of U.S. dollar assets
by gold — a strategy which has earned billions of dollars for the Bank
of Russia just within several months.â€
More on Russia’s reserves
Russia’s
gold reserves total more than 2,200 tons, the fifth-biggest hoard by
country, and gold now accounts for 20.7% of overall reserves.The value of Russia’s currency reserves are up 9.5% in the past year, lagging the gains seen in bullion.The
central bank bought about 106 tons so far this year, the latest data
show. That’s down 19% from the same period in 2018 but still more than
any other nation.Last year, Russia’s gold buying exceeded its mine supply for the first time.
Russia
isn’t alone in hoarding gold. China, Kazakhstan and Poland have been
among the biggest buyers in the past couple of years, and global
holdings are expected to increase for a while yet.
Not all of Russia’s moves are paying off. Last year, the central bank shifted
about $100 billion of U.S. holdings into euros, yuan and the yen, and
since then the Chinese currency has dropped. Russia also missed out on
the rally in U.S. Treasuries.
Russia may keep buying gold to compensate for those other
losses in its reserves, said Kirill Tremasov, a former Economics
Ministry official and now director of analysis at Loko-Invest in Moscow.
So far it’s working, with gold up 18% this year to $1,513 an ounce.
For
Russia at least, it’s more about diversification than benefiting from
the price. The central bank started buying gold more than a decade ago
as it rallied toward 2011‘s record, and kept adding when prices dropped
in the following few years.
“The central bank is unlikely to have
pursued the goal of earning in the process of managing gold reserves,â€
Dmitry Dolgin, an economist at ING Bank, said by email. “The buying was
rather about diversification of assets
Posted by AGORACOM
at 9:50 AM on Monday, September 9th, 2019
SPONSOR: Advance Gold AAX.v – Advance Gold controls 100% interest in the Tabasquena Silver Mine in Zacatecas, Mexico. A cluster of 30 Epithermal veins have been discovered, with recent emphasis on exploring a large anomaly to drill. Advance also owns 15% of the Kakamega JV attached to Barrick Takeover Offer for Acacia Mining. Click Here For More Info
China has added almost 100 tons of gold to its reserves since it resumed buying in December
People’s Bank of China raised bullion holdings to 62.45 million ounces in August from 62.26 million a month earlier
Terms of Trade is a daily newsletter that untangles a world embroiled in trade wars. Sign up here.Â
China
has added almost 100 tons of gold to its reserves since it resumed
buying in December, with the consistent run of accumulation coming amid a
rally in prices and the drag of the trade war with Washington.
The
People’s Bank of China raised bullion holdings to 62.45 million ounces
in August from 62.26 million a month earlier, according to data on its
website at the weekend. In tonnage terms, August’s inflow was 5.91 tons,
following the addition of about 94 tons in the previous eight months.
Bullion
is near a six-year high as central banks including the Federal Reserve
cut interest rates as signs of a slowdown mount amid the U.S.-China
trade war. Central-bank purchases have been another key support for
prices as authorities from China to Russia accumulate significant
quantities of bullion to help diversify their reserves. That buying
spree likely to persist in the coming years, according to Australia
& New Zealand Banking Group Ltd.
Trade
war restrictions, in the case of China, or sanctions, as with Russia,
give “an incentive for these central banks to diversify,†John Sharma,
an economist at National Australia Bank Ltd., said in an email. “Also,
with increasing political and economic uncertainty prevailing, gold
provides an ideal hedge, and will therefore be sought after by central
banks globally.â€
China
has previously gone long periods without revealing increases in gold
holdings. When the central bank announced a 57% jump in reserves to 53.3
million ounces in mid-2015, it was the first update in six years.
Spot
gold rose 0.2% to $1,510.27 an ounce on Monday. Prices, which capped a
fourth straight monthly gains in August, have risen 18% this year.
Goldman Sachs Group Inc. and BNP Paribas SA are among banks that expect
the metal to challenge $1,600 an ounce within the coming months.
Posted by AGORACOM
at 1:41 PM on Thursday, September 5th, 2019
Kamloops, British Columbia–(Newsfile Corp. – September 5, 2019) –
Advance Gold Corp. (TSXV: AAX) (“Advance Gold” or “the Company”) is
pleased to announce that the recently completed 3D Induced Polarization
(IP) geophysical survey on its Tabasquena project in Zacatecas, Mexico
has outlined a significant continuous chargeability anomaly. This
anomaly has an east-west width of approximately 250 metres and an
apparent strike length of over 800 metres. The anomaly remains open to
the north and to the south and at depth.
The complete geophysical report on this work is available on the
company’s web site. Image below are cross sections representing a key
portion of the overall anomaly.
Allan Barry Laboucan, President and CEO of Advance Gold Corp. commented: “Based
on the size and number of vein intersections in the near surface
drilling in the andesites, our exploration team has felt that we have
found a very large system. The IP survey has now identified such a
possible system. Where the IP anomaly starts is approximately 100 metres
below the past drilling and almost directly under the main Tabasquena
vein. This depth is very important because it is approximately where the
graphitic phyllite horizon begins. The major mines nearby, operated by
Fresnillo Plc., and MAG Silver’s Juanicipio mine currently under
construction, are epithermal veins systems focused on zones within the
graphitic phyllites. We have now established the existence of a large IP
anomaly, below the widespread gold and silver mineralized veins, in the
graphitic phyllite horizon. We are currently making plans to extend the
IP grid to the north and south, and to commence our next drilling
campaign. To put the size of the anomaly into perspective, while taking
into consideration the widespread gold and silver mineralization above
it, it is safe to say that this is the size that all major gold and
silver mining companies would be interested in. It is clear to see that
our small gold and silver exploration company is sitting on a very large
target at a time when the industry is dramatically in need of new gold
and silver discoveries.”
Details of Geophysical Survey
The 3D Induced Polarization survey was carried out by GEOFISICA TMC
SA de CV, between August 3rd and August 14th, 2019. Approximately 9.6
kms of IP data was collected over the central portion of the company’s
claims. The IP grid consisted of nine, east-west lines, 100 metres
apart. Lines were approximately 1 km long. An off-set pole dipole array
was used.
Data processing and inversion of the data was carried out using
RES3DINV software. The inversion model was extended to approximately 550
meters below surface. 3D Voxel images together with a series of depth
slices were generated (all available on the company’s website).
The main purpose of the IP survey was to map, laterally and at depth
the evolution of the known silver veins and to identify new mineralised
structures. The survey was designed in such a way to allow approximately
500 to 550 metres of vertical depth investigation.
The IP survey area encompassed the historic and new shafts that are
located to the east of the Tabasquena and Nina veins that define a
mineralised system that outcrops at surface for 2.0 km. From past
exploration work, the Tabasquena vein was recognized over approximately
70 m along strike near the shaft but only at shallow depth (< 100 m).
The nine (9) vertical sections that were extracted from the 3D IP
inversion voxels suggest the presence of (4) four main stratigraphic
horizons (lithological units) mainly characterized by their resistivity
signatures.
The IP data also clearly shows that the large polarisable body/target
is apparently quickly deepening northward and getting closer to surface
southward. The IP anomaly starts at around 100 metres below the past
drill hole intersections that contained widespread gold and silver
mineralization in epithermal veins.
Chargeability and resistivity anomalies are indicated on the IP
sections (see report on company’s website) and are graded as per their
relative strength. Those chargeability anomalies that are deemed to be
caused by the same anomalous target are grouped together in what is
called a polarisable axis. Only one main axis was delineated following
the review of the IP data, which was labeled IPT-1 (Map C351-3 &
Figure 11, report on company website). This axis is a single large
amplitude continuous anomaly running north-south, coincident with the
two shafts at Tabasquena and the surface projection of the mineralised
veins. This anomaly has been categorized as having a high chargeability
and is conductive. The anomaly has an average depth of approximately 250
to 300 meters. The most southerly line (L7150N) clearly shows that this
anomaly is becoming shallower as one moves to the south. It should also
be mentioned that this anomaly is visible on every line, albeit less
intense on the most northerly line, as the target is becoming deeper to
the north.
In conclusion
This geophysical work has identified a large consistent chargeability
anomaly that can be seen on all lines, implying a strike extent of at
least 800 meters and an apparent width of 250 meters. This observed IP
anomaly could define a much wider mineralised system at depth.
The main recommendation of the geophysical report is to extend the 3D
IP survey to the southeast for at least 1 km in the direction of the
Tesorito shaft, which will determine the southerly extension of the main
anomaly and establish whether this main target is becoming shallower.
Following this a number of proposed boreholes are planned to intersect
this anomaly.
Julio Pinto Linares is a QP, Doctor in Geological Sciences with
specialty in Economic Geology and Qualified Professional No. 01365 by
MMSA., and QP for Advance Gold and is the qualified person as defined by
National Instrument 43-101 and he has read and approved the accuracy of
technical information contained in this news release.
About Advance Gold Corp. (AAX.V)
Advance Gold is a TSX-V listed junior exploration company focused on
acquiring and exploring mineral properties containing precious metals.
The Company acquired a 100% interest in the Tabasquena Silver Mine in
Zacatecas, Mexico in 2017, and the Venaditas project, also in Zacatecas
state, in April, 2018.
The Tabasquena project is located near the Milagros silver mine near
the city of Ojocaliente, Mexico. Benefits at Tabasquena include road
access to the claims, power to the claims, a 100-metre underground shaft
and underground workings, plus it is a fully permitted mine.
Venaditas is well located adjacent to Teck’s San Nicolas mine, a VMS
deposit, and it is approximately 11km to the east of the Tabasquena
project, along a paved road.
In addition, Advance Gold holds a 14.63% interest on strategic claims
in the Liranda Corridor in Kenya, East Africa. The remaining 85.37% of
the Kakamega project is held by Acacia Mining (63% owned by Barrick Gold
Corporation).
Posted by AGORACOM
at 2:38 PM on Tuesday, September 3rd, 2019
SPONSOR: Advance Gold AAX.v – Advance Gold controls 100% interest in the Tabasquena Silver Mine in Zacatecas, Mexico. A cluster of 30 Epithermal veins have been discovered, with recent emphasis on exploring a large anomaly to drill. Advance also owns 15% of the Kakamega JV attached to Barrick Takeover Offer for Acacia Mining. Click Here For More Info
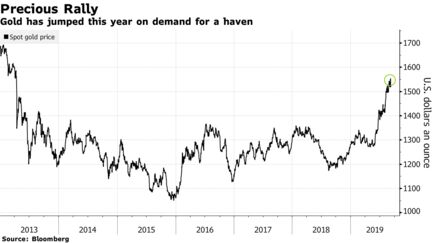
Uncertainties surrounding U.S.-China trade relations and Britain’s departure from the European Union influencing gold price
The dollar climbed to a more than two-year high against other major currencies, making dollar-denominated gold costlier for investors holding other currencies.
Gold prices held steady on Tuesday as
uncertainties surrounding U.S.-China trade relations and Britain’s
departure from the European Union offset pressure from a stronger
dollar.
Spot gold was up 0.1% at $1,532.48 per ounce but still not far off its more than six-year high of $1,554.56. U.S. gold futures were up 0.8% at $1,541.40.
“We are having a battle right now against multiple layers of
uncertainties in the market and a strong dollar,†Saxo Bank commodity
strategist Ole Hansen said.
“The trade talks between U.S. and
China are going nowhere. The political debacle in the UK with Brexit,
where we are potentially facing another vote before the day is over, is
adding enough underlying support to gold to offset the strength in
dollar.â€
The dollar climbed to a more than two-year high against
other major currencies, making dollar-denominated gold costlier for
investors holding other currencies.
On the trade front, China has
lodged a complaint at the World Trade Organization over U.S. import
duties, trashing the latest tariff actions as violating the consensus
reached by leaders of both countries at a meeting in Osaka.
In
Britain, lawmakers will decide on Tuesday whether to move towards a snap
election when they vote on the first stage of their plan to block Prime
Minister Boris Johnson from pursuing a no-deal Brexit.
But
analysts said that fears of a deceleration in global economic growth,
negative yielding debts around the world and hopes for interest rate
cuts by global central banks also provided support for gold.
“Given this week’s economic calendar is jam-packed with crucial economic
releases that will shape monetary policy expectations for the September
18 Federal Open Market Committee meeting, gold traders are trading very
delicately waiting for more convincing U.S. economic signals,†VM
Markets Managing Partner Stephen Innes said in a note.
Investors
are awaiting the U.S. manufacturing survey by the Institute for Supply
Management (ISM), due at 1400 GMT, for some forward guidance on U.S.
economic conditions.
Federal fund futures implied traders saw a 91% chance of a 25 basis point rate cut by the U.S. Federal Reserve this month.
“Rate cut will happen almost no matter what kind of economic data we’re
going to be presented with from now on until the Fed meeting but any
acceleration to the weaker side could increase the expectations of how
big the cut would be,†Saxo Bank’s Hansen said.
Silver rose 0.2% to $18.48 per ounce. Platinum was up 0.9% at $938.34 per ounce, while palladium gained 0.3% to $1,535.79.
Posted by AGORACOM
at 12:26 PM on Friday, August 30th, 2019
SPONSOR: Advance Gold AAX.v – Advance Gold controls 100% interest in the Tabasquena Silver Mine in Zacatecas, Mexico. A cluster of 30 Epithermal veins have been discovered, with recent emphasis on exploring a large anomaly to drill. Advance also owns 15% of the Kakamega JV attached to Barrick Takeover Offer for Acacia Mining. Click Here For More Info
Interest rates will keep going down and gold will keep going up in what Gluskin Sheff’s chief economist calls a ‘bona fide and durable gold rally’
Posted by AGORACOM
at 4:16 PM on Thursday, August 22nd, 2019
SPONSOR: Advance Gold AAX.v – Advance Gold controls 100% interest in the Tabasquena Silver Mine in Zacatecas, Mexico. A cluster of 30 Epithermal veins have been discovered, with recent emphasis on exploring a large anomaly to drill. Advance also owns 15% of the Kakamega JV attached to Barrick Takeover Offer for Acacia Mining. Click Here For More Info
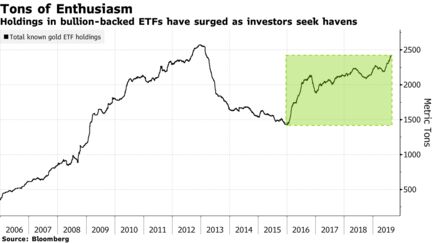
Worldwide holdings have rebounded since 2016 on rising demand
Goldman Sachs has forecast further gains in bullion to $1,600
Gold’s faring extremely well as a haven asset, with inflows into exchange-traded funds hitting 1,000 tons since holdings bottomed in early 2016 after a prolonged unwind in the wake of the global financial crisis.
Total known ETF holdings expanded to 2,424.9 tons on Wednesday, the
highest since 2013, following inflows over the past three years and a
continued build-up in 2019, according to data compiled by Bloomberg.
Current assets are about 1,000 tons higher than the post financial
crisis nadir of 1,425.1 tons.
Gold has surged this year as investors seek protection from slowing
global growth, the incessant trade war, and turmoil in the bond market
that suggests the U.S. may be headed for another recession. The rise has
been aided by a rate cut from the Federal Reserve and expectations more
will soon follow. This week, veteran investor Mark Mobius gave a
blanket endorsement to buying bullion, saying accumulating the precious
metal will reap long-term rewards.
Others are also bullish. Goldman Sachs Group Inc. has said prices will climb
to $1,600 an ounce over the next six months. The bank’s global head of
commodities research, Jeffrey Currie, said that gains are likely be
fueled by demand for ETFs as well as increased central-bank purchases.
Spot gold traded at about $1,500 on Thursday, up 17% this year.