Agoracom Blog Home

Archive for the ‘Great Atlantic Resources’ Category

$GR.ca Great Atlantic Drilling Intersects 7.89% Zinc EQ over 34.3 Meters 100% Owned Keymet Base Metal – Precious Metal Project $SIC.ca $LAB.ca

Posted by AGORACOM at 9:18 AM on Friday, January 18th, 2019
https://s3.amazonaws.com/s3.agoracom.com/public/companies/logos/564603/hub/GREATATLANTIC_LOGO_TESTER-e1480712241913.jpg
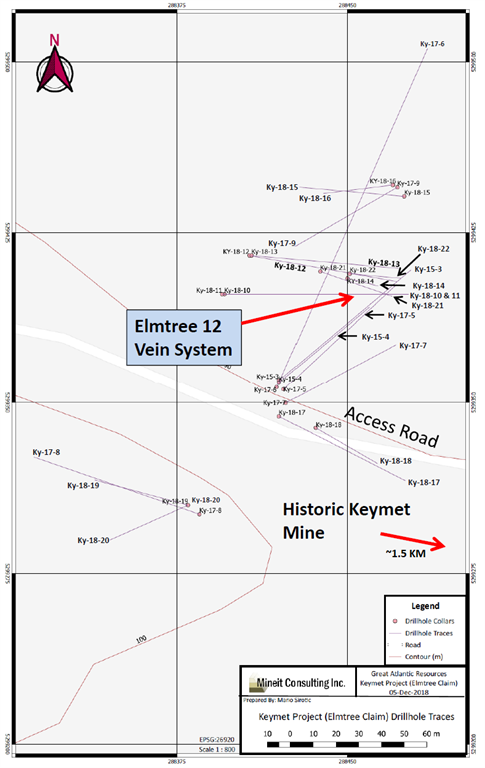
  • Drill results for holes 10 – 22 completed during 2018 exploration
  • Drilling conducted 1.5 km northwest of the historic Keymet Mine
  • Ky-18-14: 7.89% zinc equivalent over 34.3 m

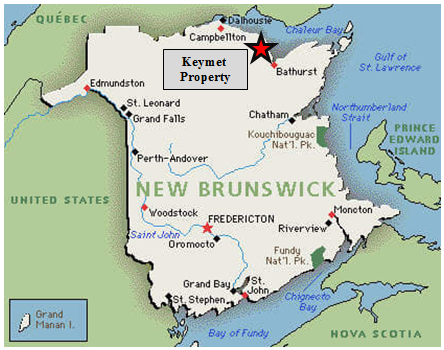
GREAT ATLANTIC RESOURCES CORP. (TSXV.GR) (the “Company” or “Great Atlantic”) is pleased to announce it has received drill core analytical results for 13 holes (Ky-18-10 to Ky-18-22) completed during the 2018 diamond drilling program at its Keymet Base Metal – Precious Metal Property, located near Bathurst, northeast New Brunswick. The program was conducted in the northwest region of the property approximately 1.5 km northwest of the historic Keymet Mine. Highlights include (core length):

  • Ky-18-14: 7.89% zinc equivalent over 34.3 meters (From 46.20 m to 80.50 m)
  • Ky-18-10: 10.91% zinc equivalent over 3.27 meters (From 85.03m to 88.30 m)
  • Elmtree 12 vein: System traced to approximately 145 meters depth, open at depth
  • Elmtree 12 vein: Strike length of approximately 110 meters and open along strike

Vein with semi-massive sulfides in Drill Hole Ky-18-14 at Elmtree 12 Vein System

The 2018 drilling program (13 holes totalling 1,484 meters) was conducted in the northwest region of the Keymet property. Eleven drill holes (Ky-18-10 to Ky-18-18, Ky-18-21 and Ky-18-22) tested the Elmtree 12 vein system as in-fill drilling and along strike with some holes testing deeper than previous drilling. Company management speculate the Elmtree 12 vein system to be striking approximately north-south and sub-vertical. Great Atlantic had previously drilled six holes in the Elmtree 12 vein system during 2015 and 2017, intersecting zinc, copper, lead and silver bearing polymetallic veins (News Releases of February 23, 2016, December 20, 2017 and March 2, 2018). Two drill holes (Ky-18-19 and Ky-18-20) tested the continuation of another base metal and silver bearing vein southwest of the Elmtree 12 vein system. This vein was discovered during 2017 drilling (Ky-17-8: 18.8% Zn, 3.5% Cu and 576 g/t Ag over 1.27 meters core length – News Release of March 2, 2018).

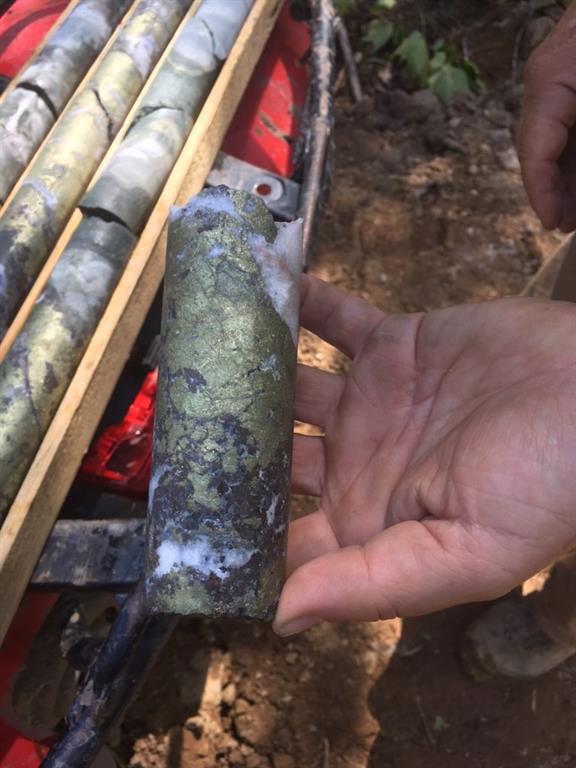
Sulfide Bearing Veins in Drill Hole Ky-18-14 at Elmtree 12 Vein System

Intersections from 2015, 2017 and 2018 diamond drilling programs in the area of the Elmtree 12 vein system include the following (core length):

Hole ID From (m) To (m) Length (m) Zn Equiv.
(%)
Zn (%) Cu (%) Pb (%) Ag
(g/t)
Au
(g/t)
2015 Diamond Drill Holes:
Ky-15-3 30.10 32.20 2.10
3.28
Ky-15-3 60.80 62.60 1.80 22.77 16.68 1.11 0.44 152
Ky-15-4 90.07 94.35 4.28 10.44 8.68 0.29 0.2 44.8
2017 Diamond Drill Holes:

Ky-17-5 81.00 81.80 0.80 20.24 13.65 1.20 0.45 166
Ky-17-6 119.45 131.50 12.05 8.31 3.54 0.92 0.28 115.6
Ky-17-6 incl. 119.45 124.40 4.95 16.05 7.67 1.57 0.48 209.3
Ky-17-6 148.80 149.75 0.95


4.9
Ky-17-6 164 183.96 19.96 0.64
Ky-17-8 31.00 32.27 1.27 39.90 18.8 3.55 1.16 576
Ky-17-9 45.75 47.13 1.38 6.29 4.29 0.29 0.23 55.4
2018 Diamond Drill Holes:
Ky-18-10 85.03 88.30 3.27 10.91 7.91 0.53 0.21 77.2
Ky-18-10 incl. 85.74 86.74 1.00 25.59 16.80 1.60 0.55 223
Ky-18-11 108.70 109.40 0.70 4.95 3.89 0.11 0.14 33.9
Ky-18-12 78.82 84.55 5.73 7.88 4.07 1.19 0.23 39.2
Ky-18-12 incl. 78.82 79.64 0.82 14.03 10.90 1.07 0.09 24.8
Ky-18-12 incl. 83.35 84.55 1.20 21.65 8.90 3.81 0.60 157
Ky-18-13 80.00 81.00 1.00
1.76
Ky-18-14 46.20 80.50 34.30 7.89 3.29 0.88 0.26 112.6
Ky-18-14 incl. 46.20 49.20 3.00 56.23 9.04 9.19 2.16 1158
Ky-18-14 incl. 62.48 63.00 0.52 18.49 15.45 0.96 0.13 32
Ky-18-14 incl. 67.00 67.60 0.60 13.59 13.05 0.09 0.05 14
Ky-18-14 incl. 76.00 80.50 4.50 14.27 12.08 0.31 0.30 59.8
Ky-18-16 77.20 77.72 0.52 33.48 4.47 7.85 0.72 478
Ky-18-17 10.43 11.00 0.57 11.72 6.37 0.10 6.08 14.5
Ky-18-17 67.00 67.50 0.50 7.23 6.05 0.21 0.15 27.5
Ky-18-18 72.50 73.50 1.00 2.74 2.04 0.09 0.11 19.6
Ky-18-19 13.02 13.72 0.70
1.05
Ky-18-20 32.00 32.28 0.28 10.75 2.39 1.82 0.87 164
Ky-18-21 145.50 147.00 1.50 8.26 2.31 0.89 0.81 156.6

Zinc equivalent (% Zn Equiv.) values for drill hole intersections are based on the following metal prices (as of January 16, 2019): Zinc US$2,467 / tonne (US$1.119 / lb.), Lead US$1,953 / tonne (US$0.886 / lb.), Copper US$5,881 / tonne (US$2.668 / lb.) and Silver US$15.605 per troy ounce. Metal recoveries of 100% were applied in the zinc equivalent calculations. The zinc equivalent calculation is as follows: Zn Equiv. = 100 x ((Ag Price in grams x Ag Grade) + (Pb Price x 2204.6 x Pb Grade (%) / 100) + (Cu Price x 2204.6 x Cu Grade (%) / 100) + (Zn Price x 2204.6 x Zn Grade (%) / 100)) / Zn Price x 2204.6.

Drill holes Ky-18-10 to Ky-18-13 were in-fill holes drilled east to slightly southeast at 45 to 57 degree dips. Drill holes Ky-18-14, Ky-18-21 and Ky-18-22 were collared closer to the vein system and at steeper dips (78-83 degrees) to intersect the vein system at a shallower angle to test continuity of mineralization along dip, locate possible ore shoots and gain a structural understanding of the vein’s vertical and horizontal orientations / extensions for targeted follow-up drilling. Hole Ky-18-21, drilled under Ky-18-14, tested the zone deeper. The mineralized intersection at 145.5-147 meters in this hole is the deepest intersection by the Company in the Elmtree 12 vein system and indicates the system is open at depth at this location. This interval also returned anomalous values for cobalt, including 0.07% Co over 1.0 meter core length.

The meta-sediments in the lower half of Ky-18-22 are intruded my mafic dykes, possibly cutting the vein system.

Drill holes Ky-18-15 and Ky-18-16 tested the extension of the Elmtree 12 vein system to the north. Ky-18-15 was drilled slightly northwest (approximate 55 degree dip). Ky-18-16 was drilled slightly southwest (approximate 73 degree dip). The metal rich intersection in Ky-18-16 indicates the mineralized system is open to the north at slightly deeper levels.

Drill holes Ky-18-17 and Ky-18-18 tested the Elmtree 12 vein system south of previous Company drilling. Mineralized veins and / or alteration was intersected in both holes, indicating the mineralized system to be open to the south.

Drill holes Ky-18-19 and Ky-18-20 were located southwest of the known extent of the Elmtree 12 vein system. These holes tested the extension of the high grade vein intersected in 2017 hole Ky-17-8. Ky-18-19 was drilled slightly northwest at an approximate 66 degree dip to intersect the vein deeper. Hole Ky-18-19 did not confirm the down-dip extension of the mineralized vein. Hole Ky-18-20 was drilled southwest at an approximate 55 degree dip. This hole intersected a near-surface narrow copper, lead, zinc and silver bearing zone (approximate 26 meters vertical depth) approximately 10 meters south of the high grade vein intersection of hole Ky-17-8.

Drill core from the 2018 program was geologically logged and sampled at a secure location in Miramichi, New Brunswick. Drill core samples were submitted to ALS Canada for gold analysis (Fire Assay-AA) and for 33 element analysis (including copper, lead, zinc and silver) by Four Acid and ICP-AES. Samples exceeding 1,500 g/t silver were re-analyzed for silver by Fire Assay-Gravimetric Finish. Quality Control samples were included as part of the sample submission. A Qualified Person verified the 2015, 2017 and 2018 exploration data for Great Atlantic. The Qualified Person managed these exploration programs at the Keymet Property.

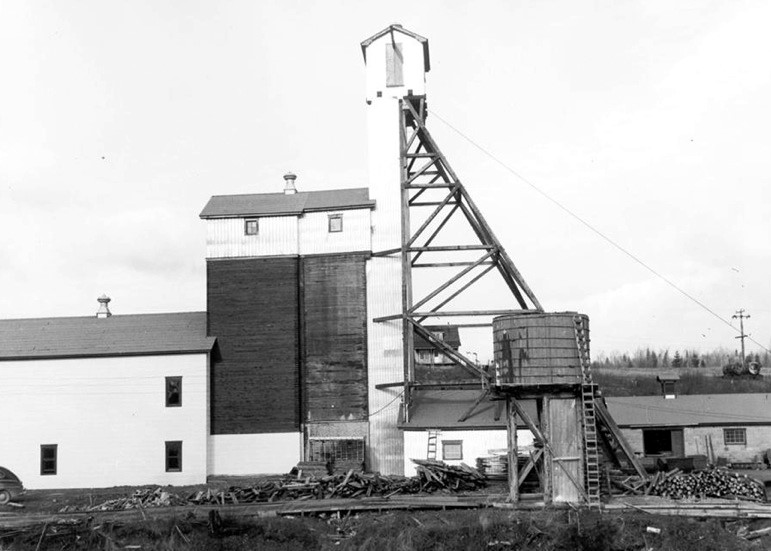
Historic Keymet Mine (1950s)

The Company’s focus since acquiring the Keymet Property has been the northwest region of the property in the area of reported polymetallic veins with most work in the area of the Elmtree 12 copper-lead-zinc-silver bearing vein system. At least seven vein occurrences with lead, zinc and +/- copper, silver and gold are reported in this region of the property in addition to the polymetallic veins reported at the historic Keymet Mine (source: New Brunswick Dept. of Energy and Resource Development Mineral Occurrence Database). The Keymet Mine operated during the mid-1950s, producing copper, lead, zinc and silver. Production at this mine was terminated due to a fire at the site.

Significant precious metal – base metal deposits are reported within 4 km of the Keymet Property. The Elmtree gold deposits are located within 3 km west-southwest of the Keymet Property. The historic Nigadoo River Mine is located approximately 4 km south of the Keymet Property. Polymetallic massive sulfide veins were mined at the Nigadoo River Mine during the 1960s and 1970s with copper, lead, zinc and silver being produced. The N.B Dept. of Energy and Resource Development Mineral Occurrence Database reports shaft depth and production totals at this historic mine. Production during 1967-1971 is reported as 1.126 million tonnes at 2.2% Pb, 2.1% Zn, 0.24% Cu and 92.57 g/t Ag. Production during 1973-1977 (after a 2 year closure) is reported to be 0.733 million tonnes (only partial metal grades reported). The shaft is reported to at least 470 meter deep.

The Nash Creek Zinc Project of Callinex Mines Inc. is located approximately 15 kilometers northwest of the Keymet Property. Callinex Mines Inc. recently filed a 43-101 Technical Report (effective date March 21, 2018) which was completed by Tetra Tech Canada Inc. The report includes updated mineral resource estimates for the Nash Creek Zinc Project (Hickey and Hayes Zones) using a 1.5% Zn Equiv. cut-off. This included 13,592,000 tonnes indicated estimated resources at 2.68% Zn, 0.58% Pb and 17.8 g/t Ag; and 5,929,000 tonnes inferred estimated resources at 2.68% Zn, 0.47% Pb and 13.9 g/t Ag (source: Callinex Mines Inc. Website).

Readers are warned that mineralization at the Elmtree gold deposits, historic Nigadoo River Mine and Nash Creek Zinc Project is not necessarily indicative of mineralization on the Keymet Property.

Access to the Keymet Property is excellent with paved roads transecting the property, including a provincial highway. The property covers an area of approximately 3,400 hectares and is 100% owned by the Company.

Readers are warned that historical records referred to in this News Release have been examined but not verified by a Qualified Person. Further work is required to verify that historical records referred to in this News Release are accurate.

David Martin, P.Geo., a Qualified Person as defined by NI 43-101 and VP Exploration for Great Atlantic, is responsible for the technical information contained in this News Release.

On Behalf of the board of directors

“Christopher R Anderson

Mr. Christopher R Anderson ” Always be positive, strive for solutions, and never give up “
President CEO Director
604-488-3900 – Dir

About Great Atlantic Resources Corp.: Great Atlantic Resources Corp. is a Canadian exploration company focused on the discovery and development of mineral assets in the resource-rich and sovereign risk-free realm of Atlantic Canada, one of the number one mining regions of the world. Great Atlantic is currently surging forward building the company utilizing a Project Generation model, with a special focus on the most critical elements on the planet that are prominent in Atlantic Canada, Antimony, Tungsten and Gold.

$GR.ca Great Atlantic Drill Program Commences at Kagoot Brook Co-Mn Base Metals Project, New Brunswick $SIC.ca LAB.ca MOZ.ca

Posted by AGORACOM at 9:23 AM on Tuesday, December 18th, 2018
https://s3.amazonaws.com/s3.agoracom.com/public/companies/logos/564603/hub/GREATATLANTIC_LOGO_TESTER-e1480712241913.jpg
  • Initiated maiden drill program at the cobalt-manganese base metals Kagoot Brook project in New Brunswick.
  • No drilling has ever been conducted and no source of the historic geochemical anomalies is known on the property.

  • VANCOUVER, BC / ACCESSWIRE / December 18, 2018 / GREAT ATLANTIC RESOURCES CORP. (TSX-V: GR) (the “Company” or “Great Atlantic”) is pleased to announce its optionee Explorex Resources Inc. has mobilized crews to initiate the maiden drill program at the cobalt-manganese base metals Kagoot Brook project in New Brunswick.Kagoot Brook Co-Mn base metals project

Historical work at Kagoot Brook has delineated two drainages, two kilometres apart, that exhibit a series of remarkably anomalous cobalt values up to 6,000 parts per million (1) in the silts.

Recent follow-up stream silt sampling programs performed by Explorex revealed:

  1. A significant concentration of and a strong relationship of cobalt with manganese and associated base metals (nickel, copper, lead and zinc);

  2. The relative percentage of the cobalt to manganese indicating a favourable high cobalt tenor (that is, grade component);

  3. A distinct upstream cut-off of the cobalt mineralization.

The project area is blanketed by a thin till cover with little or no outcrop and the in-stream silt-grade cut-offs are interpreted to closely reflect the southern contact of the underlying mineralized horizon. The grade cut-offs align well with stratigraphy adding confidence to the greater-than-two-kilometre inferred potential length of mineralization along the geological trend.

Kagoot Brook drill program

Explorex is taking advantage of a window of opportunity presented by a local drill company to complete two holes prior to the Christmas break. This initial two-hole, 500-metre drill program is limited in scope and designed to drill one partial transect across the target stratigraphy within the four-by-one-kilometre target area. Due to the near-Christmas timing of the drill program, it is anticipated that the core will be processed when the technical crew returns to the project in the New Year, with results reported thereafter.

No drilling has ever been conducted and no source of the historic geochemical anomalies is known on the property.

(1) The stream silt samples reported in this release are solely designed to show the presence or absence of mineralization and to characterize the mineralization. Silt samples are by definition selective and not intended to provide nor should be construed as a representative indication of grade or mineralization at the projects.

David Martin, PGeo, a qualified person as defined by National Instrument 43-101 and vice-president of exploration for Great Atlantic, is responsible for the technical information contained in this news release.

Option agreement

The Kagoot Brook property is 100 per cent owned by Great Atlantic Resources and is subject to an underlying agreement with Explorex Resources Inc. Explorex Resources is acquiring up to a 75-per-cent interest in the project (please see Great Atlantic Resources’ news release dated Feb. 14, 2018).

About Great Atlantic Resources Corp.: Great Atlantic Resources Corp. is a Canadian exploration company focused on the discovery and development of mineral assets in the resource-rich and sovereign risk-free realm of Atlantic Canada, one of the number one mining regions of the world. Great Atlantic is currently surging forward building the company utilizing a Project Generation model, with a special focus on the most critical elements on the planet that are prominent in Atlantic Canada, Antimony, Tungsten and Gold.

On Behalf of the board of directors

“Christopher R Anderson

Mr. Christopher R. Anderson “Always be positive, strive for solutions, and never give up”
President CEO Director
604-488-3900 – Dir

$GR.ca Great Atlantic Resources Corp. Files 43-101 Report on Golden Promise Project, Newfoundland $SIC.ca $MOZ.ca $LAB.ca

Posted by AGORACOM at 2:35 PM on Thursday, December 6th, 2018

https://s3.amazonaws.com/s3.agoracom.com/public/companies/logos/564603/hub/GREATATLANTIC_LOGO_TESTER-e1480712241913.jpg

  • Completed 43-101 includes a mineral resource estimate (Inferred ) for the Jaclyn Main Zone, Golden Promise
  • Golden Promise hosts multiple gold bearing quartz veins and is located in a region of recent significant gold discoveries
  • significant gold discoveries in this region include those of Sokoman Iron Corp. (TSXV.SIC) at the Moosehead Project and Marathon Gold Corp. (TSXV.MOZ) at the Valentine Lake Gold Camp.


VANCOUVER, BC / ACCESSWIRE / December 6, 2018 / GREAT ATLANTIC RESOURCES CORP. (TSX-V: GR) (the “Company” or “Great Atlantic”) announces that it has received and filed on SEDAR a National Instrument 43-101 Technical Report, dated December 4, 2018 (revising a previous filed version dated November 28, 2018) (the “Report“) on the Company’s Golden Promise Gold Property, located in the central Newfoundland gold belt. The report was completed by Mr. Greg Z. Mosher, M.Sc. App., P.Geo., and Mr. Larry Pilgrim, B.Sc., P.Geo. The amendments in the December 4 version of the technical report principally relate to disclosure of QA/QC programs in Part 11 and data verification in Part 12. The material conclusions of both versions of the Report are the same.

The Report includes the following mineral resource estimate (Inferred resources) for the Jaclyn Main Zone, the maiden resource estimate for the Company on the property:

Resource Cutoff Au g/t Au Cap g/t Au Uncap g/t Tonnes Au Ounces Capped Au Ounces Uncapped
Total 1.1 9.3 10.4 357,500 106,400 119,900
Pit-Constrained 0.6 11.4 14.1 157,300 57,800 71,200
Underground 1.5 7.5 7.6 200,200 48,600 48,700

(To view the full-sized image, please click here)

The Golden Promise Property hosts multiple gold bearing quartz veins and is located in a region of recent significant gold discoveries. The property is located within the Exploits Subzone of the Newfoundland Dunnage Zone. Within the Exploits Subzone, the property lies along the north-northwestern fringe of the Victoria Lake Supergroup (VLSG), a volcano-sedimentary terrane. The northwestern margin of the Golden Promise Property occurs proximal to, and, in part, contiguous with a major (Appalachian-scale) collisional boundary, and suture zone, known as the Red Indian Line (RIL). The RIL forms the western boundary of the Exploits Subzone. Recent significant gold discoveries in this region of the Exploits Subzone include those of Sokoman Iron Corp. (TSXV.SIC) at the Moosehead Project and Marathon Gold Corp. (TSXV.MOZ) at the Valentine Lake Gold Camp.


(To view the full-sized image, please click here)


(To view the full-sized image, please click here)

High-grade gold is reported in quartz veins and quartz vein boulders within the Golden Promise Property. Gold bearing quartz veins are reported in multiple areas of the property, including at least 5 gold bearing quartz vein systems reported in one zone referred to as the Jaclyn Zone, located in the northern half of the property. Much of the reported historical exploration within the property has been focused on the Jaclyn Zone with gold bearing vein systems reported at the Jaclyn Main, Jaclyn East, Jaclyn West, Jaclyn North and Jaclyn South Sub-zones. The majority of historic drilling (2002-2010) was conducted at the Jaclyn Main Zone. Significant historical work is also reported in the southwest region of the property at the Linda / Snow White vein, including grab sample reported to return 105 and 232 g/t gold, a reported channel sample returning 29.7 g/t gold / 0.5 meters, and a diamond drillhole intersection of 19.5 g/t gold / 1.15 meter core length. Gold bearing veins and gold bearing float are reported in other regions of the property.

The Report includes a mineral resource estimate for the Jaclyn Main Zone, the only area within the Property for which sufficient data exists to support a mineral resource estimate. The resource estimate was completed by Mr. Greg Z. Mosher, M.Sc. App., P.Geo.


(To view the full-sized image, please click here)

The current mineral resource estimate for the Jaclyn Main Zone is based on assays from 107 drillholes (2002 – 2010). The drill core from most of these holes has been preserved at a Provincial Government storage facility in Buchans, NL. As part of the data verification process prior to the resource estimate, core from five (5) holes, representing a range of contained gold grades and locations within the zone, were examined and six (6) quarter-core samples were collected from three of these holes for verification of the original assay values. The six check samples were assayed for gold in 2018 at ALS Canada in North Vancouver. The following table shows the comparison of original and check assay values.

Drill Hole From (m) To (m) Length (m) Original Au g/t Check Au g/t Sample #
GP02-09 47.6 48.3 0.7 1.4 1.455 CNF10434
GP02-09 48.3 48.7 0.4 1.0 0.005 CNF10435
GP06-51 153.5 153.8 0.3 14.1 25.1 CNF13676
GP06-51 153.8 154.2 0.4 9.4 4.27 CNF13677
GP07-74 181.0 181.5 0.5 5.2 1.79 CNF19937
GP07-74 181.5 182.0 0.5 2.4 0.083 CNF19938

Discrepancies between the original and check assays are attributable to the fact that 1) original and check samples were collected from different portions of the core; 2) the gold is particulate in nature and therefore a high degree of variability exists between the half-core and quarter-core samples; and 3) the original samples were assayed using screened metallics to capture any coarse particles of gold whereas the check samples were of too small a volume to permit the use of screening and therefore some gold particles may not have been captured by the analytical process.

Original assay certificates for approximately 60% of the Jaclyn Main Zone assays were checked against assay values in the dataset used for the mineral resource estimate and no discrepancies were found. The results of QA/QC monitoring of drill core samples submitted for analysis during the period 2004 – 2008 and 2010 – 2011, were compiled and assessed. These measures include use of standards, blanks and duplicate samples, although not all measures were employed in all programs. Regardless, all QA/QC metrics fall within acceptable limits.

The zone was modelled as a single quartz vein that strikes east-west and dips steeply to the south. Modelled vein thickness was based on true thickness derived from quartz vein intercepts. The estimate is based on 220 assays that were composited to 135 one-meter long composites. A bulk density of 2.7 g/cm3 was used. Blocks in the model measured 15 meters east-west, 1-meter north-south and 10 meters vertically. The block model was not rotated. Grades were interpolated using inverse-distance squared (ID2) weighting and a search ellipse that measured 100 meters along strike, two meters across strike and 50 meters vertically. Grades were interpolated based on a minimum of two and a maximum of 10 composites with a maximum of one composite per hole so the grade of each block is based on at least two drillholes thereby demonstrating continuity of mineralization. For the capped mineral resource estimate, all assays that exceed 65 g/t gold were capped at 65 g/t gold. All resources were classified as Inferred because of the relatively wide spacing of drill holes through most of the zone.

Because part of the vein is near surface the resource estimate was constrained by a conceptual open pit to demonstrate reasonable prospects of eventual economic extraction. Generic mining costs of US$2.50/tonne and processing costs of US$25.00/tonne were used together with a gold price of US$1,300/ounce. A conceptual pit slope of 45° was assumed with no allowance for mining loss or dilution. Based on the combined hypothetical mining and processing costs and the assumed price of gold, a pit-constrained cutoff grade of 0.6 g/t was adopted. For the underground portion of the resource a cutoff of 1.5 g/t was assumed. The cutoff grade for the total resource is the weighted average of the pit-constrained and underground cutoff grades. The resource estimate for conceptual pit-constrained and underground at various gold cutoff grades and total resource estimate are tabulated as follows:

Jaclyn Main Zone Inferred Mineral Resource Estimate: Pit-Constrained

Cutoff Au g/t Au Cap g/t Au Uncap g/t Tonnes Au Ounces Capped Au Ounces Uncapped
10 21.9 28.5 63,300 44,600 57,900
5 16.4 20.5 101,100 53,300 66,700
4 15.2 18.9 112,300 54,900 68,300
3 14.1 17.5 124,000 56,300 69,600
2 13.7 17 128,400 56,700 70,000
1.5 13.2 16.3 134,100 57,000 70,300
1 11.8 14.6 151,500 57,700 71,000
0.8 11.5 14.2 155,700 57,800 71,100
0.6 11.4 14.1 157,300 57,800 71,200
0.4 11.4 14 157,800 57,800 71,200
0.2 11.4 14 158,200 57,800 71,200

Mineral Resources are not Mineral Reserves and do not have demonstrated economic viability.
There is no certainty that all or any part of the Mineral Resources estimated will be converted into Mineral Reserves.
Mineral resource tonnage and contained metal have been rounded to reflect the accuracy of the estimate, and numbers may not add due to rounding.
Mineral resource tonnage and grades are reported as undiluted.
Contained Au ounces are in-situ and do not include recovery losses.

Jaclyn Main Zone Inferred Mineral Resource Estimate: Underground

Cutoff Au g/t Au Cap g/t Au Uncap g/t Tonnes Au Ounces Capped Au Ounces Uncapped
10 15.7 15.7 51,100 25,700 25,800
5 11.1 11.2 111,300 39,800 39,900
4 10.1 10.2 130,800 42,600 42,700
3 9.1 9.1 155,400 45,300 45,500
2 8 8.1 184,500 47,700 47,800
1.5 7.5 7.6 200,200 48,600 48,700
1 7 7 218,500 49,300 49,500
0.8 6.7 6.7 230,400 49,700 49,800
0.6 6.5 6.5 239,300 49,900 50,000
0.4 6 6 262,100 50,200 50,400
0.2 5.2 5.2 305,100 50,600 50,800

Mineral Resources are not Mineral Reserves and do not have demonstrated economic viability.
There is no certainty that all or any part of the Mineral Resources estimated will be converted into Mineral Reserves.
Mineral resource tonnage and contained metal have been rounded to reflect the accuracy of the estimate, and numbers may not add due to rounding.
Mineral resource tonnage and grades are reported as undiluted.
Contained Au ounces are in-situ and do not include recovery losses.

Jaclyn Main Zone Total Inferred Mineral Resource Estimate

Resource Cutoff Au g/t Au Cap g/t Au Uncap g/t Tonnes Au Ounces Capped Au Ounces Uncapped
Total 1.1 9.3 10.4 357,500 106,400 119,900
Pit-Constrained 0.6 11.4 14.1 157,300 57,800 71,200
Underground 1.5 7.5 7.6 200,200 48,600 48,700

Jaclyn Main Zone Block Model


(To view the full-sized image, please click here)

As discussed previously in this News Release, significant recent gold discoveries in the central Newfoundland gold belt within the Exploits Subzone include that of Sokoman Iron Corp. and Marathon Gold Corp. Sokoman Iron Corp. (TSXV.SIC) recently announced a high grade gold discovery on its Moosehead Property, located approximately 40 kilometers east-northeast of the Golden Promise Property. The discovery was made during the 2018 diamond drilling program. A drill intersection of 44.96 g/t gold over 11.90 meter core length was reported including a 1.35 meter core length quartz vein intersection of 385.85 g/t gold (Sokoman Iron Corp. News Release of July 24, 2018). The Valentine Lake Gold Camp of Marathon Gold Corp. (TSXV.MOZ) is located approximately 55 kilometers southwest of the Golden Promise Property. As reported on Marathon’s website, the Valentine Lake Gold Camp currently hosts four near-surface, mainly pit-shell constrained, deposits with measured and indicated resources totaling 2,691,400 oz. of gold at 1.85 g/t gold and inferred resources totalling 1,531,600 oz. of gold at 1.77 g/t. Readers are warned that mineralization at the Moosehead Property and Valentine Lake Gold Camp is not necessarily indicative of mineralization on the Golden Promise Property.

The Report may be subject to review by the British Columbia Securities Commission.

David Martin, P.Geo., a Qualified Person as defined by NI 43-101 and VP Exploration for Great Atlantic, is responsible for the technical information contained in this News Release.

On Behalf of the board of directors

“Christopher R Anderson

Mr. Christopher R Anderson ” Always be positive, strive for solutions, and never give up ”
President CEO Director
604-488-3900
[email protected]

About Great Atlantic Resources Corp.: Great Atlantic Resources Corp. is a Canadian exploration company focused on the discovery and development of mineral assets in the resource-rich and sovereign risk-free realm of Atlantic Canada, one of the number one mining regions of the world. Great Atlantic is currently surging forward building the company utilizing a Project Generation model, with a special focus on the most critical elements on the planet that are prominent in Atlantic Canada, Antimony, Tungsten and Gold.

FEATURE: Great Atlantic Resources $GR.ca Focused on Exploring Atlantic Canada

Posted by AGORACOM at 8:00 AM on Friday, November 9th, 2018

https://s3.amazonaws.com/s3.agoracom.com/public/companies/logos/564603/hub/GREATATLANTIC_LOGO_TESTER-e1480712241913.jpg

https://tpc.googlesyndication.com/simgad/5752379710820707897

Great Atlantic Resources – Focused on Exploring Atlantic Canada

3 Outstanding Exploration Projects in One Company

Great Atlantic Hub GR:TSXV

  • Great Atlantic Resource Corp. is simultaneously exploring Golden Promise, Keymet and South Quarry and Kagoot Brook Cobalt project
  • Each project a potential company maker in Atlantic Canada
  • 3.6$ million market cap
  • 52,303,542 million shares outstanding
  • Multiple projects capable of demonstrating exploration success

Golden Promise – Gold

  • Large, new gold Zone discovered at Golden Promise
  • The Jaclyn Main Zone of Golden Promise contains a NI 43-101 compliant inferred resource of 921,000 tonnes averaging 3.02 g/t Au (89,500 contained ounces of gold) at a 1 g/t Au cutoff.
  • Strike length of approximately 800m in length with 420 meters vertical depth.
  •  National Instrument 43-101 Technical Report on the Company’s Golden Promise Gold Property to be completed on property


Keymet – Pollymetallic

  • Current discoveries and exploration occur 1.4KM from the old Keymet mine.
  • 2012 trenching exposed a gold bearing shear zone, multiple samples averaged 1.09 g/t Au over 11.8m.
  • Hole Ky-2015-3 drilled a gold bearing interval of 3.28 g/t Au over 2.1m
  • Highly prospective Pollymetallic system with a new gold discovery
  • Hole Ky-17-8 (2017 discovery): 18.80% Zn (37.32% Zn Equiv. as of June 14 2018), 3.55% Cu, 1.16% Pb & 576 g/t Ag / 1.27 meter core length
  • Hosts multiple gold, silver, zinc, lead & copper occurrences in high grade veins


South Quarry – Tungsten / Lithium

  • South Quarry is a high priority tungsten property with lithium potential
  • High grade tungsten mineralization in veins (rubble & bedrock) in the South Quarry
  • Ten rubble grab samples exceeded 5% WO3 (3 of which exceeded 10% WO3)
  • Recently completed sampling program focused on areas of tungsten soil geochemical anomalies and a gold soil geochemical anomaly
  • Analyses are pending for rock samples collected for tungsten and gold.

FULL DISCLOSURE: Great Atlantic is an advertising client of AGORA Internet Relations Corp

#Gold demand to be positive in second half of 2018, says WGC report $AMK.ca $EXS.ca $MQR.ca $HPQ.ca $GZD.ca $GGX.ca $GR.ca

Posted by AGORACOM-JC at 2:56 PM on Wednesday, July 25th, 2018

  • Gold demand is likely to be healthy in the second half of 2018 on positive global economic growth, trade wars and its impact on currency and rising inflation, the World Gold Council (WGC) said in a report.
  • Gold price rose by more than 4 per cent in the first few months of the year, only to finish in June down by the same amount and this downward trend continued during July as gold dropped almost an additional percentage point, WGC said in its mid-year outlook 2018 today.

While gold’s volatility spiked in February and April, it has been moving in a relatively low range since, it added.

WGC said the gold’s performance has been mainly driven by factors including a strengthening US dollar, higher investor threshold for headline risk and soft gold demand.

“At the same time, gold’s price momentum and investor positioning in derivatives markets has accelerated its descent. We, however, believe that there may be reasons to be more optimistic during the second half of the year,” it said.

According to the council, macroeconomic trends like positive but uneven global economic growth, trade wars and their impact on currency and rising inflation and an inverted yield curve will support gold in the second half of 2018.

In India, the second half of the year is usually positive for gold as the harvest and wedding seasons during the autumn provide seasonal support for the market.

The economic policies rolled out by the government to draw the informal, cash-based economy into the formal sector, according to the report, are starting to translate into stronger economic growth.

Source: https://www.business-standard.com/article/economy-policy/gold-demand-to-be-positive-in-second-half-of-2018-says-wgc-report-118071901188_1.html

#Gold Market Will Remain Healthy In The Next 30 Years; Investors Won’t Be Disappointed – WGC $AMK.ca $EXS.ca $GZD.ca $GGX.ca $GR.ca $MQR.ca $HPQ.ca

Posted by AGORACOM-JC at 4:56 PM on Wednesday, May 30th, 2018
Wednesday May 30, 2018 09:23

  • While the face of the gold market might change in the next 30 years as technology develops, the asset class and its safe-haven appeal will remain solid
  • Kitco News, John Reade head of market research said that he does not expect gold’s role as an alternative asset and portfolio diversifier to be replaced by another asset like a cryptocurrencies within the next 30 years.

(Kitco News) – While the face of the gold market might change in the next 30 years as technology develops, the asset class and its safe-haven appeal will remain solid, according to the World Gold Council (WGC).

In an exclusive interview with Kitco News, John Reade head of market research said that he does not expect gold’s role as an alternative asset and portfolio diversifier to be replaced by another asset like a cryptocurrencies within the next 30 years. Reade added that it would take a complete disruption of the entire financial marketplace before gold is usurped as a world-class asset.

“The capital market structure as we see it will probably continue,” he said. “Gold is part of the financial system. It is a mainstream financial asset and it too will continue.”

Reade noted that the remaining question is around the venue where gold is traded – whether its traded in over-the-counter markets, through futures contracts or something else. Reade’s comments come as fin-tech firms develop new platforms for gold, including Tradewind, which has created a new digital platform Vaultchain Gold, which allows investors to buy fractional quantiles of gold. While the market is digital, the platform is backed 100% by physical gold, held by the Royal Canadian Mint.

In a WGC report that looks at the gold market all the way up to 2048, Reade said that so far there is no front runner in the digital gold market but there is growing potential.

“If one (or more) is successful, it could be as big a change to the gold markets as the development of ETFs, but with the added advantage of appealing to younger generations too,” he said.

Not only can digital gold markets help to democratize the precious metal, Reade said that they are seeing evolving technology in mobile application space that could be a game-changer for consumers in developing nations.

Reade noted that app-based saving accounts that let people store their savings in gold, is growing in popularity, especially in regions that have an under-developed banking system.

“I think opening up the gold market for investment purposes to the billions of people… who don’t have wide access to financial products is going to be a major development for the market,” he said.

China Will Play An Important Role In Gold And Global Financial Markets

While access to the gold market is expected to enter the digital realm, Reade said that they still expect to see a healthy physical demand, especially as China and India become more prominent players in the global marketplace with its growing middle class.

In his report, Reade said that the WGC expects the Chinese economy to surpass the U.S. and become, with its growing consumer sector, the biggest influence on global markets.

“Our research has shown that as nations become wealthier, consumers spend more money on gold,” he said. “The growth we see out of China is going to be good for gold demand. The U.S.’s loss in dominance will lead to a weaker currency that will also be good for gold.”

However, while, Reade sees potential for the U.S. dollar to lose some influence in the global market, he does not expect the greenback to completely lose its reserve currency status. China’s closed capital markets and currency restrictions make it impossible for the yuan to be a reserve currency, he added.

“If you want to become a reserve currency you have to allow people to hold that currency in size and let them transact freely. Until we get to that stage, there is no way China can take over as the new reserve currency of the world,”

Ultimately, while the market will see ebbs and flows in investor demand, Reade said that the gold market will remain healthy through the next 30 years. Not only will the yellow metal see consistent demand but, Reade added that the WGC’s research shows declining supply through the next 30 years.

“I don’t think people will be disappointed in the gold market 30 years from now,” he said. “You [can’t] take something that has 6,000 years of value and replace it with something new,” he added in his interview.

Source: http://www.kitco.com/news/2018-05-30/Gold-Market-Will-Remain-Healthy-In-The-Next-30-Years-Investors-Won-t-Be-Disappointed-WGC.html

A Prime Setup for Buying Power to Rush into #Gold Investment $AMK.ca $EXS.ca $GGX.ca $GR.ca $GZD.ca $MQR.ca

Posted by AGORACOM-JC at 12:11 PM on Wednesday, May 2nd, 2018

  • All signs point to gold investment
  • The safe haven metal took a hit as bond rates jumped in the fourth-quarter of 2016, but has been trending higher despite the rise in real interest rates
  • Gold bulls should take note of how gold prices have behaved in relation to long-term treasury bonds because they appear to be behaving differently than they have in the past

A Prime Setup for Buying Power to Rush into Gold Investment

All signs point to gold investment. The safe haven metal took a hit as bond rates jumped in the fourth-quarter of 2016, but has been trending higher despite the rise in real interest rates. Gold bulls should take note of how gold prices have behaved in relation to long-term treasury bonds because they appear to be behaving differently than they have in the past.

“U.S. inflation breakeven rates have been rising in tandem with oil prices, and gold tends to have a tight positive correlation with moves in inflation expectations.”

After the Great Financial Crisis, the two big exceptions were in the lead-up to the Brexit vote and in the aftermath of President Donald Trump’s election. In the former case, gold rose even as inflation expectations declined with bond yields; in the latter case, the opposite occurred. Here are two charts from TS Lombard, one shows gold decoupling from the 10-year TIPS yield and the other shows how gold tracking the yield curve:

Gold’s outlook looks rosy. The precious metal should benefit from late-cycle dynamics, which tend to favor real assets over stocks. A weaker dollar could help too and Venetis said what appears to be in the works today is the opposite of what happened following the 2013 taper tantrum:

“Back then, the currencies of current account-deficit emerging markets came under pressure as the dollar strengthened from a low point, deflationary headwinds spread and commodity prices suffered. Now, the currencies of large current account-surplus developed markets are appreciating as the dollar retreats from lofty levels, inflation picks up speed and commodity prices increase.”

He isn’t the only one bullish on gold. The commodity team at Goldman Sachs is betting that rising emerging-market wealth combined with geopolitical and trade war concerns will push haven prices higher.

Based on gold supply and demand dynamics, RBC Capital Markets’ gold analyst Christopher Louneyforecasts an average price of $1,307 per ounce for gold for 2018. “Each time gold has touched the higher end of the range [this year] it hasn’t been able to cling to that level for very long,” he wrote last week. “The question remains, how sustainable is this level?”

Maybe not that sustainable given the drop today. Or maybe this is merely a golden window of opportunity to buy. – Crystal Kim

Prefer gold investment now, or keep chasing momentum later?

You need to own gold – and you need to own shares in companies that find and mine it. I lay out seven reasons below, in what I’m calling the “Seven Pillars of Gold.”

Each “pillar” reinforces the argument for holding gold.

There’s some overlap between each of the pillars. In fact, it’s fair to say that many of the reasons to own gold actually segue back and forth, bumping into each other. But it’s possible to lay out seven distinct ideas. Here they are:

Pillar One: Oil prices are rising. Doubtless, you’ve noticed it if you’ve filled the fuel tank in your car with gasoline in the past nine months. From 2015 to late 2017, we enjoyed a three year respite from the olden days of $100 oil; but now, oil has decided to get up off the mat.

From a price in the $40 range a mere six months ago, we’re now into the $70s per barrel and higher prices are forecast. Of course, oil means energy, which means that higher oil costs will translate into higher prices for just about everything, not just at the fuel pump.

More costly energy will be a core component of inflation throughout the economy. That is, it will cost more to drive your car, for farmers to grow food, truckers to transport that food, businesses to buy supplies ranging from paint to roofing shingles.

That, and it will cost more to move all the other goods that support the economy. Indeed, energy-based inflation will eventually work its way all through the economy.

Rising energy costs are a type of inflation that we saw in the mid-2000s, during the previous runup to oil at over $130 per barrel in 2008. Then though, energy costs were squashed by “importing deflation” from low-priced overseas goods. But that trick has played out.

Americans haven’t experienced gut-ripping energy-based inflation in perhaps two generations, since the late 1970s and early 1980s. But when higher oil prices really pull into port, the ripple effect of inflation across every part of the economy will weaken the dollar’s purchasing power. We’ll see it in higher gold prices.

Pillar Two: Interest rates are rising. According to the Congressional Budget Office (CBO), interest on the national debt is among the fastest growing parts of the federal budget. In fact, by 2028 – just 10 years from now – the federal budget will spend more on interest payments (about one trillion dollars per year) than on defense (currently about $800 billion total).

Rising interest rates will crowd out most everything else in the federal budget, from defense to air traffic control to national parks. The budget money just won’t be there, because so much will go to pay interest. The only workarounds for Congress are less spending (ha!) or just open the spigots and roll with higher annual budget deficits.

Any way you cut it, the dollar – and the Federal Reserve’s unique powers of “money creation” – will surely be in play to wallpaper this mess. Again, we’ll see reduced purchasing power and higher gold prices.

Pillar Three: The petro-yuan. China has begun trading for oil in yuan, recently launching its so-called “petro-yuan.” Here’s the facts.

China is working hard to abandon the dollar as an instrument with which to pay for oil. It’ll use its own currency, the yuan, where and when possible. Currently, China’s petro-yuan contracts are what are called “long-dated,” meaning they commence in September 2018. (Four months is “long” if you’re trading.) In this respect, the Chinese are taking things slowly at first; no surprises.

China’s ultimate goal is to convince Saudi Arabia – one of China’s top-three oil suppliers – to take yuan in exchange for oil, and thus to abandon the 45-year link of Saudi oil to the petro-dollar.

If the globally dollarized oil trade takes a hit, it means many more bad things for the purchasing power of those “dead presidents” in your wallet or bank account.

Here’s the good news in all this. If you understand the implications, you are already several months ahead of the broad market on this. You have time to buy in on gold and miners. The entire setup is overall favorable for gold.

Pillar Four: Currency Wars. We’re already in the midst of “Currency Wars,” along the lines of what my colleague Jim Rickards discussed in his 2010 book of that title.

These types of monetary competitions are built around the very real understanding that nuclear armed nations cannot afford to fight old-fashioned, kinetic wars with each other. No battleships and bombers; but large, powerful nations can still play other games; such as cyber war and attacks on the other nation’s currency.

The currency war idea is ripe to hatch in the sense that Russia and China (among others) have accumulated immense amounts of gold over the past decade or so. Russia, in particular, is quite transparent about its national gold reserves, and Russian spokespeople make no secret that the gold is intended as a defense against dollar hegemony.

One of Jim’s theses in Currency Wars is that Russia and China could team up to combine their respective gold resources, and create a rival currency to the dollar. If the world trading system has an alternative to the dollar, it’s hard to imagine that the scenario would favor the U.S. dollar. Usage would likely decline to some level from decades past.

In other words, the dollar has had a runup in its percentage of world trade over the past 45 years. Looking ahead, if the dollar loses even some of its status as the world’s “reserve currency,” we should definitely expect to see its value decline and gold prices to increase.

Pillar Five: Tariffs, sanctions and potential trade wars. With global trade, it’s fair to say that everything is related to everything else. Lay a higher tariff on Chinese steel, and China taxes U.S. soybeans. Ban exports of high tech chips to China, and China might ban exports of rare earth magnetic powders to the U.S.

The “era of dollar supremacy is fast ending.

We no longer live in a unipolar, post-Cold War world in which the U.S. reigns supreme.” Indeed, to a large degree, the U.S. owes its current global economic and political dominance to a unique, near-accidental correlation of forces at the end of World War II in 1945. It’s a long story.

The short version is that the most destructive war in human history created the greatest economic engine that the world has ever seen. Post war, the U.S. was like the proverbial Phoenix, rising out of the ashes. It’s a massive, complex historical process, of course; but the point to keep in mind is that the post-war world – certainly that world for the U.S. – is coming to the end of its long, 73-year run.

Other nations, and even entire regions of the rest of the world, are rising; new phoenixes from their own beds of ash. Consider what analyst Christopher Preble recently wrote in the New York Times, that “America’s share of global wealth is shrinking. By some estimates, the United States accounted for roughly 50% of global output at the end of World War II… It has fallen to 15.1% today.”

Now, President Trump is using tariffs, taxes, sanctions and policy changes to try and rearrange the global trading dynamic. But global trade has evolved over the past four generations. Trump may or may not succeed in his quest to rearrange the elements of the U.S. economy; to “Make America Great Again. But if our nation is going to get into a trade war, you better have some gold in the vault.

Pillar Six: War. We’re living in a time of risky geopolitics, right at the edge of true war. Wars cost much “silver,” as the ancient Chinese scholar Sun Tzu once noted. As Sun Tzu wrote, “if the campaign is protracted, the resources of the State will not be equal to the strain.”

Now, consider the global scale of current saber rattling, from the Baltics to the Black Sea, to the Persian Gulf to the South China Sea, Korea and more.

More specifically, consider how NATO has expanded right against Russia, drawing wrath from the latter. Or think about Ukraine, where recent fighting has killed tens of thousands of soldiers and civilians. I barely need mention the Middle East, from Libya to Syria to Afghanistan.

You may have seen articles about the “new Cold War” between Russia and the West. It’s not just abstract anymore, either. It’s fair to say that U.S. forces are already “fighting” against Russians, in a manner of speaking, via full-fledged electronic warfare in the skies over Syria.

Meanwhile, on the other side of the globe, according to Admiral Philip Davidson, the likely next leader of U.S. Pacific Command, China has already taken control of the South China Sea.

We’re living in a world that’s quite close to real war, not just “currency wars.” And gold prices tend to spike on rumors of war, let alone when the shooting begins. One way or another – near-war, fight a war, win a war or especially when a side “loses” a war – it’s not good for the dollar. Come war, and rumor of war, we’ll see the value of dollars decline and gold prices increase.

Pillar Seven: Peak Gold. In a world where demand for gold is likely to rise for a wide variety of reasons, there will be less of it available to buy. We’re just not seeing a lot of new gold discovery. And fewer companies are spending the kind of funds required to make big impacts.

I’ve discussed the lack of investment and how large companies are spending big bucks, simply to stand still in terms of output. Even large gold miners are actively planning to shrink output, to focus on profitability.

We’re “there,” at the peak of gold production for a while to come, barring some sort of technical revolution – which might happen, but we’re not there yet.

When I look at the landscape for gold, I see the results of the lack of past exploration and development, and in consequence, few new mines coming online.

It’s accurate to say that gold output globally has plateaued just now; it’s likely declining in years to come. The result will be higher prices for gold, and for companies that mine it.

So there you have it; seven reasons why gold prices are geared to rise, benefitting metal owners and well-run miners that can pull yellow metal out of the ground.

Gold is in a breakout pattern, awaiting its moment. The price has been dammed-up for a while, via all manner of manipulations. But that golden dam is ready to break.

All the debt, the bad policy, the war dangers, the lack of investment and new output… It’s a prime setup for buying power to rush into the precious metal space.

Thus, Jim and I say to Gold Speculator subscribers, “Buy gold!”

And if you’re not already invested when the move begins, you’ll wind up chasing momentum. – Byron King

Source: http://www.commoditytrademantra.com/gold-trading-news/a-prime-setup-for-buying-power-to-rush-into-gold-investment/

#Gold Climbs After #China Imposes Tariffs $AMK.ca $EXS.ca $GGX.ca $GR.ca $GZD.a $MQR.ca

Posted by AGORACOM-JC at 11:41 AM on Monday, April 2nd, 2018
  • Gold prices rose Monday after China imposed tariffs on a range of U.S. goods, following through on a promise to retaliate against the Trump administration’s penalties on imports of Chinese steel and aluminum
  • Gold for June delivery added 0.8% to $1,337.40 a troy ounce on the Comex division of the New York Mercantile Exchange
By Amrith Ramkumar

April 2, 2018 10:19 a.m. ET

Gold prices rose Monday after China imposed tariffs on a range of U.S. goods, following through on a promise to retaliate against the Trump administration’s penalties on imports of Chinese steel and aluminum.

Gold for June delivery added 0.8% to $1,337.40 a troy ounce on the Comex division of the New York Mercantile Exchange. Prices have stayed between about $1,305 and $1,360 this year, moving within that range based on safe-haven demand from investors, swings in the dollar and worries about higher interest rates.

Some money managers favor gold when they think markets might turn rocky. Protectionist trade policies from the U.S. and China have stoked fears of a global trade war that leads to higher manufacturing costs and eventually slower economic growth, pushing some traders to scoop up gold.

The Chinese penalties range from 25% on American pork and eight other kinds of goods to 15% on fruit and 120 types of commodities, according to the Chinese Finance Ministry.

“Last night’s tariff news from China spooked the market, took the dollar lower and gave us a lot of safe-haven buying in gold,” said Bob Haberkorn, senior market strategist at RJO Futures.

A weaker dollar boosts gold by making it and other dollar-denominated commodities cheaper for overseas buyers. The WSJ Dollar Index, which tracks the U.S. currency against a basket of 16 others, pared early losses and was recently up less than 0.1%.

Investors will be monitoring speeches from Federal Reserve officials and economic data this week for the latest clues about the path for higher interest rates. Gold struggles to compete with yield-bearing assets as borrowing costs rise, and the prospect of two or three more increases following March’s rate increase has limited price gains, according to analysts.

“Rates are going to hang over any gold rally we have for the remainder of the year,” Mr. Haberkorn said.

Among base metals, copper for May delivery added 0.7% to $3.0480 a pound. Prices fell 7.9% in the first quarter to end an eight-quarter winning streak, hurt by trade tensions and lukewarm Chinese economic data. However, data released over the weekend showed an official gauge of China’s factory activity rose to a three-month high in March, as factories ramped up production following the Lunar New Year holiday.

Some investors expect data to pick up as the year goes on and supply disruptions from mining labor contracts up for renegotiations to buoy prices.

Write to Amrith Ramkumar at [email protected]

Source: https://www.wsj.com/articles/gold-climbs-after-china-imposes-tariffs-1522678783

#Gold Has Best Year Since 2010 With Near 14% Gain In 2017 #Mining $AMK.ca $EXS.ca $MQR.ca $GGX.ca $GR.ca $GZD.ca

Posted by AGORACOM-JC at 2:00 PM on Wednesday, January 3rd, 2018
  • Gold posted second straight annual gain in USD in 2017
  • Gold in 2017: up 13.6% USD, up 2.7% GBP, down 1.4% EUR
  • 2017 is gold’s best year since 29.5% gain in 2010
  • Strong performance despite rate hikes and stock bubble
  • India’s gold imports surged 67% in 2017, Turkish, Chinese demand strong
  • Gold finished 2017 with longest rally since June 2016
  • 2018: Currency War and The Year of the Phoenix?

Gold waved a very positive goodbye to 2017 and was delighted to shout ‘Happy New Year!’ to all investors. In doing so, gold bullion prices advanced for an eighth session yesterday, extending its longest stretch of gains since mid-2011.

This was the perfect start to a new year which followed an annual surge of nearly 14%. 2017 is the second year of gains for gold. In 2016 it posted 14% gains, its best gains since the 29.5% gain in 2010.

Gold bullion’s stellar advance is even more impressive when one considers the extremely mixed year that was 2017. It ranged from Federal Reserve rate hikes to rapidly advancing stock markets. The year’s events were like a tug-of-war on the drivers of the gold price.

Gold: bad or good?

2017 on paper perhaps should not have seen a 14% gain in the gold price.

There was an acceleration in global economic growth as countries began to keep pace with one another. Much to Trump’s delight official figures showed the U.S. economy performed well. Not only did the the unemployment rate touch a record low, but inflation also remained subdued.

Meanwhile the Fed hiked interest rates three times, something many believed would be the kryptonite to gold’s superhuman strength.

Investments that are often seen to as alternatives to gold performed exceedingly well. The U.S. stock market continued its record-breaking rally, while bitcoin and other cryptocurrencies experienced what can only be described as a bubblicious and parabolic rise in the last few weeks of 2017.

And, right at the last minute the Republicans managed to pass a very dodgy looking tax bill, prompting Trump to peacock around even more.

Following Trump’s election there had been high hopes for the price of gold. After all, here was a man who had been elected without political experience and on the back of creating social and economic divisions. However, following Trump’s inauguration there was a post-election sell-off at the start of the year. Many were clearly feeling positive about Trump’s impact on both the domestic and international stage.

As various unexpected scenarios played out, from failure to get much done in the White House to sober-rattling with North Korea, the precious metal began to climb. Towards the end of summer, in early-September the gold price hit a year-high of $1346/oz. It then quickly sold off.

Whilst the yellow metal finished the year with a respectable run of gains, the final figures did not match those of say, the S&P 500 which climbed by over 19% in the same year.

Does this mean that relatively speaking the gold price is something we shouldn’t be delighted with? Not at all. The year of 2017 was one of arguably bearish events for the price of gold yet it still made near 14% gains, better than money in a savings account.

This second year of climbing by gold should serve as a timely reminder that the precious metal is not something that will be poked and prodded thanks to short-term, unsustainable economic and political events. Gold investment is for the long-term and there is little benefit thinking that one event will affect the reasons to hold gold.

All of the ‘positives’ of 2017 such as low inflation, Fed hikes and tax bills being passed arguably came about because of farcical economic readings and political manoeuvring. None of the statistics or decisions made as a result are sustainable, particularly against a background of increasing geopolitical risk. The gold price reflected this, particularly in its reactions to what should have been bearish Fed-rate hikes.

It is safe to say that in 2018 gold will be sent significantly higher thanks to ongoing US dollar weakness, higher debt and deficits,  stronger growth combined with potential wage inflation, coming together in a perfect storm with geopolitical risks.

One of the key reasons for gold’s 14% climb in USD terms is thanks to the weakness in the US Dollar itself. There was a strong correlation between the gold price and the greenback in 2017. It’s also worth mentioning that the level of yield of the inflation-protected 10-year Treasuries at the end of the year was similar to the level at the beginning of the year (about 0.5 percent). People do not want the global reserve currency anymore.

2018: The year of the Phoenix?

Nearly 30 years ago The Economist predicted that 2018 would be the year of a new currency uprising. You have to give the magazine some kudos for this prediction. Given what we saw in 2017 with both the rise in bitcoin, cryptocurrencies generally and, of course, efforts by Russia and China to build financial allegiances away from the US dollar, a new world currency in 2018 is more likely than not.

That’s right, whilst the financial media can talk as much as they like about how great 2017 turned out to be, there were plenty of events behind the mainstream wall that were clearly preparing for a financial world where decisions of the last decade come back to bite us.

Moves by Russia and China to step away from US dollar hegemony continued and rapidly progressed in 2017. This forthcoming year does not suggest any sign of let up. Much of the moves away from the US dollar involve the use of gold as the intermediary currency. Exchanges and trade agreements are in full swing.

We also cannot mention 2017 without bitcoin. This was the year that the lead cryptocurrency truly arrived and established itself in the minds of the establishment.

As we have explained several times, bitcoin is not a substitute for gold. It has attracted a lot of hot money in the last year, but long-term this is not to the detriment of gold.

The upward trajectory of bitcoin places it firmly in bubble territory. This is good for gold, as Walter Otstott, a senior broker at Dallas Commodity Co. explained to Bloomberg. ‘If 2017’s hottest asset comes crashing back to Earth, speculative money may be drawn back into gold…He sees gold peaking at $1,600 an ounce next year, compared with the price on Friday of about $1,297.’

Our own experts also see great things for gold this year, particularly thanks to geopolitical threats by those truly looking to end US-power : North Korea.

GoldCore’s Mark O’Byrne told Bloomberg:

‘Gold could end the year at $1,500 if geopolitics heats up in North Korea or the Middle East.’ This is despite gold’s lack of reaction at the various threats from both Trump and Kim Jong-Un. However, gold loves uncertainty and this is certainty a situation which is dripping in volatile uncertainty.

2018: Will it hold its own against the last two years?

2017 showed us that there is still a show to be played out by governments and central banks. There is still a farce to be seen when it comes to reassuring us about the state of the global economy.

Gold’s price rise and the dollar’s weakness shows that there are question marks over this recovery. Gold may be indicating  the reality that very little has changed since the financial crisis. Any ‘fixes’ have been done with a bit of sellotape and little else. We build over the cracks rather than repair them.

Gold investors were rewarded this year for their patience. This is particularly the case given there is seemingly little difference to where we find ourselves today compared to the last two years. Arguably the world is much more uncertain.

2018 is a year not to take chances and to own physical, allocated an segregated gold. The risks in the system are bigger than ever and investors would be wise to take all measures to protect their wealth.

News and Commentary

Gold hits 3-1/2-month highs before dipping on dollar recovery (Reuters.com)

Asian Stocks Extend Advance After U.S. Tech Surge (Bloomberg.com)

Global Manufacturers Strain to Keep Up With Faster Economy (Bloomberg.com)

Gold hits three-month peak after late December rally (Reuters.com)

Silver will fare better than gold in 2018: Goldman Sachs (Rediff.com)

By itself gold could solve Sudan’s economic problems, mining minister says (DabangaSudan.org)

The criminal underwold is dropping bitcoin for another cryptocurrency (Bloomberg.com)

India gold imports surge 67 percent in 2017 on restocking, retail demand – GFMS (Reuters.com)

Turkey’s gold-backed bonds: Government in quest for hidden treasures (Nikkei.com)

Nomi Prins: The Next Financial Crisis Will Be Worse Than the Last One (ZeroHedge.com)

Gold Prices (LBMA AM)

03 Jan: USD 1,314.60, GBP 968.20 & EUR 1,092.96 per ounce
02 Jan: USD 1,312.80, GBP 968.85 & EUR 1,087.52 per ounce
29 Dec: USD 1,296.50, GBP 960.84 & EUR 1,082.45 per ounce
28 Dec: USD 1,291.60, GBP 960.43 & EUR 1,082.75 per ounce
27 Dec: USD 1,285.40, GBP 958.78 & EUR 1,081.54 per ounce
22 Dec: USD 1,268.05, GBP 947.74 & EUR 1,069.85 per ounce
21 Dec: USD 1,265.85, GBP 945.97 & EUR 1,065.09 per ounce

Silver Prices (LBMA)

03 Jan: USD 17.12, GBP 12.63 & EUR 14.25 per ounce
02 Jan: USD 17.06, GBP 12.59 & EUR 14.15 per ounce
29 Dec: USD 16.87, GBP 12.48 & EUR 14.07 per ounce
28 Dec: USD 16.74, GBP 12.46 & EUR 14.02 per ounce
27 Dec: USD 16.50, GBP 12.30 & EUR 13.87 per ounce
22 Dec: USD 16.18, GBP 12.08 & EUR 13.65 per ounce
21 Dec: USD 16.15, GBP 12.08 & EUR 13.61 per ounce

Source: http://news.goldseek.com/GoldSeek/1514986020.php