SPONSOR: American Creek owns a 20% Carried Interest to Production at the Treaty Creek Project in the Golden Triangle. 2019’s first hole averaged 0.683 g/t Au over 780m in a vertical intercept. 2020 drilling plans 18,000 to 20,000 metres from 7-10 drill platforms with four diamond drill rigs. The Treaty Creek property is located in the same hydrothermal system as the Pretivm and Seabridge’s KSM deposits and is fully funded for exploration in 2020. Click Here For More Info

Countries maintain gold reserves to stabilize currency against hyperinflation, particularly in the event of a major crisis like the one many economies worldwide currently face as a result of the coronavirus pandemic. Relatively few countries, however, have large gold reserves. In fact, over 80% of the world’s national gold reserves is held by the central banks and finance ministries of just 25 countries.
To determine the countries that control the world’s gold, 24/7 Wall St. reviewed data on gold reserves by country in tonnes – or metric tons – as of January 2020 from the World Gold Council. Data on gold as a share of a country’s total foreign exchange reserves also came from the WGC and is current as of January 2020.
The value of a country’s gold reserves in U.S. dollars was calculated using exchange rates current as of March 13, 2020. GDP and GDP per capita figures in 2018 are from the World Bank and are in constant 2011 international dollars. Data on population is also from the World Bank and is for 2018 or for the most recent period available.
Many, but not all of the countries on this list, are among the wealthiest nations on Earth, as these countries are able to buy up substantial gold reserves. These are the 25 richest countries in the world.
While some countries on this list have obtained gold reserves by purchasing from other countries, many of the nations with the biggest gold reserves, such as China, the United States, and Russia, are also the top gold-producing countries. China, the largest producer of gold in the world, alone accounted for 14% of global gold production in 2016.Â
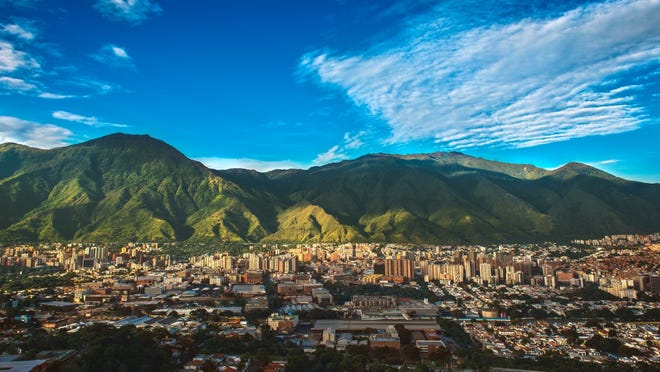
25. Venezuela
• Gold reserves as of January 2020: 161.2 tonnes
• Gold reserves in USD as of January 2020: $8.1 billion
• Gold as % of total foreign exchange reserves: 81.0%
• GDP: $271 billion ($9,402 per capita)
• Population: 28.9 million
24. Algeria
• Gold reserves as of January 2020: 173.6 tonnes
• Gold reserves in USD as of January 2020: $8.7 billion
• Gold as % of total foreign exchange reserves: 11.6%
• GDP: $580 billion ($13,737 per capita)
• Population: 42.2 million
23. Philippines
• Gold reserves as of January 2020: 197.9 tonnes
• Gold reserves in USD as of January 2020: $9.9 billion
• Gold as % of total foreign exchange reserves: 11.2%
• GDP: $847 billion ($7,943 per capita)
• Population: 106.7 million
22. Belgium
• Gold reserves as of January 2020: 227.4 tonnes
• Gold reserves in USD as of January 2020: $11.4 billion
• Gold as % of total foreign exchange reserves: 39.5%
• GDP: $498 billion ($43,582 per capita)
• Population: 11.4 million
21. Poland
• Gold reserves as of January 2020: 228.6 tonnes
• Gold reserves in USD as of January 2020: $11.5 billion
• Gold as % of total foreign exchange reserves: 9.3%
• GDP: $1.1 trillion ($28,786 per capita)
• Population: 38 million
20. Austria
• Gold reserves as of January 2020: 280.0 tonnes
• Gold reserves in USD as of January 2020: $14.1 billion
• Gold as % of total foreign exchange reserves: 56.1%
• GDP: $409 billion ($46,260 per capita)
• Population: 8.8 million
19. Spain
• Gold reserves as of January 2020: 281.6 tonnes
• Gold reserves in USD as of January 2020: $14.1 billion
• Gold as % of total foreign exchange reserves: 19.1%
• GDP: $1.6 trillion ($34,831 per capita)
• Population: 46.7 million
18. Lebanon
• Gold reserves as of January 2020: 286.8 tonnes
• Gold reserves in USD as of January 2020: $14.4 billion
• Gold as % of total foreign exchange reserves: 27.3%
• GDP: $79 billion ($11,607 per capita)
• Population: 6.8 million
17. United Kingdom
• Gold reserves as of January 2020: 310.3 tonnes
• Gold reserves in USD as of January 2020: $15.6 billion
• Gold as % of total foreign exchange reserves: 9.3%
• GDP: $2.7 trillion ($40,522 per capita)
• Population: 66.5 million
16. Saudi Arabia
• Gold reserves as of January 2020: 323.1 tonnes
• Gold reserves in USD as of January 2020: $16.2 billion
• Gold as % of total foreign exchange reserves: 3.2%
• GDP: $1.7 trillion ($49,101 per capita)
• Population: 33.7 million
15. Uzbekistan
• Gold reserves as of January 2020: 333.7 tonnes
• Gold reserves in USD as of January 2020: $16.8 billion
• Gold as % of total foreign exchange reserves: 56.7%
• GDP: $250 billion ($7,592 per capita)
• Population: 33 million
14. Portugal
• Gold reserves as of January 2020: 382.5 tonnes
• Gold reserves in USD as of January 2020: $19.2 billion
• Gold as % of total foreign exchange reserves: 76.8%
• GDP: $298 billion ($28,999 per capita)
• Population: 10.3 million
13. Kazakhstan
• Gold reserves as of January 2020: 386.5 tonnes
• Gold reserves in USD as of January 2020: $19.4 billion
• Gold as % of total foreign exchange reserves: 67.1%
• GDP: $452 billion ($24,738 per capita)
• Population: 18.3 million
12. Taiwan, province of China
• Gold reserves as of January 2020: 422.4 tonnes
• Gold reserves in USD as of January 2020: $21.2 billion
• Gold as % of total foreign exchange reserves: 4.3%
• GDP: N/A
• Population: N/A
11. Turkey
• Gold reserves as of January 2020: 428.7 tonnes
• Gold reserves in USD as of January 2020: $21.5 billion
• Gold as % of total foreign exchange reserves: 21.8%
• GDP: $2.1 trillion ($25,358 per capita)
• Population: 82.3 million
10. Netherlands
• Gold reserves as of January 2020: 612.5 tonnes
• Gold reserves in USD as of January 2020: $30.8 billion
• Gold as % of total foreign exchange reserves: 70.2%
• GDP: $858 billion ($49,787 per capita)
• Population: 17.2 million
9. India
• Gold reserves as of January 2020: 635 tonnes
• Gold reserves in USD as of January 2020: $31.9 billion
• Gold as % of total foreign exchange reserves: 7%
• GDP: $9.3 trillion ($6,888 per capita)
• Population: 1.4 billion

8. Japan
• Gold reserves as of January 2020: 765.2 tonnes
• Gold reserves in USD as of January 2020: $38.4 billion
• Gold as % of total foreign exchange reserves: 2.9%
• GDP: $5 trillion ($39,294 per capita)
• Population: 126.5 million
7. Switzerland
• Gold reserves as of January 2020: 1,040.0 tonnes
• Gold reserves in USD as of January 2020: $52.3 billion
• Gold as % of total foreign exchange reserves: 6.2%
• GDP: $505 billion ($59,317 per capita)
• Population: 8.5 million
6. China
• Gold reserves as of January 2020: 1,948.3 tonnes
• Gold reserves in USD as of January 2020: $97.9 billion
• Gold as % of total foreign exchange reserves: 3.1%
• GDP: $22.5 trillion ($16,182 per capita)
• Population: 1.4 billion
5. Russia
• Gold reserves as of January 2020: 2,279.2 tonnes
• Gold reserves in USD as of January 2020: $114.5 billion
• Gold as % of total foreign exchange reserves: 20.6%
• GDP: $3.8 trillion ($24,791 per capita)
• Population: 144.5 million
4. France
• Gold reserves as of January 2020: 2,436.0 tonnes
• Gold reserves in USD as of January 2020: $122.4 billion
• Gold as % of total foreign exchange reserves: 63.6%
• GDP: $2.6 trillion ($39,556 per capita)
• Population: 67 million

3. Italy
• Gold reserves as of January 2020: 2,451.8 tonnes
• Gold reserves in USD as of January 2020: $123.2 billion
• Gold as % of total foreign exchange reserves: 69.3%
• GDP: $2.2 trillion ($35,828 per capita)
• Population: 60.4 million
2. Germany
• Gold reserves as of January 2020: 3,366.5 tonnes
• Gold reserves in USD as of January 2020: $169.1 billion
• Gold as % of total foreign exchange reserves: 74%
• GDP: $3.8 trillion ($45,936 per capita)
• Population: 82.9 million
1. United States
• Gold reserves as of January 2020: 8,133.5 tonnes
• Gold reserves in USD as of January 2020: $408.7 billion
• Gold as % of total foreign exchange reserves: 77.9%
• GDP: $18.2 trillion ($55,719 per capita)
• Population: 327.2 million
24/7 Wall Street is a USA TODAY content partner offering financial news and commentary. Its content is produced independently of USA TODAY.