Sponsor: Loncor is a Canadian gold explorer that controls over 2,400,000 high grade ounces outside of a Barrick JV. The Ngayu JV property is 200km southwest of the Kibali gold mine, operated by Barrick, which produced 800,000 ounces of gold in 2018. Barrick manages and funds exploration at the Ngayu project until the completion of a pre-feasibility study on any gold discovery meeting the investment criteria of Barrick. Newmont $NGT $NEM owns 7.8%, Resolute $RSG owns 27% Click Here for More Info
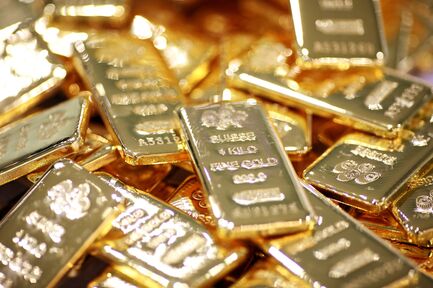
There is a dense yellow metal that is currently in the midst
of a global bull market amid the least amount of fanfare that I can
recall. The metal is gold and the bull market is very real and gaining
momentum by the day.
Gold is breaking out to all-time highs in
multiple global currencies including the euro, the British pound, the
Japanese yen, and the Australian dollar etc…
Gold Priced In Australian Dollars (Monthly – 20 Year)
Gold in Aussie dollar terms looks like one of the greatest bull markets of the last twenty years.
Gold Priced In Euros (Monthly – 20 Year)
New all-time high for gold priced in euro terms above 1500 euros per ounce!
Gold Priced In British Pounds (Monthly – 20 Year)
A new all-time high for gold in pound sterling terms!
Gold Priced In Japanese Yen (Monthly – 20 Year)
Â¥184,000 per ounce!
Got
the picture? Gold is experiencing a global rally, and gold in US dollar
terms is the only chart that has yet to make a new all-time recently.
However, a new high for gold in US dollar terms may not be that far
away…
Gold Priced In US Dollars (Monthly – 20 Year)
All of these charts share a similar story of
global currencies losing value relative to the only true store of value
that has stood the test of time, gold.
The US dollar has
recently benefited from its perceived safety and the relative strength
of the US economy compared to the eurozone, Japan, UK etc. The US stock
market has been the envy of the world since the March 2009 bottom with a
more than 400% gain for the S&P 500. However, there are mounting
signs that gold could outperform mega-cap US stocks over the coming
years.
In his brilliant “Paradigm Shift”
blog post, Ray Dalio laid out many of the reasons why he is much less
optimistic on future returns from equities and most forms of debt:
“I
think that it is highly likely that sometime in the next few years, 1)
central banks will run out of stimulant to boost the markets and the
economy when the economy is weak, and 2) there will be an enormous
amount of debt and non-debt liabilities (e.g., pension and healthcare)
that will increasingly be coming due and won’t be able to be funded with
assets. Said differently, I think that the paradigm that we are in will
most likely end when a) real interest rate returns are pushed so low
that investors holding the debt won’t want to hold it and will start to
move to something they think is better and b) simultaneously, the large
need for money to fund liabilities will contribute to the “big squeeze.â€
At that point, there won’t be enough money to meet the needs for it, so
there will have to be some combination of large deficits that are monetized, currency depreciations, and large tax increases,
and these circumstances will likely increase the conflicts between the
capitalist haves and the socialist have-nots. Most likely, during this
time, holders of debt will receive very low or negative nominal and real
returns in currencies that are weakening, which will de facto be a
wealth tax.”
Without delving into Dalio’s thesis
and debating future market returns, I don’t think it’s much of a leap to
look at the following chart and quickly surmise that i’d rather be long
than short:
Gold/S&P 500 Ratio Chart (Monthly – 20 Year)
The gold/S&P ratio peaked in 2011 and
proceeded to enter a seven year bear market correction which bottomed in
2018. If gold has indeed resumed its secular bull market (which new
highs in pretty every global currency appears to be confirming) then we
can expect the gold/S&P ratio to also move higher and eventually
move back above 1.0 (one ounce of gold in USD terms worth more than the
S&P 500 Index). Even a .6 ratio value would mean new all-time highs
for gold in USD terms (at Friday’s S&P 500 closing value of 3,337).
There are a lot of things to like in the above chart, but two stand out to me:
- The
monthly 14-period Relative Strength is moving above the median line
after multiple tests of the 50 level in the last several years – this is
characteristic of the early stages of a bull market.
- The
gold/S&P 500 ratio retested its initial bull market breakout peak
from early 2003 (~.40) and has spent the last 18 months wedging higher –
this ratio could be on the verge of embarking upon a much more
aggressive upward trajectory.
While gold is up
more than 20% in the last year, we haven’t heard much about it from the
mainstream media. Anecdotally, I don’t hear anyone talking about gold
aside from a small clique of gold bull die-hards and my usual sources on
Twitter and CEO.ca – the people who were
all in on cryptocurrencies in January 2018 and cannabis stocks in
February 2019 are no where near gold right now.
Welcome to the gold bull market of the roaring 2020s, it’s just getting started so why don’t you get comfortable and stay a while….
SOURCE: https://ceo.ca/@goldfinger/the-gold-bull-market-of-the-roaring-2020s-has-just-begun