Posted by AGORACOM-JC
at 2:03 PM on Saturday, March 2nd, 2019
 NOTICE: Iconic Minerals – Fox Business Network – Sunday March, 3, 2019
The Company would like to give notice to its shareholders that the Company’s CEO (Richard Kern) will be featured on national Fox Business Network on Sunday, March 3, 2019 at 10:37 PM Eastern, 9:37 PM Central, 8:37 PM Mountain and 7:37 PM Pacific Time
In this five minute segment, Richard Kern will be providing comments on
the lithium industry while onsite in Nevada, at the Bonnie Claire
property.
Please keep in mind that the allotted time slot may
not be exact, and the segment could air within an hour of the above
scheduled times.
On Behalf of the Iconic Team
Tags: gold, Iconic, stocks, tsx, tsx-v Posted in Iconic Minerals | Comments Off on NOTICE: Iconic Minerals $ICM.ca $BVTEF Featured On Fox Business Network – Sunday March 3, 2019 $LI.ca $MGG.ca $PAC.ca $CYP.ca $NEV.ca $SX.ca
Posted by AGORACOM-JC
at 5:01 PM on Friday, March 1st, 2019
OTTAWA, March 01, 2019 — betterU Education Corp. (TSX VENTURE:BTRU) (FRANKFURT:5OGA), (the “Company” or “betterU”) announced today it has filed its financial results for the nine months ended December 31, 2018. betterU is a Global Education Marketplace for emerging markets. The Company aggregates education, educational services and employment services from quality Institutions including universities, colleges, Industry leaders and corporations from around the world and makes their programs available to students through the betterU marketplace. betterU has now over 20,000 programs available.
Highlights for the nine months ended December 31, 2018 include:
For the quarter, the Company reported revenues of $13,728, and a net loss of $867,214.
On October 15th, 2018, betterU entered into two loan agreements
totaling $613,000 and entered into an agreement with AIP Asset
Management Inc., (AIP) for an investment of $2.5 million to support
ongoing operations and growth until the TUC funding is received. AIP and
betterU are working through all the definitive agreements in connection
with this funding.
On October 30, 2018, the Company provided an update on the investment progress.
According
to a written update provided to betterU on October 28th, 2018 by Mr.
Kenny Ho, CFO and Chairman of TUC Co. Ltd., (“TUCâ€) Mr. Ho indicated
that he arrived in Tokyo, Japan to review the amendments on Wednesday,
October 17th and that they completed the required documents on Friday,
October 19th. Mr. Ho further indicated in writing to betterU that he has
decided to remain in Tokyo until the funds have been released. Mr. Ho
expects there will be no further delays yet has not provided betterU
with definitive timelines for the release of funds. While Mr. Ho also
indicated that he expects the funds to be released shortly, betterU is
reluctant to commit to any dates having experienced many previous
delays. “While we remain confident in this opportunity, the ongoing
delays and missed timelines provided by TUC have proven to be difficult
in managing market expectations. Our focus has been and continues to be
on the development and growth of betterU,†said Brad Loiselle, President/CEO of betterU.
Outlook:
On Jan. 17, 2019 the Company provided following updates on its funding activities:
The
Company has completed a $1,250,000 equity investment by HT Overseas
Pte. Ltd., a wholly owned subsidiary of HT Media Limited, (“HTâ€) for the
purchase of 2,976,190 common shares of the Corporation at $0.42 per
share (the “Private Placementâ€) with a hold period expiring on May 17,
2019. As previously announced on December 21, 2017, HT’s $10 million
investment is provided to betterU in eight (8) tranches over two years,
this being the 3rd tranche with the full investment immediately being
paid to HT’s Media Groups by betterU to support betterU’s mass marketing
efforts across India.
The Company, over the last few months, has
been working on multiple funding opportunities motivated by the ongoing
delays from the $100M investment from TUC Co, Ltd. (“TUCâ€). These
delays have not been explained in detail to betterU because according to
GDS Holdings Ltd. (“GDSâ€), they are under confidentiality agreements
with their investment partners. betterU has received over 400 emails
over the last year with discussions not only with TUC and GDS, but also
with other organizations that are also part of TUC’s investment
portfolio. betterU has been in active discussions with the CEOs for
multiple groups in Canada and the USA with whom TUC and GDS have also
promised funding. Despite the ongoing support and assurances made by TUC
and GDS however, with these ongoing delays, it is not sustainable for
betterU to rely solely on TUC or GDS, so betterU has had no choice but
to seek other investment opportunities as outlined further below.
betterU’s agreement with TUC and GDS will remain active and when and if
GDS funds are released they will be in accordance with the terms of the
agreement executed by TUC and betterU on February 1, 2018.
The
Term Sheet with AIP Asset Management Inc., AIP Inc. (“AIPâ€) for
financing of $2.5 Million previously announced October 15, 2018, is
currently under review by betterU. AIP requires as a condition to
closing the financing that a subordination agreement (“SAâ€) be executed
by the creditors of betterU. After betterU’s creditors reviewed the SA
provided by AIP, they felt it was punitive to their rights as creditors
and decided not to sign it. betterU has been in discussions with AIP to
determine alternative solutions and while AIP is willing to provide
betterU with more time, at a cost, they still require that betterU’s
creditors execute on the SA. A further update to the market will be
forthcoming as this materializes further.
Additionally, in early
October 2018, betterU was invited to present to dozens of investors
organized by a Montreal investor relations firm known to betterU, Mi3.
During these events, betterU was introduced to the CEO of Quantiium
Capital Management Corporation (“QCMCâ€) an alternative funding group
located in Montreal QC who expressed interest in betterU. Over
subsequent months, betterU met with their leadership teams in Montreal,
Toronto and at betterU’s office in Ottawa. Following QCMC’s due
diligence process, a Letter of Intent was offered and executed by both
parties on December 5, 2018 which supports an investment of 5 Million
Euro (approximately CND$7.5M) through a credit facility backed by QCMC.
The agreements are currently under development with QCMC and the credit
facility is expected to be issued in favour of betterU. Further details
will be provided to the market as the agreements and timelines
materialize.
All investments are subject to board of director and
TSXV approvals. The Company wants to emphasize that they have no
control over the timelines of these investments.
On Jan. 29, 2019, the Company announced that the successful
acquisition of two corporate training contracts worth $26,812 with
Larsen & Toubro (L&T) and Maharashtra State Electricity
Transmission Company Limited (Mahatransco), both located in Mumbai,
India. These two training programs come on the heels of betterU’s
efforts to enhance their revenue focus and after the successful
completion of other such training programs and custom development
projects with groups such as Central Bank of India, Dena Bank,
Confederation of Indian Industries (CII), Indian Oil Corporation Limited
(IOCL), Blue Star, Dimension Data, Evry India and Acliv Technologies.
Additional information concerning the Company, including its audited
consolidated financial statements and its Management’s Discussion and
Analysis of Financial Condition and Results of Operations (“MD&Aâ€)
for the year ended March 31, 2018 can be found at www.sedar.com.
About betterU
betterU, an online education technology company, aims to provide
access to quality education from around the world in order to foster
growth and opportunity to those who want to better their lives. The
Company plans to bridge the prevailing gap in the education and job
industry and enhance the lives of its prospective learners by developing
an integrated ecosystem. betterU’s offerings can be categorized into
four broad functions: to compliment school programs with flexible KG-12
programs preparing children for their next stage of education, to foster
an exceptional educational environment by providing befitting skills
that lead to a better career, to bridge the gap between one’s existing
education and prospective job requirement by training them and lastly,
to connect the end user to various job opportunities.
Neither TSX Venture Exchange nor its Regulation Services Provider (as
that term is defined in policies of the TSX Venture Exchange) accepts
responsibility for the adequacy or accuracy of this release.
By their nature, forward-looking statements include assumptions and
are subject to inherent risks and uncertainties that could cause actual
future results, conditions, actions or events to differ materially from
those in the forward-looking statements. If and when forward-looking
statements are set out in this news release, betterU will also set out
the material risk factors or assumptions used to develop the
forward-looking statements. Except as expressly required by applicable
securities law, the Company assumes no obligation to update or revise
any forward-looking statements. The future outcomes that relate to
forward-looking statements may be influenced by many factors, including,
but not limited to: industry cyclicality; the ability to secure third
party agreements; successful integration of betterU’s system with third
party technology; competition; reduction in demand for products;
collection from customers; relationships with suppliers; product
liability; intellectual property; reliance on key personnel;
environmental; interest rates; uninsured and underinsured losses;
operating hazards; risks of future legal proceedings; income tax
matters; credit facilities; availability and terms of financing;
distribution of securities; restrictions on potential growth; effect of
market interest rates on price of securities; and potential dilution.
betterU does not assume any obligation to update any forward-looking
statements except as required by law.
CONTACT INFORMATION
For further information, please visit http://www.betteru.ca/investor-overview/
Posted by AGORACOM-JC
at 3:46 PM on Friday, March 1st, 2019
SPONSOR: Bougainville
Ventures Inc (CSE: BOG) Converting irrigated farmland to
greenhouse-equipped farmland. Bougainville does not “touch the plantâ€
and only provides agricultural infrastructure as a landlord for
licensed marijuana growers. Click here for more info.
BOG:CSE —————————————
Why The Cannabis Sector Has More Room to Run
Positive developments are palpable in the marijuana industry.
Be it acquisitions, expansion into industries like food, beverage, tobacco and cosmetics or legalization, things are increasingly falling into place for marijuana.
From Sanghamitra Saha: Positive developments are palpable in the marijuana industry. Be it acquisitions, expansion into industries like food, beverage, tobacco and cosmetics or legalization, things are increasingly falling into place for marijuana. ETFMG Alternative Harvest ETF (MJ – Free Report) is up 48.7% this year and appears to have more room to run.
Will FDA Regulate CBD in April?
There is growing demand for uses of CBD, a non-psychoactive
ingredient in cannabis, in food, drinks and cosmetics. Naturally,
companies selling food and drinks with CBD want FDA regulation for the industry. Though the U.S. FDA has forbidden companies from infusing CBD in food, many drink companies have announced plans to use it.
Congress legalized hemp products,
including most CBD, in December in the 2018 Farm Bill. The FDA now has
to set new rules for the industry. Amid ongoing legal uncertainty, which
is causing quite an upheaval for the rising industry, FDA Commissioner
Scott Gottlieb’s latest comment brought good news for the industry. He
said “public meetings will be held sometime in April to hear from
relevant parties on how best to regulate CBD derived from hemp,†per
MarketWatch.
The joining of Martha Stewart came with the deal between Sequential Brands Group Inc. (SQBG – Free Report)
(up 40% on Feb 28) and Canopy Growth (up 3.6% on the day). Sequential
Brands, which is a licensing and brand management company, owns
Stewart’s media company Living Omnimedia since Dec 2015.Substantial Growth Prospect in Hemp-CBD Market
The Hemp Business Journal estimates that sales in the hemp-CBD market
will shoot up from $390 million in 2018, to about $1.3 billion by 2022.
As U.S. cannabis companies are still under regulatory prohibitions,
Canadian operators are looking for ways to expand their reach by mergers
and acquisitions, per the source.
And the hemp-CBD market offers lucrative opportunities for this. This
is because the 2018 Farm Bill subjects hemp and its derivatives to
agricultural products category rather than controlled substances.
Canopy Growth has plans to invest between $100 million and $150
million in a hemp industrial park in New York state, per Reuters.
Meanwhile, Canada’s Tilray(TLRY – Free Report) is working with Authentic Brands Group on
a line of consumer products. Tilray announced an acquisition of the
world’s largest hemp food maker Manitoba Harvest for about $318 million
in February. Arcadia Biosciences Inc. (RKDA – Free Report)
– which normally develops food ingredients from wheat and soybeans –
saw its shares jumping 49% on Feb 28 after it divulged plans to foray into the hemp industry (read: Top ETF Stories of February).
Tags: Marijuana, stocks, tsx, weed Posted in Bougainville Ventures | Comments Off on Bougainville Ventures Inc $BOG.ca – Why The Cannabis Sector Has More Room to Run $CROP.ca $VP.ca NF.ca $MCOA
Posted by AGORACOM-JC
at 3:10 PM on Friday, March 1st, 2019
SPONSOR: New Age Metals Inc.
(TSX-V: NAM) The company’s new Lithium Division has already made
significant acquisitions in Canada and the USA. The company also owns
one of North America’s largest primary platinum group metals deposit in
Sudbury, Canada. Learn More.
NAM: TSX-V
———————
Riding the palladium wave, Implats to build new mine in 2021
This has all been down to a massive supply deficit that has existed since 2012 and the situation is expected to remain this way for the next few years.
JOHANNESBURG — The price of palladium
has been on a tear in recent months, overtaking the gold price. This
has all been down to a massive supply deficit that has existed since
2012 and the situation is expected to remain this way for the next few
years. Amid this backdrop, miner Implats
believes palladium isn’t in a bubble and that demand for the metal
could continue for the next few years to come. That’s why Implats is now
building a new palladium mine in the Waterberg that will come online in
2024. South Africa’s mining sector will certainly welcome this
development and, hopefully, it will help breathe new life into the
sector. Helping fuel Cyril Ramaphosa’s drive for jobs. – Gareth van Zyl
By Felix Njini
(Bloomberg) – Impala Platinum Holdings Ltd.
plans to start building a new palladium mine that could begin producing
as soon as 2024 as the company’s outlook for metals turns bullish.
Implats, as the second-biggest platinum miner is known, plans to start work on the Waterberg project
in South Africa in 2021, Chief Executive Officer Nico Muller said. The
producer is also considering boosting output at its jointly held Mimosa
mine in Zimbabwe by 30% as it bets on a long-term shift in
platinum-group metals prices, Muller said.
A surge in palladium prices
and a weaker rand is dispelling the gloom that gripped South African
miners just a year ago. The metal used in pollution-control devices for
car engines is forecast to remain in deficit for an eighth straight year
in 2019, and Implats isn’t the only company seeking new sources of
supply. The world’s top platinum supplier, Anglo American Platinum Ltd.,
is studying plans to ramp up palladium output through the expansion of
its flagship Mogalakwena mine.
“I believe the change in PGMs is structural and not cyclical, so we
are fully confident that the buoyant market we see today is going to
prevail for the next 10 years,†Muller told reporters in Johannesburg
after announcing earnings Thursday. “When you contemplate a project like
this, you have to have a long-range view, and we have a very bullish
position at the moment.â€
Despite a stronger market for platinum-group metals and improved liquidity, Implats is sticking with plans to restructure loss-making mines
at its Rustenburg complex, Muller said. Implats will evaluate options
to boost output in existing businesses and may consider assets outside
its current portfolio, the CEO said.
The shares have rallied 63% this year.
Implats will exercise its options to increase its stake to more than
50% from 15% of the Waterberg project, which is being developed jointly
with Platinum Group Metals Ltd. and Japan Oil, Gas and Metals National
Corp. The deposit could produce about 450,000 ounces of palladium and
about 290,000 ounces of platinum a year, initial studies show. The high
proportion of palladium means raising money is unlikely to be a major
concern, Muller said.
“I don’t see financing to be a material barrier to our ability to execute the project,†Muller said.
Tags: palladium, stocks Posted in All Recent Posts, New Age Metals | Comments Off on New Age Metals Inc. $NAM.ca – Riding the #palladium wave, #Implats to build new mine in 2021 $WG.ca $XTM.ca $WM.ca $PDL.ca $GLEN
Posted by AGORACOM
at 12:20 PM on Friday, March 1st, 2019
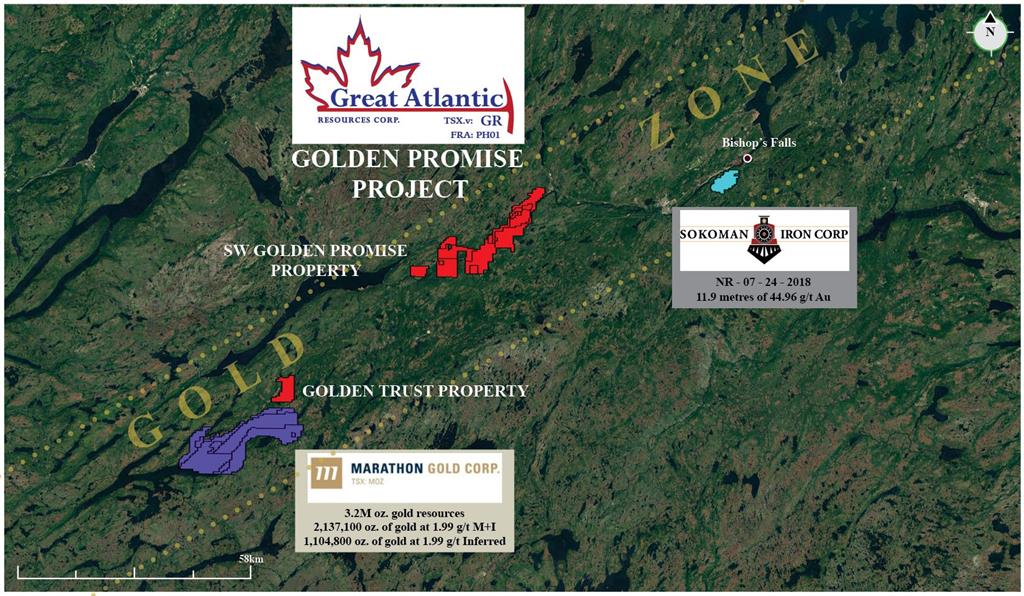
Acquired the Golden Trust Property through staking
1 kilometer north of the Valentine Lake Gold Camp of Marathon Gold Corp.
Golden Trust Property covers an area of 2,400 hectares in a relatively under-explored area of the central Newfoundland gold belt
VANCOUVER, BC / ACCESSWIRE / March 1, 2019 / GREAT ATLANTIC RESOURCES CORP. (TSXV:GR) (the “Company” or “Great Atlantic”) is pleased to announce it has acquired, through staking, the Golden Trust Property, located in the central Newfoundland gold belt and 1 kilometer north of the Valentine Lake Gold Camp of Marathon Gold Corp. has acquired, through staking, the Golden Trust Property (TSXV:MOZ). The Golden Trust Property covers an area of 2,400 hectares in a relatively under-explored area of the central Newfoundland gold belt. Key points for the Golden Trust Property include:
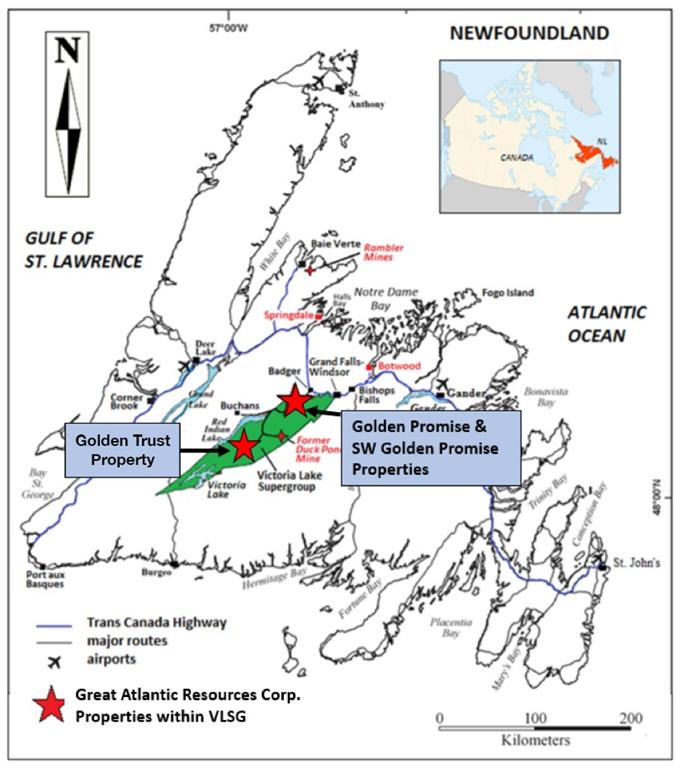
Located
1 km north of the Valentine Lake Gold Camp of Marathon Gold Corp.,
approximately 44 km southwest of Great Atlantic’s Golden Promise
Property and approximately 31 km southwest of the Duck Pond VMS deposit.
Within
the prospective Victoria Lake Supergroup which hosts numerous
epigenetic gold & volcanogenic massive sulfide occurrences
(including Duck Pond VMS deposit).
Within
the Exploits Subzone of the Dunnage Zone and east of the Red Indian
Line (RIL), a major (Appalachian-scale) collisional boundary, and suture
zone.
Government till samples (2008) returned elevated to anomalous values for gold in various regions of the Golden Trust Property.
The
Golden Trust Property occurs within an under-explored area of the
Newfoundland central gold belt. Company management have been unable to
locate any reports of historic diamond drilling within the property.
Till geochemical sampling conducted by the Newfoundland Department of
Natural Resources in 2008 included a small number of wide-spaced samples
within the Golden Trust Property. Samples from various regions of the
property returned elevated to anomalous values for gold including in the
5-9 parts per billion range.
The southern boundary of the
property is located 1 kilometer north of the northeast region of the
Valentine Lake Gold Camp of Marathon Gold Corp. (TSXV:MOZ).
As reported on Marathon’s website, the Valentine Lake Gold Camp
currently hosts four near-surface, mainly pit-shell constrained,
deposits with measured and indicated resources totaling 2,691,400 oz. of
gold at 1.85 g/t gold and inferred resources totalling 1,531,600 oz. of
gold at 1.77 g/t. The Golden Trust Property is located approximately 44
kilometers southwest of Great Atlantic’s Golden Promise Gold Property
which hosts multiple gold bearing quartz vein systems.
The
Company’s Golden Trust and Golden Promise Properties and the Valentine
Lake Gold Camp of Marathon Gold Corp. all occur within the Exploits
Subzone of the Dunnage Zone. The Red Indian Line (RIL), a major
(Appalachian-scale) collisional boundary, and suture zone, forms the
western boundary of the Exploits Subzone.
The Golden Trust
Property occurs within the Victoria Lake Supergroup (VLSG), a
volcano-sedimentary terrane within the Exploits Subzone. The VLSG hosts
numerous volcanogenic massive sulfide (VMS) and epigenetic gold
occurrences. The most significant of the VMS deposits within the VLSG is
the Duck Pond deposit (zinc, lead, copper, silver and gold), located
approximately 31 kilometers northeast of the Golden Trust Property.
Readers
are warned that mineralization at the Valentine Lake Gold Camp, Golden
Promise Property, Duck Pond Deposit and elsewhere within the Exploits
Subzone and VLSG is not necessarily indicative of mineralization within
the Golden Trust Property.
David Martin, P.Geo., a Qualified
Person as defined by NI 43-101 and VP Exploration for Great Atlantic, is
responsible for the technical information contained in this News
Release.
About Great Atlantic Resources Corp.: Great
Atlantic Resources Corp. is a Canadian exploration company focused on
the discovery and development of mineral assets in the resource-rich and
sovereign risk-free realm of Atlantic Canada, one of the number one
mining regions of the world. Great Atlantic is currently surging forward
building the company utilizing a Project Generation model, with a
special focus on the most critical elements on the planet that are
prominent in Atlantic Canada, Antimony, Tungsten and Gold.
On Behalf of the board of directors
“Christopher R Anderson”
Mr. Christopher R. Anderson “Always be positive, strive for solutions, and never give up” President CEO Director 604-488-3900 – Dir
Posted by AGORACOM-JC
at 12:18 PM on Friday, March 1st, 2019
SPONSOR: Esports Entertainment
$GMBL Esports audience is 350M, growing to 590M, Esports wagering is
projected at $23 BILLION by 2020. The company has launched VIE.gg
esports betting platform and has accelerated affiliate marketing
agreements with 190 Esports teams. Click here for more information
GMBL: OTCQB
———————–
Nike Signs Its First Esports Sponsorship Deal
Nike is entering the esports game, following competitors Adidas and Puma into the field.
The global sports brand has signed a four-year deal with China’s League of Legends Pro League, agreeing to supply all squads with clothing and footwear starting this year.
“Since its inception, Nike has always believed that in all sports, a
strong body and will will make athletes better,†the company said in a statement.
“As China becomes a new e-sports cultural center, Nike is pleased to
support the next generation of athletes and establish a long-term
cooperative relationship with e-sports to contribute to the future
development of sports ecology.â€
The league consists of 16 teams and has one of the largest followings
in the world. Fans will also be able to buy Nike-produced products at
live tournaments.
The announcement is Nike’s first formal sponsorship of an esports
team or competition, although the company did feature an esports athlete
in a marketing campaign last year. Financial terms of its esports
contract with the league were not disclosed.
The company is actually a bit late to the competitive video game
world, as Adidas and Puma both already have presences in the field.
Beyond simply supplying clothes and shoes, Nike says it also plans to
work with esports athletes to custom-design training programs to help
them improve.
While they might have been scoffed at initially, esports have become
recognized as a bona fide athletic event in recent years. They were
under consideration at one point for inclusion in the 2024 Olympics
and they will be a medal event in the 2022 Asian Games—a multi-sport
event held every four years among athletes from all over Asia.
Tournaments are regularly aired on ESPN, Turner Broadcasting, Disney and other networks.
Posted by AGORACOM-JC
at 11:20 AM on Friday, March 1st, 2019
Investment Highlights
Kenbridge property has a measured and indicated resource of 7.14 million tonnes at 0.62% nickel, 0.33% copper
17.5 (21.8 fully diluted) percent equity stake in Eloro Resources and 2 percent NSR in their La Victoria property
Kenbridge Ni Project (ON, Canada)
Advanced stage deposit remains open in three directions, is
equipped with a 623m deep shaft and has never been mined.
Preliminary Economic Assessment completed and updated returned robust project economics and operating costs including a NPV of C$253M and cash costs of US$3.47/lb of nickel net of copper credits.
Plans for Kenbridge include updating PEA,
advancing the project through to feasibility and exploring the open
mineralization at depth
FULL DISCLOSURE: Tartisan Nickel Corp. is an advertising client of AGORA Internet Relations Corp.
Posted by AGORACOM-JC
at 10:58 AM on Friday, March 1st, 2019
SPONSOR: ThreeD Capital Inc. (IDK:CSE) Led by
legendary financier, Sheldon Inwentash, ThreeD is a Canadian-based
venture capital firm that only invests in best of breed small-cap
companies which are both defensible and mass scalable. More than just
lip service, Inwentash has financed many of Canada’s biggest small-cap
exits. Click Here For More Information.
——————-
10 Major Blockchain Trends in 2019
While cryptocurrencies took a hammering, 2018 was huge for Blockchain, the technology that underpins Bitcoin and a myriad of other coins.
Blockchain has plenty of use cases outside of the cryptocurrency space with IBM, Oracle, and Amazon and other multi-billion dollar companies trying to capitalize on the disruptive technology.
Now, it’s time to find out what major Blockchain trends will define the current year.  Â
By: Alex Morris Â
From the Internet-of-Things (IoT) convergence to startups for the unbanked — find out what to expect from Blockchain in 2019
While cryptocurrencies took a hammering, 2018 was huge for Blockchain, the technology that underpins Bitcoin and a myriad of other coins. Blockchain has plenty of use cases outside of the cryptocurrency space with IBM, Oracle, and Amazon and other multi-billion dollar companies trying to capitalize on the disruptive technology. Now, it’s time to find out what major Blockchain trends will define the current year.  Â
STOs replacing ICOs
Security tokens (STOs)
have been a hot topic in the crypto space, and it looks like they will
continue to be hot now that Overstock’s tZERO announced the launch of
the new STO platform on Jan. 21. The Blockchain-powered platform will
provide any company with the opportunity to raise funds by launching its
own STOs. Prior to that, the startup made an announcement about the
completion of its utility token distribution.
STOs, which combine the best features of the stock market and
cryptocurrencies, arose as a fully regulated alternative to ICOs, which
turned out to be the passing fad of 2017.
Tokenization creating more investment opportunities
The launch of the Estonia-based DEX,
which buys the shares of the biggest companies in the world in the form
of ERC20 tokens, proved that 2019 is all about tokenization. The
Ethereum-powered startup will allow non-US investors to engage in the US
stock market without any limitations pertaining to their location or
investment amount.
Crypto startup Zilliqa also recently introduced Hg Exchange, a fully regulated exchange that allows accredited investors to buy US stocks.
Tokenization already became a pervasive trend in 2018, going far
beyond the stock market, but this is the year when pretty much
everything will be tokenized – art, wine, real estate, etc.
Blockchain and IoT forming an alliance
Back in January, leading digital security company Gemalto released a report
that states that 23 percent of responders think that Blockchain
technology could be a boon for securing IoT-powered devices. Meanwhile,
almost 91 percent of businesses who do not utilize Blockchain consider
making use of the technology in the future.
The number of IoT-powered devices is expected
to reach 26.66 bln in 2019, but less than half of all businesses can
detect whether their device experienced a security breach.
IBM also illustrated the benefits for this convergence with the help of
their game-changing platform Watson IoT. Apart from bringing more
security to the table, Blockchain significantly simplifies the task of
managing different devices and increases the efficiency of the
transaction.
Wall Street transitioning from dabbling to actions
The fact that cryptocurrency prices took a nosedive in 2018 doesn’t
mean that the global financial industry is going to suddenly give up on
Blockchain. As U.Today reported earlier, Bakkt,
the ICE-backed exchange, was supposed to go live in January, but its
launch was eventually delayed due to the longest government shutdown in
history. Speaking of other ‘big-fish’ players, NASDAQ and the NYSE
plan to launch Bitcoin futures while also being keen on Blockchain.
Since the crypto hub died down, there is a good reason to believe that
2019 will be the year of exciting developments in the Blockchain space.
More decentralized exchanges appearing on the horizon
Decentralized exchanges, while actually living up to Satoshi’s
vision, have numerous usability issues that take a toll on their
popularity. There is no centralized authority that manages the users’
funds, but it’s also a double-edged sword problem – there is no way to
revert a certain transaction if private keys are stolen or lost. Keep in
mind that there are certain degrees of centralization. Case in point:
the Bancor DEX, which suffered from a $13.5 mln hack, though Charlie Lee later claimed that no decentralized exchange can lose its funds.
With that being said, major crypto startups – from Binance to Tron – have launched their own DEXs in order to spearhead the shift towards decentralization in the crypto world.
Governments will continue looking into Blockchain
The wide variety of Blockchain applications are being explored by
governments across the globe (even those ones who are openly hawkish
towards cryptocurrencies). China cracked down on Bitcoin, but this
country is hell-bent on becoming the leader in the Blockchain race.
Shanghai, Guangzhou and other major cities are all supporting Blockchain
developments. As reported by U.Today, the Ministry of Industry and
Information Technology (MIIT) launched
an initiative to incentivize business who are working with the DLT
technology. Moreover, there are specific Blockchain guides in China for
educating government officials.
Estonia is yet another country
that is focused on the e-Estonia program that will digitize the
government. Meanwhile, Dubai could become the very first government that
is powered by Blockchain. The implementation of Blockchain could help Dubai save up to $1.5 bln per year by cutting the red herring and creating a fully paperless government.
Blockchain-powered startups banking the unbanked
Africa, where a substantial part of the population remains unbaked,
represents a breeding ground for different startups that utilize
Blockchain technology in order to increase economic inclusiveness. The Rohingya Project
went even further by using Blockchain to restore the identity of
stateless Rohingyas and give them access to banking services.
Real-word use cases beyond fintech
It is worth noting that Blockchain is the most disruptive technology
of the last decade, but it remains unknown to the general public. Yes,
along with Bitcoin, Blockchain was one of the buzzwords in the tech
space, but it’s all about real-world adoption. According to PwC research,
84 percent of companies have dipped their toes into Blockchain, but
they are not ready to embrace it due to numerous ‘trust issues.’ Those
who will be able to integrate Blockchain into their businesses will turn
out to be the true winners of 2019.
Scalability becoming one of the main issues
Without a doubt, scalability is one of the major bottlenecks of
Blockchain, which poses a major hindrance to mainstream adoption. That
became very evident when CryptoKitties, one of the best-known dApps,
created congestion on the Ethereum network. Bitcoin and Ethereum are
only able to handle seven and 25 TPS (this level of scalability doesn’t
hold a candle to mainstream payment processors in the likes of VISA).
Hence, many promising solutions, such as sharding and sidechains, are expected to be implemented in 2019. Bitcoin’s Lightning Network (LN),
for example, is witnessing growing popularity with major industry
players, with an eye-popping 830 percent surge in half a year. LN will
significantly boost Bitcoin adoption while solving scalability pain
points.
Blockchain jobs will become more common
Despite Bitcoin, the major use case of Blockchain, taking a hammering
in 2018, the number of Blockchain-related jobs continued to grow
throughout the year. Moreover, as reported by CNBC,
the salaries of Blockchain engineers skyrocketed to $175,000 per year,
which means that they receive the highest salaries in the software
development niche on par with AI specialists. According to Hired CEO
Mehul Patel, ‘there’s a ton of demand for Blockchain.’ On top of that,
Upwork, the leading freelance platform, had a 35,000 percent uptick in
the number of Blockchain freelancers (it’s the fastest-growing freelance
sector).
However, earning a six-figure salary is not an easy feat. Blockchain developers
have to code in numerous languages, including Go and Solidity. As
mentioned above, major companies do not want to miss the boat on
Blockchain, so they are striving to hire talented programmers.
Posted by AGORACOM
at 8:30 AM on Friday, March 1st, 2019
The recently completed drilling in phase 2 identified a series of 30 epithermal veins
Approximately 1000m to the northeast, the SG3 Target area, is a structural intersection mapped and sampled by the geological survey of Mexico which is a feeder system type target.
Now that we have established that there is a large cluster of epithermal veins at Tabasquena, we are also eager to explore for feeder system type targets. Our plan to drill deeper into the vein system to look for the boiling point in our epithermal veins
About Advance Gold Corp. (TSXV: AAX)
Advance Gold is a TSX-V listed junior exploration company focused on
acquiring and exploring mineral properties containing precious metals.
The Company acquired a 100% interest in the Tabasquena Silver Mine in
Zacatecas, Mexico in 2017, and the Venaditas project, also in Zacatecas
state, in April, 2018.
The Tabasquena project is located near the Milagros silver mine near
the city of Ojocaliente, Mexico. Benefits at Tabasquena include road
access to the claims, power to the claims, a 100-metre underground shaft
and underground workings, plus it is a fully permitted mine.
FULL DISCLOSURE: Advance Gold is an advertising client of AGORA Internet Relations Corp.
For further information, please contact: Allan Barry Laboucan, President and CEO Phone: (604) 505-4753 Email: [email protected]