Posted by AGORACOM-JC
at 1:07 PM on Wednesday, February 27th, 2019
SPONSOR: Enthusiast Gaming Holdings Inc.
(TSX-V: EGLX) Uniting gaming communities with 80 owned and affiliated
websites, currently reaching over 75 million monthly visitors. The
company partial 2018 reported revenue of $7.4 million representing a
625% increase over the same period in 2017.
EGLX: TSX-V ———————————-
G2 Esports raises $17.3 million for global growth and further investment
Competitive gaming firm G2 Esports has raised $17.3 million.
In a blog post, the esports organisation confirmed it had closed out the latest round of funding, bringing its total investment to $24.5 million to date.Â
G2 Esports owns 11 teams across various competitive games, including
Counter-Strike, League of Legends, Hearthstone and Playerunknown’s
Battlegrounds.
The investment was headed up by New York private equity firm Seal
Rock Partners, with participation from Everblue Management. G2 Esports
stated that it plans to use the funds to push ahead with global
expansion, pay franchise fees and further its own business and content
investments.
“After an incredibly successful 2018 where we positioned ourselves as
one of the leading entertainment assets in esports, G2 is doubling down
on international growth and continuing our investment in world-class
content creation,†said co-founder and CEO Carlos Rodriguez said.
“We have partnered with the right investors, who have a deep
understanding of a variety of entertainment industries, and significant
experience in scaling successful companies and brands.â€
Posted by AGORACOM-JC
at 11:39 AM on Wednesday, February 27th, 2019
Announcement today is as a result of a step by step study which was performed to investigate the effect production yield has on the purity of silicon end-product.
Theoretical calculations which were obtained in the previous phase were also validated
In conclusion, it was found that higher production yields actually enhance end-product purity, which confirms our previous calculations.
MONTREAL, Feb. 27, 2019 – PyroGenesis Canada Inc. (http://pyrogenesis.com) (TSX-V: PYR), (the “Company”, the “Corporation†or “PyroGenesis”) a Company that that designs, develops, manufactures and commercializes plasma atomized metal powder, plasma waste-to-energy systems and plasma torch products, announces today its latest testing results for PUREVAP™ Gen2, and provides a general update on its PUREVAP™ Project with HPQ Silicon Resources Inc (“HPQâ€).
This announcement today is as a result of a step by step study which
was performed to investigate the effect production yield has on the
purity of silicon end-product. Theoretical calculations which were
obtained in the previous phase were also validated. In conclusion, it
was found that higher production yields actually enhance end-product
purity, which confirms our previous calculations. Specifically, the
results of this extrapolation calculation indicate that a higher
production yield will enhance the final silicon purity, reaching 99.993%
(+4N) at 90% production yield.
Mr. P. Peter Pascali, President and CEO of PyroGenesis, provides this
update on PUREVAP™ in the following Q&A format. The questions, for
the most part, are derived from inquiries received from investors, and
analysts:
Q. For those that are new to the story, could you please provide an overview of the project and technology?
A. Most certainly.
HPQ is the owner of quartz properties. Quartz can be processed,
through multiple steps, into a high purity silicon metal which is an
important element in solar panels. It helps convert solar energy into
useful electricity. Many in the solar panel industry consider the cost
of converting quartz into solar grade silicon metal to be a limiting
factor in the growth of the solar panel industry.
PyroGenesis was first engaged by HPQ to demonstrate, on a laboratory
scale, that its proprietary PUREVAPTM process could produce high purity
silicon metal from quartz in just one step.
This could be significant to the solar panel industry since the
industry is highly dependent on high purity silicon metal in its solar
panels. Any reduction in the cost of high purity silicon metal would
benefit the industry as a whole, and if significant, could be game
changing.
The primary goal of the PUREVAP™ process is to reduce (i) capital
costs, and (ii) operating costs in the production of high purity silicon
metal. A side benefit of the PUREVAP™ process is that, at the same
time, it can replace polluting conventional processes, with a cheaper
and environmentally friendly alternative by reducing the carbon
footprint of current silicon metal production methods.
Specifically, PUREVAP™â€™s current targets are as follows:
Reduce CAPEX to transform quartz to solar grade silicon by between 60% (China) and 86% (“Rest of the World†or “ROWâ€);
Reduce OPEX to transform quartz to solar grade silicon by between 30% (China) and 60% (ROW);
Reduce carbon footprint to transform quartz to solar grade silicon by up to 96%;
Investigate new opportunities for high value niche applications that could also benefit from cheap high purity silicon.
Q. Where do we stand with the technology?
A. Let us first review the question in the context of what we have achieved to date:
We started this project in early 2016, a little over 2 years ago. By
June 2016, we had already demonstrated PUREVAP™â€™s ability to transform
quartz into high purity silicon metal exceeding 99.9+%, or 3N (3N
reflects 99.9% or 3 Nines). Before moving on let me put 3N in the
context of what we are trying to achieve:
Purity
Grade
Applications
Market Size
98.5-99.5% (1N-2N)
Metallurgical Grade
Feedstream to electronic and solar grade Silicon production
Additive for aluminum alloys
Feedstream to making fumed silica, silanes and silicone
> 2.2M T/yr
99.9 – 99.99% (3N-4N)
High Purity & Special Grade
Powders for batteries
SiAl targets for the glass industry
Industrial quality Si3N4
> 220 kT/yr
> 99.999% (5N+)
Solar Grade
Solar cells
> 400 kT/yr
Table 1
The potential uses of high purity silicon metal is depicted on Table 1
above. This market is typically divided into three broad grades:
Metallurgical Grade (1N-2N), High Purity & Special Grade (3N-4N),
and Solar grade (5N+).
One can see that 3N silicon metal addresses a significant market. As
we are developing a process to produce solar grade silicon metal, we
have discovered a way to produce 3N. To do so on a commercial basis
opens up another revenue stream, and effectively reduces project risk.
Once we demonstrated the ability to transform quartz into high purity
silicon metal, we next needed to demonstrate scalability. This we did
by the beginning of 2017. By this time, we had demonstrated scalability
of the process by increasing production from 1.1g to 8.8g of material.
Later in 2017, by Q3, we estimated that silicon production yield played
an important role on the final purity of the metal produced; PyroGenesis
theoretical calculations, assuming a 100% production yield, concluded
that the purity of the silicon produced, under various operational
conditions could, at commercial scale, range from 3N (99.984 % Si) to 4N
(99.996 % Si) for low purity feedstock, and to 4N+ (99.998 % Si) when
using high purity feedstock. Recent Gen2 tests reported not only confirm
these results, but exceed them and, as such, our baseline has now moved
from 3N+ to 4N+ which, it and itself, is quite noteworthy.
Q. What is the next step?
A. The next step will be the pilot plant where we
expect to produce silicon metal based on the results developed during
the GEN1 and GEN2 lab phase tests.
We are currently designing and building a 50 tonnes per year (TPY)
pilot plant to produce larger quantities of 4N+ silicon, which will then
be upgraded to solar grade silicon, with the ultimate goal of producing
test solar cells. We expect the pilot plant to be completed within the
next two quarters.
Q. Ok, but 4N is still not solar grade. How do you think you can achieve solar grade?
A. This is the interesting part, and one I don’t
think the market fully understands. We are still targeting 6N as our
ultimate goal however, in the interim, HPQ has identified a faster route
to market by the addition of Apollon Solar (“Apollonâ€). Apollon is a
private French company with longstanding expertise in Silicon
Purification and Crystallisation, Solar Silicon, Photovoltaic Cells and
Photovoltaic Modules. Simply put, Apollon is one of the world’s leaders
in renewable energies, and has an expertise in purifying/upgrading high
purity silicon metal even further to obtain solar grade silicon. Of
note, they also have an expertise in producing solar cells. This is a
huge addition to the PUREVAP™ process because it essentially means that
on the way to target 6N, we can use a lower level of purity which could
be further upgraded with Apollon’s expertise, thereby further reducing
overall project risk. In short, the time to market has been
significantly reduced with the addition of Apollon.
Q. What does this mean for PyroGenesis?
A. We are not a charity. We deploy assets for the
benefit of our shareholders, for whom there are many advantages with our
contractual relationship with HPQ. First, we are currently under
contract with HPQ to deliver and operate the pilot plant. Second, we are
entitled to a 10% royalty on all future silicon metal sales. Third, we
have a right of first refusal on the next phases of the project, the
first of which would be a commercial plant at 5,000 TPY (which is
expected to be ordered shortly after the pilot phase). Finally, we
retain the right to use the technology for other applications other than
the conversion of quartz to silicon, opening up new markets and
opportunities for PyroGenesis.
In short, this project is very meaningful to PyroGenesis and its shareholders.
Q. What are the next milestones?
A. These latest results were what we needed before
going flat out with the completion of the installation and commissioning
of the pilot system, which will be the next real milestone. It is
expected that the output from this system will be upgraded by Apollon to
solar grade material which will then be used to produce test solar
cells. We expect to produce our first solar cells made using PUREVAP™
sometime late 2019/early 2020. Shortly after that, a full commercial
plant will be commissioned.
Q. Are there any risks?
A. There are always risks with R&D, as you know,
and there is never a guarantee of success. However, if you ask me
generally about the risk of this project, I can tell you with 100%
certainty that the risks have been significantly reduced in our favor
since we started. We have considerably de-risked the project by doing
extensive tests on GEN1 and further validating our scale-up assumptions
with GEN2. We have gained invaluable experience with GEN2 which we have
implemented in the design of the pilot plant.
Of note, something else the market has not fully understood is that
along the way, we believe we have identified possible commercial uses
for the 3N+ material itself which, as I noted earlier, opens up new
commercial applications, and further reduces project risk.
Q. Do you still feel this technology will work?
A. I have said this before and I will say it again,
PyroGenesis does not have time or money to waste on projects that do not
have future potential. Each and every day PyroGenesis has to decide
where to allocate its resources, the most important of which is its
time. Plasma expertise, such as ours, does not grow on trees and we must
be very discerning as to where we dedicate this valuable resource. Do
we dedicate it to Additive Manufacturing (powders for 3D printers),
DROSRITETM, other development projects…or HPQ? The profit from the HPQ
relationship does not, in and of itself, justify dedicating such scarce
resources to the project. However, the royalty from the success of the
project, does.
So, to answer your question, yes, we are fully committed to its
technology, and believe more than ever before that it will be game
changing in its own right.
Talk is cheap, but as you can see, we currently hold over 21M common
shares plus over 17M warrants in HPQ. You can’t get more committed than
this.
Q. What would you advise investors?
A. Do your due diligence. Invest with full understanding, and…follow the money.
PyroGenesis Canada Inc., a TSX Venture 50® high-tech company, is the world leader in the design, development, manufacture and commercialization of advanced plasma processes and products. We provide engineering and manufacturing expertise, cutting-edge contract research, as well as turnkey process equipment packages to the defense, metallurgical, mining, advanced materials (including 3D printing), oil & gas, and environmental industries. With a team of experienced engineers, scientists and technicians working out of our Montreal office and our 3,800 m2 manufacturing facility, PyroGenesis maintains its competitive advantage by remaining at the forefront of technology development and commercialization. Our core competencies allow PyroGenesis to lead the way in providing innovative plasma torches, plasma waste processes, high-temperature metallurgical processes, and engineering services to the global marketplace. Our operations are ISO 9001:2015 certified, and have been since 1997. PyroGenesis is a publicly-traded Canadian Corporation on the TSX Venture Exchange (Ticker Symbol: PYR) and on the OTCQB Marketplace. For more information, please visit www.pyrogenesis.com.
This press release contains certain forward-looking statements,
including, without limitation, statements containing the words “may”,
“plan”, “will”, “estimate”, “continue”, “anticipate”, “intend”,
“expect”, “in the process” and other similar expressions which
constitute “forward- looking information” within the meaning of
applicable securities laws. Forward-looking statements reflect the
Corporation’s current expectation and assumptions and are subject to a
number of risks and uncertainties that could cause actual results to
differ materially from those anticipated. These forward-looking
statements involve risks and uncertainties including, but not limited
to, our expectations regarding the acceptance of our products by the
market, our strategy to develop new products and enhance the
capabilities of existing products, our strategy with respect to research
and development, the impact of competitive products and pricing, new
product development, and uncertainties related to the regulatory
approval process. Such statements reflect the current views of the
Corporation with respect to future events and are subject to certain
risks and uncertainties and other risks detailed from time-to-time in
the Corporation’s ongoing filings with the securities regulatory
authorities, which filings can be found at www.sedar.com, or at www.otcmarkets.com. Actual
results, events, and performance may differ materially. Readers are
cautioned not to place undue reliance on these forward-looking
statements. The Corporation undertakes no obligation to publicly update
or revise any forward- looking statements either as a result of new
information, future events or otherwise, except as required by
applicable securities laws. Neither the TSX Venture Exchange, its
Regulation Services Provider (as that term is defined in the policies of
the TSX Venture Exchange) nor the OTCQB accepts responsibility for the
adequacy or accuracy of this press release.
Posted by AGORACOM
at 10:48 AM on Wednesday, February 27th, 2019
Test work is being carried out as part of the Company’s market development strategy with the goal of utilizing the tailings as a partial cement replacement
Early results show promise and if successful would reduce tailings disposal costs and create a potential by-product revenue stream
Research tailings material was successfully tested as a partial cement replacement, using 10 and 20 percent of a cement mixture with ZEN’s tailings material.
After 28 days, the results showed the 10% replacement had a compressive strength rating of 46.1 MPa, less than a 2% difference from the control at 47 MPa.
The 20% replacement had a compressive strength rating of 37.9 MPa, about 20% difference with the control sample.
These highly encouraging initial and unoptimized results show significant promise for ZEN to push forward with further development work.
Posted by AGORACOM-JC
at 10:32 AM on Wednesday, February 27th, 2019
SPONSOR: New Age Metals Inc.
(TSX-V: NAM) The company’s new Lithium Division has already made
significant acquisitions in Canada and the USA. The company also owns
one of North America’s largest primary platinum group metals deposit in
Sudbury, Canada. Learn More.
NAM: TSX-V
———————
Palladium: The most precious of precious metals
For the first time in more than a decade, palladium is rivalling gold in value.
At its current spot price of just over US$1 300/oz, reaching as high
as $1 400/oz in January 2018, it has truly become the most precious of
the precious metals, writes CHANTELLE KOTZE.
Demand has been primarily driven by the automotive industry through the “demonisation” of diesel engines in Europe.
The resultant growth in small petrol engines and hybrid engines,
which are fitted with emission-reducing catalytic converters that
require it as a catalyst to control pollution, along with the shift away
from diesel engines, has benefitted the material.
Moreover, the Volkswagen emissions scandal has negatively impacted the European diesel market and platinum prices.
According to Michael Jones, the President and CEO of TSX-listed
Platinum Group Metals, the developer of the Waterberg palladium-dominant
project in South Africa, it has become apparent that the electric
vehicle revolution has been a major factor driving demand.
While adoption rates of electric vehicles are expected to increase
anywhere between 8% and 10% by 2023, Jones stresses the importance that
at least half of these new electric vehicles will be hybrid electric
vehicles as opposed to full electric vehicles and will therefore still
require the use of palladium in the catalytic converter.
Moreover, China’s tougher new vehicle emissions standard, the China
VI emission standard, released in June 2018, means that cars will
require more robust catalytic converters that are able to meet the new
emissions legislation – another factor that may require increased
palladium during manufacture in order to minimise emissions.
According to data from German chemicals giant BASF, the China VI
emission standards is expected to create an additional 1 Moz of
palladium demand annually by 2020, which Jones believes the market is
already experiencing.
From the 2.2 Moz of palladium estimated to be required in the
manufacture of Chinese cars in 2018, palladium demand is estimated to
grow to 3.1 Moz by 2020, says BASF.
These figures are not based on the amount of new vehicles, but rather
the impact of the change in the standard for emissions which will
require increased amounts of palladium in its manufacture to ensure the
longevity of the catalyst.
While Jones notes that this may cause car manufacturers to substitute
out of palladium back into platinum as a cheaper alternative, it may
take several years for this change to come into effect and have a
physical impact on the price of palladium.
This being said, palladium is also a much more attractive metal for
autocatalysis, particularly in hybrid (petrol) electric vehicles, he
adds.
Moreover, with palladium being relatively rare, mined mainly as a
by-product of nickel and platinum mining, it may take a while for demand
fundamentals to slow should catalytic converter demand slow, says
Jones.
This increasing demand, combined with constrained long-term supply,
has caused a deficit in palladium supply which has been the key driver
in palladium’s high prices – a price trend which experts expect to
continue.
Despite weakening automotive sales in key markets, stringent
emissions controls are expected to sustain demand as governments seek to
improve their emissions targets.
Jones expects this demand to continue well into the foreseeable future due to tight supply.
Posted by AGORACOM-JC
at 10:01 AM on Wednesday, February 27th, 2019
SPONSOR: ThreeD Capital Inc. (IDK:CSE) Led by
legendary financier, Sheldon Inwentash, ThreeD is a Canadian-based
venture capital firm that only invests in best of breed small-cap
companies which are both defensible and mass scalable. More than just
lip service, Inwentash has financed many of Canada’s biggest small-cap
exits. Click Here For More Information.
——————-
Blockchain Fund Launches With $22 Million Round Backed By Roger Ver
Switzerland-based Pangea Blockchain Fund is making its debut after closing a $22 million seed round backed by crypto investor Roger Ver.
Announcing the news on Wednesday, Pangea said other investors in the round included Copernicus Asset Management, a Swiss firm regulated by the country’s Financial Market Supervisory Authority. Copernicus is also acting as investment manager for the fund.
Pangea will invest in “transformative†blockchain startups around the
world to provide them with an early-stage capital boost and other
resources. The aim is to focus on the “commercial and industrial
applications†of blockchain technology, and there are no plans to invest
in cryptocurrency, the fund said.
The fund’s Swiss investment advisor is Blockchain Investment Advisory
Sagl, while U.S.-based Blockchain Investment Advisory LLC is acting as
sub-advisor. Pangea expects to cap its fundraising at $200 million.
James Duplessie, co-founder of Blockchain Investment Advisory Sagl,
said he believes blockchain technology will “fundamentally alter the way
society collaborates, transacts, governs and brings new concepts to
life.â€
He continued:
“Blockchain technology has the potential to change the nature of the
systems that lie beneath the things we do every day and could be the
greatest driver of value creation in our lifetime.â€
Maggie Rokkum-Testi, chief investment officer of Copernicus Asset
Management, added that the use cases for “a transparent, verifiable
register of data transactions are endless.â€
Blockchain Investment Advisory Sagl will also launch a Swiss-based incubator to be called Ticino Labs in the coming months.
Tags: blockchain, tsx Posted in ThreeD, ThreeD Capital | Comments Off on ThreeD Capital Inc. $IDK.ca – Blockchain Fund Launches With $22 Million Round Backed By Roger Ver $HIVE.ca $BLOC.ca $CODE.ca
Posted by AGORACOM
at 9:57 AM on Wednesday, February 27th, 2019
Received all analytical results from the 2018 exploration program at its Golden Promise Property, located in the central Newfoundland gold belt
The results identified additional exploration targets where no prior drilling has taken place
VANCOUVER, BC / ACCESSWIRE / February 27, 2019 / GREAT ATLANTIC RESOURCES CORP. (TSXV.GR) (the “Company” or “Great Atlantic”) is pleased to announce it has received all analytical results from the 2018 exploration program at its Golden Promise Property, located in the central Newfoundland gold belt, the results identifying additional exploration targets. The 2018 soil and rock analytical results confirm gold soil anomalies +/- rock samples anomalous in gold in at least three additional target areas in under-explored regions of the property. The Company’s main focus on the property remains the Jaclyn Zone where multiple gold bearing quartz vein systems occur. Gold bearing veins and gold bearing quartz vein boulders occur in other regions of the property.
Anomalous 2018 rock and soil samples were concentrated in three new targets areas:
Southwest
region: Anomalous soil samples along two reconnaissance soil lines, up
to 77 ppb gold (News Release of September 27, 2018). All 11 samples
along one 570- meter long line returned anomalous gold values. Rock
samples within the soil anomaly retuned anomalous gold values including
1.04 g/t gold.
East-Central region:
Anomalous soil samples (up to 39 ppb gold) & rock float samples (up
to 136 ppb gold) along a reconnaissance traverse.
West-Central
region: Anomalous soil samples (up to 41 ppb) following up in an area
of 2017 soil anomalies (212 and 236 ppb gold).
No previous drilling in the new target areas.
The
2018 program was reconnaissance in nature consisting of prospecting and
soil / rock geochemical sampling in multiple under-explored regions of
the Golden Promise Property. Multiple gold soil anomalies were
identified in the southwest, west-central and east-central regions of
the property, thereby adding to the number of gold targets within the
property. Rock grab samples from float in the east-central and southwest
regions of the property returned anomalous values for gold, the high
value being 1.04 g/t gold.
Soil sample analytical results from the
southwest region of the Golden Promise Property were reported in the
Company’s News Release of September 27, 2018. The
results include anomalous gold in soil samples from a new target area in
this southwest region. The majority of soil samples from two
reconnaissance lines in this target area returned anomalous values for
gold (up to 77 parts per billion (ppb) gold) including all 11 samples
from one approximately 570-meter long line. Nine of the 2018 rock grab
samples (float and outcrop) from this anomalous zone returned anomalous
gold values, the high value being a boulder sample with quartz veins
returning 1.04 g/t gold.This anomalous zone is
approximately 4 kilometers northeast of the Linda / Snow White gold
bearing vein which is located within the southwest region of the
property. Reported historic highlights for the Linda / Snow White vein
include a 232 g/t gold grab sample, 29.7 g/t gold over 0.5 meters in a
channel sample and 19.5 g/t gold over 1.15 meters during diamond
drilling (core length).
Quartz boulder in new southwest target area
The
2018 program confirmed an area of gold soil anomalies in the
west-central region of the property. Initial reconnaissance soil
sampling by the Company in this region during 2017 identified gold
anomalies (including samples returning 212 and 236 ppb gold). Soil
sampling in this area was continued during 2018 along 2 north-south
lines. Six of seven soil samples from an approximately 300-meter long
section of one line returned anomalous values for gold in the 8-41 ppb
gold range, confirming this new target area. This zone of gold soil
anomalies is located approximately 1 kilometer northwest of the gold
bearing Shawn’s Shot quartz vein. A 0.32-meter long chip sample
collected by the Company across the Shawn’s Shot vein in 2017 returned
48.2 g/t gold (News Release of August 28, 2017).
The 2018 program
established a new gold target area in the east-central region of the
property. Prospecting and soil sampling were conducted along one
east-west reconnaissance line in this region. Approximately 25% of the
soil samples along an approximately 2-kilometer section of this line
returned anomalous values for gold (6-39 ppb gold). Rock samples from
quartz boulders in this region returned anomalous values for gold (up to
136 ppb gold). The target area is approximately 2.2 kilometers
south-southwest of the gold bearing Jaclyn Main Zone. The Jaclyn Main
Zone has been the primary focus of historic gold exploration on the
property.
The Company recently reported a National Instrument
43-101mineral resource estimate for the Jaclyn Main Zone, located in the
northern region of the property (News Release of December 6, 2018; and
Sedar-filed National Instrument 43-101 Technical Report on the Golden
Promise Property, Central Newfoundland (revised), dated December 4, 2018
by Mr. Greg Z. Mosher, M.Sc. App., P.Geo., and Mr. Larry Pilgrim,
B.Sc., P.Geo.). The reported inferred mineral resource estimate for the
Jaclyn Main Zone is as follows:
Resource
Cutoff Au g/t
Au Cap g/t
Au Uncap g/t
Tonnes
Au Ounces Capped
Au Ounces Uncapped
Total
1.1
9.3
10.4
357,500
106,400
119,900
Pit-Constrained
0.6
11.4
14.1
157,300
57,800
71,200
Underground
1.5
7.5
7.6
200,200
48,600
48,700
Mineral Resources are not Mineral Reserves and do not have demonstrated economic viability.
There is no certainty that all or any part of the Mineral Resources estimated will be converted into Mineral Reserves.
Mineral
resource tonnage and contained metal have been rounded to reflect the
accuracy of the estimate, and numbers may not add due to rounding.
Mineral resource tonnage and grades are reported as undiluted.
Contained Au ounces are in-situ and do not include recovery losses
The
Jaclyn Main Zone is part of the Jaclyn Zone. At least 5 gold bearing
quartz vein systems are reported at the Jaclyn Zone, including the
Jaclyn Main Zone, Jaclyn North Zone, Jaclyn South Zone, Jaclyn East Zone
and Jaclyn West Zone. Much of the reported historical exploration
within the property has been focused on the Jaclyn Zone with the
majority of historic drill holes (2002-2010) at the Jaclyn Main Zone.
Other gold bearing veins within the property include Shawn’s Shot, Linda
/ Snow White and at the Gabbro Occurrence. High grade quartz boulders
are reported within the property including at the Jaclyn Zone and
Branden and Justin’s Hope boulder occurrences.
The property is
located within the Exploits Subzone of the Newfoundland Dunnage Zone.
Within the Exploits Subzone, the property lies along the
north-northwestern fringe of the Victoria Lake Supergroup (VLSG), a
volcano-sedimentary terrane. The northwestern margin of the Golden
Promise Property occurs proximal to, and, in part, contiguous with a
major (Appalachian-scale) collisional boundary, and suture zone, known
as the Red Indian Line (RIL). The RIL forms the western boundary of the
Exploits Subzone. Recent significant gold discoveries in this region of
the Exploits Subzone include those of Sokoman Iron Corp. (TSXV.SIC) at the Moosehead Project and Marathon Gold Corp. (TSXV.MOZ) at the Valentine Lake Gold Camp.
Sokoman Iron Corp. (TSXV.SIC) recently
announced a high-grade gold discovery on its Moosehead Property,
located approximately 40 kilometers east-northeast of the Golden Promise
Property. The discovery was made during the 2018 diamond drilling
program. A drill intersection of 44.96 g/t gold over 11.90 meters core
length was reported including a 1.35 meters core length quartz vein
intersection of 385.85 g/t gold (Sokoman Iron Corp. News Release of July
24, 2018). The Valentine Lake Gold Camp of Marathon Gold Corp. (TSXV.MOZ) is
located approximately 55 kilometers southwest of the Golden Promise
Property. As reported on Marathon’s website, the Valentine Lake Gold
Camp currently hosts four near-surface, mainly pit-shell constrained,
deposits with measured and indicated resources totaling 2,691,400 oz. of
gold at 1.85 g/t gold and inferred resources totalling 1,531,600 oz. of
gold at 1.77 g/t. Readers are warned that mineralization at the
Moosehead Property and Valentine Lake Gold Camp is not necessarily
indicative of mineralization on the Golden Promise Property.
As
reported in the National Instrument 43-101 Technical Report on the
Golden Promise Property, Central Newfoundland (revised), dated December
4, 2018 by Mr. Greg Z. Mosher, M.Sc. App., P.Geo., and Mr. Larry
Pilgrim, B.Sc., P.Geo., the Jaclyn Main Zone was modelled as a single
quartz vein that strikes east-west and dips steeply to the south.
Modelled vein thickness was based on true thickness derived from quartz
vein intercepts. The estimate is based on 220 assays that were
composited to 135 one-meter long composites. A bulk density of 2.7 g/cm3
was used. Blocks in the model measured 15 meters east-west, 1-meter
north-south and 10 meters vertically. The block model was not rotated.
Grades were interpolated using inverse-distance squared (ID2) weighting
and a search ellipse that measured 100 meters along strike, two meters
across strike and 50 meters vertically. Grades were interpolated based
on a minimum of two and a maximum of 10 composites with a maximum of one
composite per hole so the grade of each block is based on at least two
drillholes thereby demonstrating continuity of mineralization. For the
capped mineral resource estimate, all assays that exceed 65 g/t gold
were capped at 65 g/t gold. All resources were classified as Inferred
because of the relatively wide spacing of drill holes through most of
the zone.
Because part of the vein is near surface the resource
estimate was constrained by a conceptual open pit to demonstrate
reasonable prospects of eventual economic extraction. Generic mining
costs of US$2.50/tonne and processing costs of US$25.00/tonne were used
together with a gold price of US$1,300/ounce. A conceptual pit slope of
45° was assumed with no allowance for mining loss or dilution. Based on
the combined hypothetical mining and processing costs and the assumed
price of gold, a pit-constrained cutoff grade of 0.6 g/t was adopted.
For the underground portion of the resource a cutoff of 1.5 g/t was
assumed. The cutoff grade for the total resource is the weighted average
of the pit-constrained and underground cutoff grades.
The
2018 rock and soil samples were analyzed by Eastern Analytical Ltd. in
Springdale, NL for gold by Fire Assay and for 34 elements by ICP. A
qualified person managed and conducted the 2018 exploration program.
Readers
are warned that historical records referred to in this News Release
have been examined but not verified by a Qualified Person. Further work
is required to verify that historical records referred to in this News
Release are accurate.
David Martin, P.Geo., a Qualified Person as
defined by NI 43-101 and VP Exploration for Great Atlantic, is
responsible for the technical information contained in this News
Release.
About Great Atlantic Resources Corp.: Great
Atlantic Resources Corp. is a Canadian exploration company focused on
the discovery and development of mineral assets in the resource-rich and
sovereign risk-free realm of Atlantic Canada, one of the number one
mining regions of the world. Great Atlantic is currently surging forward
building the company utilizing a Project Generation model, with a
special focus on the most critical elements on the planet that are
prominent in Atlantic Canada, Antimony, Tungsten and Gold. On Behalf of the board of directors
“Christopher R Anderson“
Mr. Christopher R. Anderson “Always be positive, strive for solutions, and never give up” President CEO Director 604-488-3900 – Dir
Posted by AGORACOM
at 8:33 AM on Wednesday, February 27th, 2019
JV partner Tudor Gold has updated information from the southern part of the Goldstorm Zone on the Treaty Creek property in the Golden Triangle
Significant horizons of stronger gold mineralization occur in a thick envelope of low-grade gold mineralization throughout the entire Goldstorm Zone.
Within the low-grade mineralized body, near-surface horizons of stronger gold grades occur.
CB-17-24 interval averages 0.945 g/t Au over 213.0 meters,including the core of the zone that averages 1.925 g/t Au over a 60 meter interval.
Cardston, Alberta–(Newsfile Corp. – February 27, 2019) – American Creek Resources Ltd. (TSXV: AMK) (the “Company”)is
pleased to announce that JV partner Tudor Gold has updated information
from the southern part of the Goldstorm Zone on the Treaty Creek
property in the Golden Triangle region of British Columbia. New
composites from drill holes completed during 2017 and 2018 demonstrate
that significant horizons of stronger gold mineralization occur in a
thick envelope of low-grade gold mineralization throughout the entire
Goldstorm Zone.
Within
the low-grade mineralized body, near-surface horizons of stronger gold
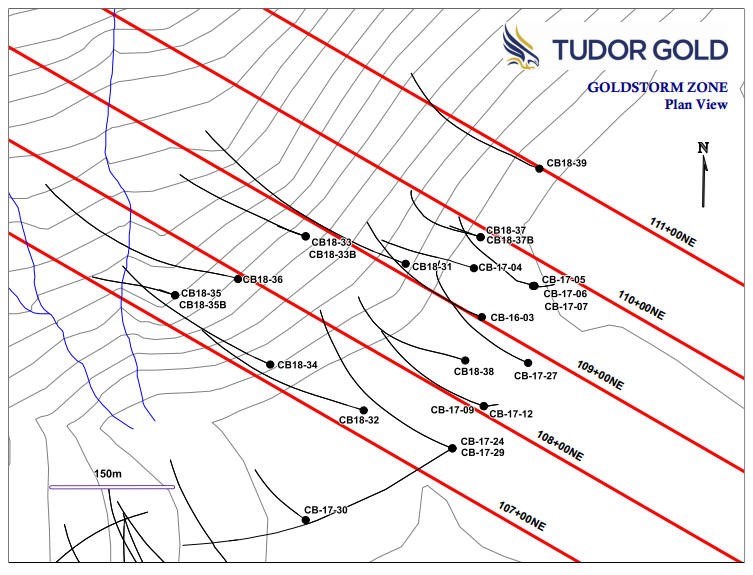
grades occur. The southernmost drill section, 107+00 NE (attached below)
demonstrates that the Goldstorm Zone contains a higher grade gold
interval at its eastern near-surface projection in hole CB-17-24. This
enriched gold interval averages 0.945 g/t Au over 213.0 metersincluding the core of the zone that averages 1.925 g/t Au over a 60 meter interval.
Similarly, the upper part of the gold intercepts in holes CB18-32 and
CB18-34 also demonstrate that the stronger gold mineralization occurs in
the upper portion of each intercept. The following table gives gold
composites from the three drill holes on Section 107+00 NE that cut the
Goldstorm Zone.
To view an enhanced version of this graphic, please visit: https://orders.newsfilecorp.com/files/682/43074_39f1da8cb467c8d9_001full.jpgTudor
Gold Exploration Manager Ken Konkin stated: “We consistently see thick,
low-grade gold intercepts that contain distinct horizons of stronger
gold mineralization throughout the entire Goldstorm Zone. Our
preliminary petrographic studies confirm that gold mineralization is
associated with multiple pulses of disseminated and veinlet pyrite
emplacement. These events were then over-printed and mineralized by
late-stage, steep-angled, quartz-calcite-pyrite veinlets that contain
native gold. The hanging wall of the Goldstorm Zone is well defined by a
sharp fault contact. This appears to be a moderately dipping regional
thrust fault similar to the orientation and nature of the Sulphurets
Thrust Fault hanging wall contact at Seabridge’s Iron Cap deposit,
located five kilometers to the southwest.” Goldstorm
extends for at least 500 meters along a northeastern strike and is open
to the east, north and down dip. A drill plan map showing the locations
of drill hole collars and section lines is included below in the
attached Section 107+00NE. Drill hole CB18-35B stopped within the fault
zone and therefore did not penetrate the gold zone. In the following
weeks, geologists will be planning an aggressive diamond drill hole
program for the 2019 exploration season in order to fast-track the
advancement of the Treaty Creek Project. Tudor
Gold will be displaying core samples and drill sections at booth #3314
at the Prospectors and Developers Association of Canada convention in
Toronto March 3-6, 2019.
To view an enhanced version of this graphic, please visit: https://orders.newsfilecorp.com/files/682/43074_39f1da8cb467c8d9_003full.jpgQA/QCIn
2016 and 2017, drill core samples were prepared and analyzed at
Activation Laboratories Ltd. in Kamloops, BC. In 2018, drill core
samples were prepared ALS Global’s Preparation Laboratory in Terrace, BC
and assayed at ALS Global’s Geochemical Laboratory in North Vancouver,
BC. Analytical accuracy and precision are monitored by the submission of
blanks, certified standards and duplicate samples inserted at regular
intervals into the sample stream by Tudor Gold personnel. Activation
Laboratories and ALS Global Laboratories quality systems comply with the
requirements for the International Standards ISO 17025: 2005. QP The
Qualified Person for this new release for the purposes of National
Instrument 43-101 is Tudor Gold’s Exploration Manager, Ken Konkin,
P.Geo. He has read and approved the scientific and technical information
that forms the basis for the disclosure contained in this news release. About American Creek
American
Creek holds a strong portfolio of gold and silver properties in British
Columbia. Three of those properties are located in the prolific “Golden
Triangle”; the Treaty Creek and Electrum joint venture projects with
Tudor Gold (Walter Storm) as well as the 100% owned past producing
Dunwell Mine.
The Corporation also holds
the Gold Hill, Austruck-Bonanza, Ample Goldmax, Silver Side, and
Glitter King properties located in other prospective areas of the
province.
For further information please contact Kelvin Burton at: Phone: 403 752-4040 or Email: [email protected]. Information relating to the Corporation is available on its website at www.americancreek.comNeither
TSX Venture Exchange nor its Regulation Services Provider (as that term
is defined in the policies of the TSX Venture Exchange) accepts
responsibility for the adequacy or accuracy of this release. Cautionary Statements regarding Forward-Looking Information Certain
statements contained in this press release constitute forward-looking
information. These statements relate to future events or future
performance. The use of any of the words “could”, “intend”, “expect”,
“believe”, “will”, “projected”, “estimated” and similar expressions and
statements relating to matters that are not historical facts are
intended to identify forward-looking information and are based on the
Company’s current belief or assumptions as to the outcome and timing of
such future events. Actual future results may differ materially. All
statements including, without limitation, statements relating to the
Goldstorm Zone as well as any other future plans, objectives or
expectations of the Company are forward-looking statements that involve
various risks and uncertainties. There can be no assurance that such
statements will prove to be accurate and actual results and future
events could differ materially from those anticipated in such
statements. Important factors that could cause actual results to differ
materially from the Company’s plans or expectations include risks
relating to the actual results of current exploration activities,
fluctuating gold prices, possibility of equipment breakdowns and delays,
exploration cost overruns, availability of capital and financing,
general economic, market or business conditions, regulatory changes,
timeliness of government or regulatory approvals and other risks
detailed herein and from time to time in the filings made by the Company
with securities regulators. The Company expressly disclaims any
intention or obligation to update or revise any forward-looking
statements whether as a result of new information, future events or
otherwise except as otherwise required by applicable securities
legislation.
Posted by AGORACOM
at 7:50 AM on Wednesday, February 27th, 2019
Completed 71 diamond drill holes on the C.O.D vein.
High-grade intersections include 107.5 g/t gold and 880 g/t silver over 6.90 meters core length and 129 g/t gold and 1,154 g/t silver over 7.28 meter core length (News Releases of January 11 & 18, 2019).
Mining.com lists GGX drill intercept #7th best worldwide to date for 2019
Extended the C.O.D vein 160 m to the southwest by means of drilling
Completed 19 diamond drill holes on the Everest vein
VANCOUVER, BC / ACCESSWIRE / Feb 27, 2019 / GGX Gold Corp. (TSX-v: GGX), (OTCQB: GGXXF), (FRA: 3SR2) (the “Company” or “GGX“)
is pleased to recap highlights of the 2018 exploration season on the
Gold Drop Property located in Southern British Columbia. The program
focused on the C.O.D vein, located in the Gold Drop Southwest Zone.
During the drilling program the company also conducted mechanical
trenching on numerous targets.
Completed 71
diamond drill holes on the C.O.D vein. High-grade intersections include
107.5 g/t gold and 880 g/t silver over 6.90 meters core length and 129
g/t gold and 1,154 g/t silver over 7.28 meter core length (News Releases
of January 11 & 18, 2019).
Mining.com lists GGX drill intercept #7th best worldwide to date for 2019
Extended the C.O.D vein 160 m to the southwest by means of drilling
Completed 19 diamond drill holes on the Everest vein
Discovered the southern extension of the Gold Drop vein by means of mechanical trenching
Completed 30 m of trenching on the Silent Friend Vein
Completed thorough trenching program in the C.O.D North region of the property
Picture: First C.O.D Vein discovery and sample, May 2017
The
Gold Drop Property covers 5,628 hectares of geologically prospective
ground in the well-mineralized Greenwood District, and hosts 8 or more
known low-sulfide, gold-bearing veins or vein systems. These historical
showings have had limited modern exploration. Recently, the Greenwood
area has had a renewed interest by major and junior companies exploring
precious and base metals in the district.
The
2018 diamond drill program carried out by the Company focused on the
C.O.D vein. The vein was first identified to be a target of interest in
the spring of 2017. Following initial sampling of the vein the Company
conducted mechanical trenching and drilling. The results of the 2017
program were encouraging and the Company launched a winter drill program
in 2018. The program followed up on the 2017 drilling. The Company
completed additional diamond drilling during the fall of 2018,
completing a series of exploration holes south of the C.O.D trench. Here
the holes intercepted the vein, successfully extending the vein by 160
meters.
During
2018 a total of 71 diamond drill holes were completed on the C.O.D vein
structure and 19 diamond drill holes were completed on the Everest vein
for a total of 5,616 meters of drilling. The highlights of the program
are COD18-67 that intersected 129 grams per tonne (g/t) gold and 1,154
g/t silver over 7.28 meters core length and COD18-70 which intersected
107.5 g/t gold and 880 g/t silver over 6.90 meters core length. The
highlights of the drilling are listed in the following table.
Hole ID
Interval Length
Gold (gpt)
Silver (gpt)
Te (gpt)
COD17-14
16.03
4.59
38.64
COD18-3
2.1
14.62
150.2
102
COD18-26
1.4
10.3
1.09
0.24
COD18-32
1.51
3.67
67.2
30.4
COD18-33
2.98
8.65
47.6
37.3
COD18-34
3.41
6.16
72.4
31
COD18-37
3.95
8.23
67.36
38.53
COD18-45
2.05
50.15
375
COD18-46
1.47
54.9
379
COD18-49
1.47
9.52
118
72.2
COD18-54
1.66
7.6
60.2
34.1
COD18-61
1.38
5.29
32.4
31.4
COD18-63
1.17
28
424.7
150.4
COD18-67
7.28
129.11
1,154.90
COD18-68
2.76
8.77
85.4
56.3
COD18-69
7.46
5.76
67.9
61.2
COD18-70
6.9
107.5
880
Note:
Due to some tellurium drill core analyses being greater than the upper
analytical limit of 500 g/t the weighted average value for tellurium
could not be calculated for some intervals.
The
2018 trenching program was completed on targets located during the 2017
soil geochemical sampling program. The most significant discovery
during the trenching is the southern extension of the historic Gold Drop
Vein. Historic production from the Gold Drop Vein System is reported to
be 335 tonnes mined during 1926-1988 (mainly during 1933-1941) with
5,020 grams of gold (14.99 g/t gold) and 35,894 grams of silver (107.1
g/t silver) recovered. Grab samples collected from this vein during 2018
assayed up to 3.37 g/t gold and 43.9 g/t silver.
The
company completed a thorough trenching program in the C.O.D North area.
This area is located approximately 600m to the north of the C.O.D
drilling worksite. Here the company conducted trenching on targets
identified during the 2017 soil geochemical sampling program.
Several
quartz vein outcroppings were located and sampled in the trenches. The
highlights include grab sample 112753 of rusty quartz vein that assayed
15.45 g/t gold, 159 g/t silver and 114.5 g/t tellurium; and sample
112759, a chip sample across a 40 centimeter wide northeast-southwest
striking sub-vertical quartz vein, that assayed 21.7 g/t gold, 216 g/t
silver and 149 g/t tellurium. The table below outlines the chip sample
assays obtained.
Sample ID
Sample type
Au (ppm)
Ag (ppm)
Te (ppm)
112751
30 cm chip
1.43
12.8
10.2
112752
40 cm chip
4.26
26.8
18.25
112753
Area grab
15.45
159
114.5
112754
Area grab
1.38
9.23
5.98
112755
Area grab
6.52
17.65
14.25
112756
30 cm chip
5.07
39.5
29.2
112757
30 cm chip
1.38
10.1
6.27
112758
Area grab
4.75
20.9
12.65
112759
40 cm chip
21.7
216
149
112761
Area grab
1.58
11.85
9.08
The
Company is very pleased with the results obtained during the 2018
season. Plans are being finalized for 2019 and everyone at GGX is
excited for the 2019 field season!
David Martin, P.Geo., a
Qualified Person as defined by NI 43-101, is responsible for the
technical information contained in this News Release.
To view the Original News release with pictures please go to the website or contact the company.
Budget 2019 likely to boost India’s education sector
Published: February 23, 2019
India’s Annual Budget decides the way ahead for different sectors in the country.
Government has emphasised on education along with other sectors.
How the Budget 2019-20 will pave way for improvement in education sector
Akhil Shahani, Managing Director, The Shahani Group
The acting Finance Minister, Piyush
Goyal said that India is among the youngest nations in the world and the
Government is proud of its youth. The problems of India’s education
sector are well known, so how effectively has he addressed this major
issue for India’s youth in the 2019 interim budget.
Overall funding for school and higher
education has gone up by 10 percent to Rs 93,847.64 crore. However, this
could be considered insufficient considering India’s inflation rate of
6-7 percent. The newly constituted Higher Education Funding Agency
(HEFA) will receive 24 percent less funding for the coming year.
Considering that IIT’s, IIM’s and other central universities have been
asked to get loans from HEFA instead of depending on Government grants,
this reduced funding could limit their efforts to expand or improve
quality.
Goyal said in his Budget speech, “The
poor have the first right on the resources of the nation. The Government
while maintaining the existing reservation for SC/ST/Other Backward
Classes, have now ensured 10 percent reservation in educational
institutions and Government services for poor. In these institutions,
around 25 per cent extra seats (approximately 2 lakh) will be provided
so that, there is no shortfall of presently available/reserved seats for
any class.†So, he has asked institutions to increase their student
capacity by 25 percent but has not allocated extra funds for them to do
so. A couple of minor announcements included the establishment of an
institute for Artificial Intelligence and a new AIIMs in Haryana.
Overall, it could be argued that 2019’s
budget could have done a lot more for the education sector. For example,
the Government has provided free healthcare for 50 crore people via its
Ayushman Bharat scheme. It could have launched another scheme that
provides scholarships for students to study in any quality institution
of their choosing, instead of being limited to Government schools.
Additionally, the Government could have allowed private investment into
for-profit companies to setup schools and colleges. Funds for teacher
training, primary research in universities and student career guidance
could also have been allocated. The GST rate of 18% on digital education
could have been slashed or removed.
Based on the above, are there any aspects of the 2019 budget that could facilitate growth in the education sector?
Albert Einstein once said, “Within every
difficulty, lies opportunityâ€. The fact that the education sector’s
problems remain mostly unaddressed, offers interesting prospects for
education entrepreneurs. Having a look at the other parts of the budget
speech indicates what some of those opportunities could be for education
entrepreneurs.
The first aspect is that Rs. 60,000
Crore has been allocated for the MNREGA scheme which provides 100 days
of paid employment for rural households. Additionally, the Government
has launched the PM Kisan program which allocates Rs. 75,000 crore in
cash grants to around 12 crore farmers. The key aspects about both these
programmes are that rural families will be able to raise themselves out
of extreme poverty and aspire for a better life.
One of the most common actions done by
aspiring families is to find ways to educate their children so that they
will be able to live better lives than their parents. Interestingly,
many of these parents prefer to send their children to private schools
as they believe that the education offered is better than what is
available in free Government schools, which have high teacher
absenteeism and unsatisfactory education outcomes. This means that there
are opportunities for entrepreneurs to open private budget schools
charging fees of Rs 100-200 per month per child, which is within the
reach of many of these families.
The past years have seen an 11 percent
drop in student enrollment in Government schools and a 36 percent
increase in enrollment in these private budget schools, totaling around
16 million students. This shows that there is a great demand from lower
income families for low cost quality education for their children.
Private budget schools do not get funding from the Government, but are
able to turn a profit, even with the low level of fees charged.
Additionally, a few NBFCs have recognized the potential of this sector
and have started advancing loans to budget schools to enable them to
grow.
Another interesting point in the budget
speech was that mobile data consumption has increased by 50 percent in
the past five years. This is because India has among the lowest rates
for mobile data in the world. The Government aims to create 1 lakh
digital villages in the next five years, which will greatly increase
mobile data penetration in these locations. This means that a huge
number of people in small towns and villages will be able to easily
access education content via their mobile phones and facilitate their
own learning. Edtech entrepreneurs can then beam their online lessons
into the budget schools around India, to enhance the teaching provided
there. Vocational training providers can offer video lessons showing
subscribers how to develop useful job skills.
Much of existing online education
content is in English. However, as demand for online education increases
across the country from lower income groups, there is a huge
opportunity to provide this content in local languages to make it easier
to understand. Additionally, English language training via apps or
videos are also in high demand.
Even though the 2019 budget has not
given any real sops to the education sector, the increase in access to
mobile data among poorer Indians whose income is being supplemented by
the Government can offer great growth opportunities for Indian education
entrepreneurs.
Posted by AGORACOM-JC
at 3:45 PM on Tuesday, February 26th, 2019
SPONSOR: North Bud Farms Inc. (NBUD:CSE) Sustainable low cost, high
quality cannabinoid production and procurement focusing on both
bio-pharmaceutical development and Cannabinoid Infused Products. Click Here For More Information
NBUD: CSE
—————
A Wall Street bank just started covering 7 marijuana stocks. Here’s what it’s saying
Last year was a historic one for legal-marijuana proponents due to legalization in Canada and some US states.
Marijuana stocks are popular on Robinhood, a free-trading app popular among millennials.
On Monday, Jefferies became the second major Wall Street investment bank to write sell-side notes on popular weed companies.
A Wall Street bank has officially initiated coverage of cannabis
stocks, as high-flying cannabis companies have caught the attention of
both the Main Street and Wall Street following a wave of marijuana
legalization.
Last year was a historic one for legal-marijuana proponents. Canada and the state of Michigan legalized the recreational use of marijuana, and the US Congress passed the Farm Bill, which legalized hemp, a key source of the ingredient cannabidiol.
Additionally, major marijuana producers such as Cronos Group, Canopy Growth, Tilray, and Aurora Cannabis
were listed in the US last year, prompting investors, especially
younger ones, to pour money into the industry. On Robinhood, a
free-trading app popular among millennials, Aurora has outranked all other stocks including Apple in terms of the number of users who own shares.
As the demand for market insights into marijuana stocks grows,
Jefferies analysts Owen Bennett and Ryan Tomkins have started to write
sell-side notes on popular weed companies. Jefferies is the second major
Wall Street investment bank to cover the industry, after Cowen.
Tags: Hemp, stocks Posted in All Recent Posts, North Bud Farms Inc | Comments Off on North Bud Farms Inc. $NBUD.ca – A Wall Street bank just started covering 7 marijuana stocks. Here’s what it’s saying $WEED.ca $CGC $ACB $APH $CRON.ca $HEXO.ca $TRST.ca $OGI.ca