Posted by AGORACOM
at 1:19 PM on Monday, August 12th, 2019
SPONSOR: Advance Gold AAX.v – Advance Gold controls 100% interest in the Tabasquena Silver Mine in Zacatecas, Mexico. A cluster of 30 Epithermal veins have been discovered, with recent emphasis on exploring a large anomaly to drill. Advance also owns 15% of the Kakamega JV attached to Barrick Takeover Offer for Acacia Mining
In Canada, Gold is $100 higher than its (previous) all-time highs.
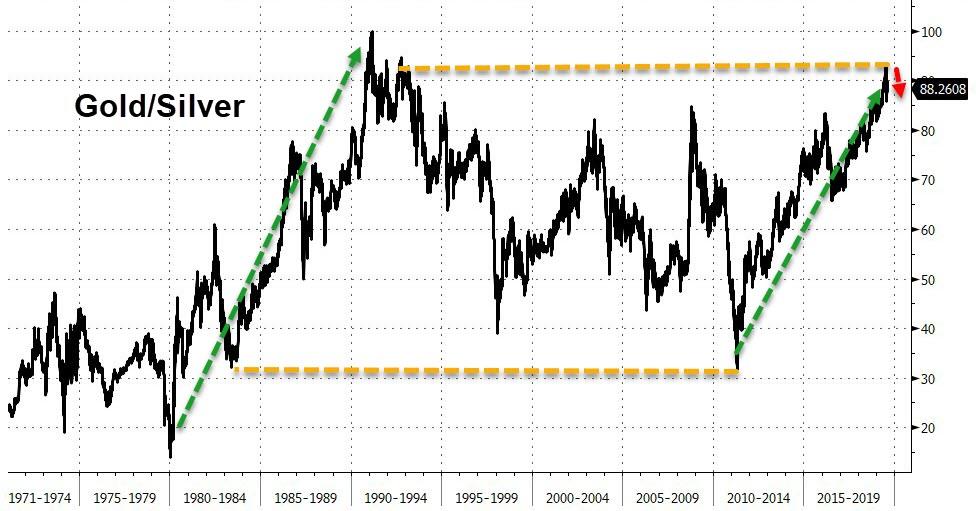
Gold and Silver Ratio also close to previous highs
Posted by AGORACOM
at 10:40 AM on Friday, August 9th, 2019
SPONSOR: Advance Gold AAX.v – Advance Gold controls 100% interest in the Tabasquena Silver Mine in Zacatecas, Mexico. A cluster of 30 Epithermal veins have been discovered, with recent emphasis on exploring a large anomaly to drill. Advance also owns 15% of the Kakamega JV attached to Barrick Takeover Offer for Acacia Mining Click Here for More Info
AAX.v
The model tells us that gold prices were inexpensive for the first five months of 2019 and are slightly undervalued at the end of July 2019. Gold prices should rise in the next five years
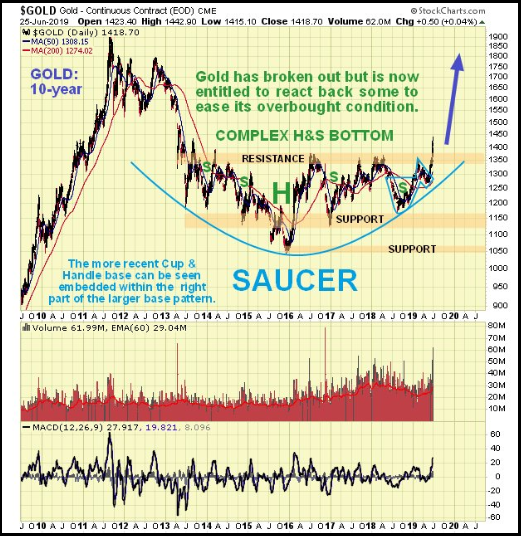
Breaking News: COMEX paper gold contracts closed on Wednesday, August 7, at $1,513, up from $1,274 on May 22. Gold bottomed at $1,045 in December 2015. The S&P 500 Index closed at a new all-time high on July 26.
We don’t know. Gold has disappointed for years, but central banks
must “inflate or die.†Expect more QE, lower interest rates and
excessive political and central bank manipulations.
But the more important question is: Are the COMEX prices for paper gold a fair value for the metal, or are they misrepresentative of what prices should be in this debt-based QE manipulated economy?
Should gold prices be higher or lower?
Consider the following graph of actual gold prices (each annual data point is the average of about 250 daily prices) and calculated gold prices based on an updated empirical model.
WHAT THIS GRAPH DOES NOT DO:
It is an empirical model, NOT a mathematical proof. It guarantees
nothing. While the model has worked for five decades, it could become
less effective tomorrow, next year, or never.
The model does NOT use gold or silver prices to produce calculated gold prices.
It is NOT a price prediction for paper gold contracts on the COMEX.
It is NOT a timing model. You shouldn’t TRADE based on this model.
WHAT THIS GRAPH DOES:
The model shows an estimated value for (annual average) gold prices based on macroeconomic variables. It is a valuation model.
The calculated gold model uses official national debt, crude oil, and the S&P 500 Index as input variables.
Test the Assumptions:
Gold prices rise, along with most other prices, as the banking
cartel devalues the dollar and pushes currency units into circulation. A
proxy for inflationary price increases is the official U.S. National
Debt adjusted for population growth.
Official National Debt in 1971 was $400 billion. Today it exceeds
$22,000 billion – over $22 trillion. Debt and prices will increase until
the financial system breaks or resets.
Gold prices rise along with crude oil, the most important global commodity.
Crude oil sold for $2.00 in 1971. Today it sells for $51.00. It
peaked at $147 in 2008. Crude oil prices rise because the banking cartel
devalues the dollar, changing supply and demand, and because
commodities are sometimes more desired than paper assets.
Over the long-term, commodity prices, including oil and gold, rise
and fall opposite to the S&P 500 Index. When investors favor stocks
(and paper investments) commodity prices are often weak. When commodity
prices are strong, stocks are often weak. The model assumes that gold
prices are mildly, but inversely, affected by the S&P 500 Index.
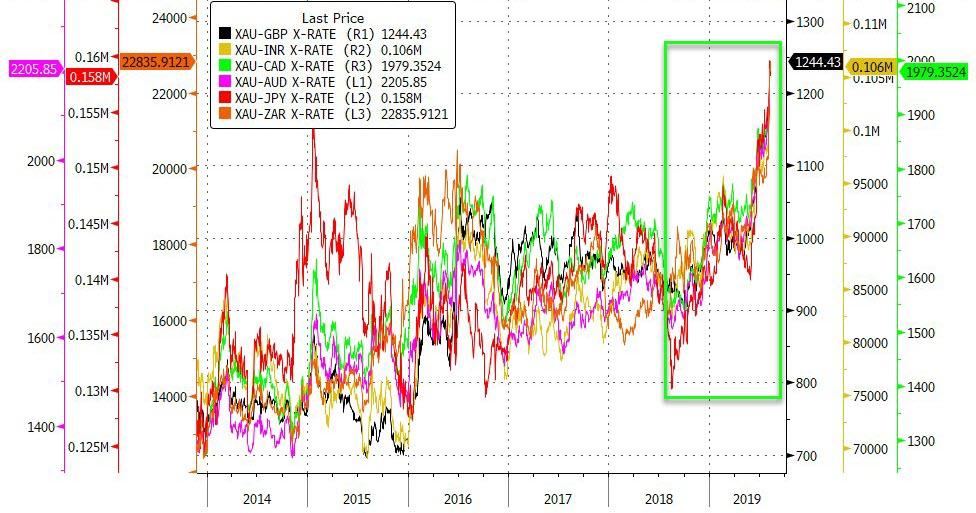
Gold is real money, unlike the digital and paper debts
(“fake-moneyâ€) issued by central banks. Gold will rise in “fake-moneyâ€
units as the banking cartel devalues currency units by issuing
ever-increasing quantities of “fake-money.†In many currencies, gold has
already reached new all-time highs.
Assumptions Summary:
Gold prices move higher as population adjusted national debt increases. (Dollar devaluation drives all prices higher.)
Gold prices move higher and lower with crude oil, another commodity.
Gold prices move opposite to the S&P 500 Index. (Investor preference for commodities versus paper assets.)
The model weighs and combines these macroeconomic variables to produce a “calculated gold price.†Call it a “fair value†price.
Examine the graph of gold prices and calculated gold prices for nearly five decades. Note that:
Calculated prices approximately match the annual average of daily gold prices.
Calculated prices may bottom and rally several years before the paper gold price bottoms and moves upward.
Calculated annual prices don’t reach gold’s high and low daily prices because daily prices spike too high and crash lower.
Buying for the long term makes sense when daily gold prices are low compared to the “calculated†price. (Think early 2019.)
Selling a portion of core positions is sensible when daily prices are well above “calculated†prices, such as in 2011.
Gold Prices in Five Years?
I don’t know, but almost certainly much higher.
The model depends upon national debt (will be much higher), crude
oil prices (higher in five years—probably) and the S&P 500 Index
(flat to higher—maybe).
National debt will rise rapidly. A 100-year average increase is
almost 9% per year, every year. Current economic conditions, no credible
spending restraints, “QE to Infinity,†and the coming recession will
boost deficits and debt into the stratosphere, even without more wars.
Crude oil prices rise and fall. They traded below $11 in 1998,
reached $147 in 2008, but moved below $30 in 2016. Mid-East tensions and
inflationary expectations are rising. It’s reasonable to expect crude
oil prices will not fall much from current levels and might rise
considerably.
The S&P 500 has risen from 100 in the 1960s. It is overvalued
today and likely to fall, but in the long-term it will rise as dollars
are devalued. Assume it corrects and then rises slowly. Remember, the
S&P 500 collapsed over 50% after its 2007 high.
“I think the crashing point is where
the Scottish economist Peter Millar puts it – where interest on debt
starts going exponential and consuming the real economy. In a paper
written in 2006 Millar wrote that fiat money systems based on debt
require periodic currency devaluations to reduce the burden of interest
payments. These devaluations require upward revaluation of the monetary
metals and all real assets relative to debt and currency.
“Indeed, the U.S. economists and fund
managers Paul Brodsky and Lee Quaintance speculated in 2012 that such a
devaluation of currencies and upward revaluation of gold was already
the long-term plan of central banks – that they were
redistributing world gold reserves to allow countries with excessive
U.S. dollar surpluses to hedge themselves against a dollar devaluation.
The resulting upward revaluation of gold, Brodsky and Quaintance wrote, would reliquify central banking around the world.â€
“In simplest terms, easy money blows up bubbles. Bubbles pop and set off a crisis. Rinse. Wash. Repeat.â€
“The economy is loaded up with
government, corporate and consumer debt. The stock markets have been
juiced to record levels. We also see other asset bubbles in high-yield
bonds, housing (again), and commercial real estate, along with a lot of
other assets you don’t hear as much about – such as art and comic
books.â€
“The bottom line is that we can’t
“fix†the economy by electing Republicans or Democrats. We can’t put the
country on sound economic footing by tweaking this or that policy in
Washington D.C. The only way to put the economy on a sound
footing is to deal with the root cause of the problem — the Federal
Reserve and its constant meddling.â€[In the meantime, expect larger deficits and higher gold prices.]
From Groucho Marx:
“Politics is the art of looking for trouble, finding it everywhere, diagnosing it incorrectly and applying the wrong remedies.â€[The results include massive deficits, unpayable debt, consumer price inflation and higher gold prices.]
CONCLUSIONS:
The model tells us that gold prices were inexpensive for the
first five months of 2019 and are slightly undervalued at the end of
July 2019.
Gold prices should rise in the next five years. The model, depending
on assumptions for debt increases, crude oil prices and the S&P
500, suggests a fair value of $2,500 to $4,500 in five years. A spike
much higher, perhaps to $10,000, is not unlikely.
Daily prices could double or triple the fair value or fall 10% to 20% below fair value.
This model is not a prediction or guarantee. It is a valuation
model. It could lose accuracy tomorrow, but it has a nearly five-decade
history of success.
Correlation for the annual model since 1971 is 0.97. The R-Squared value is 0.95.
Buy when the market price is at or lower than the calculated gold price, such as now or after the next correction. Sell when market prices drastically exceed calculated fair value, such as in late 1979, early 1980, and July-August 2011.
Miles Franklin
will convert dodgy debt-based dollars into physical metal that has
preserved wealth for millennia. The gold valuation model says buy during
2019 because gold prices are below fair value. Call Miles Franklin at
1-800-822-8080 to purchase undervalued gold and silver bullion and
coins.
American Creek owns a 20% Carried Interest to
Production at the Treaty Creek Project in the Golden Triangle. 2019’s
first hole averaged 0.683 g/t Au over 780m
in a vertical intercept. The Treaty Creek property is located in the
same hydrothermal system as Pretivm and Seabridge’s KSM deposits.
Eric Sprott recently made a strategic 1$M investment in AMK
Lead by Shawn Ryan and Roger Moss, LAB has 2 district scale Gold
projects in Labrador that have never seen any modern exploration
techniques. Ashuanipi and Hopedale are being systematically explored for
gold potential utilizing the same techniques that created the White
Gold discoveries. At Ashuanipi , a 15km long by 2 to 6 km wide
north-south trend exists and a second 14 km long by 2 to 4 km wide
east-west trend exists. At Hopedale, 2019 exploration has discovered
two new mineralized showings.First showing extends potential strike
length by approximately 500 metres along strike of the Thurber Dog gold
occurrence; Second showing was discovered in the Misery North area
GGX gold has discovered high grade gold silver and tellurium in the
Greenwood-Republic mining camp, British Columbia. The current 2019 drill
program follows up on 2018 intercept of high grade gold-silver (129 g/t gold and 1,154 g/t silver over 7.28 meter) from the near surface COD vein which is projected to be 1.5 kms in length. In addition tellurium grades were announced with “up to 3,860 g/t telluriumâ€, including “823 g/t tellurium over 7.28-meter core length†and “640 g/t tellurium over 6.90-meter core length. 2019 drilling on COD North is currently underway.
Great Atlantic is situated between Marathon Gold and Sokoman in
Canada’s newest emerging gold district. The Company reported a NI
43-101mineral resource estimate for the JMZ in late 2018 on Golden
Promise and 2019 is focused on prospecting and geochemical sampling at
high priority targets within the property. Planned 24 hole program in
the northern half of the property at the gold-bearing Jaclyn Zone,
specifically at the Jaclyn Main Zone (JMZ) and Jaclyn North Zone (JNZ).
American Creek owns a 20% Carried Interest to
Production at the Treaty Creek Project in the Golden Triangle. 2019’s
first hole averaged 0.683 g/t Au over 780m
in a vertical intercept. The Treaty Creek property is located in the
same hydrothermal system as Pretivm and Seabridge’s KSM deposits.
Eric Sprott recently made a strategic 1$M investment in AMK
Lead by Shawn Ryan and Roger Moss, LAB has 2 district scale Gold projects in Labrador that have never seen any modern exploration techniques. Ashuanipi and Hopedale are being systematically explored for gold potential utilizing the same techniques that created the White Gold discoveries. At Ashuanipi , a 15km long by 2 to 6 km wide north-south trend exists and a second 14 km long by 2 to 4 km wide east-west trend exists. At Hopedale, 2019 exploration has discovered two new mineralized showings.First showing extends potential strike length by approximately 500 metres along strike of the Thurber Dog gold occurrence; Second showing was discovered in the Misery North area
GGX gold has discovered high grade gold silver and tellurium in the
Greenwood-Republic mining camp, British Columbia. The current 2019 drill
program follows up on 2018 intercept of high grade gold-silver (129 g/t gold and 1,154 g/t silver over 7.28 meter) from the near surface COD vein which is projected to be 1.5 kms in length. In addition tellurium grades were announced with “up to 3,860 g/t telluriumâ€, including “823 g/t tellurium over 7.28-meter core length†and “640 g/t tellurium over 6.90-meter core length. 2019 drilling on COD North is currently underway.
Great Atlantic is situated between Marathon Gold and Sokoman in
Canada’s newest emerging gold district. The Company reported a NI
43-101mineral resource estimate for the JMZ in late 2018 on Golden
Promise and 2019 is focused on prospecting and geochemical sampling at
high priority targets within the property. Planned 24 hole program in
the northern half of the property at the gold-bearing Jaclyn Zone,
specifically at the Jaclyn Main Zone (JMZ) and Jaclyn North Zone (JNZ).
Posted by AGORACOM
at 2:39 PM on Tuesday, August 6th, 2019
A 3D Induced Polarization (IP) geophysical survey on its Tabasquena project in Zacatecas, Mexico is underway.
Survey designed to complement and enhance current 3D model of Tabasquena Epithermal veins
Goal of the survey is to assess the depth potential below the near surface mineralized zone
Kamloops, British Columbia–(Newsfile Corp. – August 6, 2019) – Advance Gold Corp. (TSXV: AAX) (“Advance Gold” or “the Company”) is pleased to announce that a 3D Induced Polarization (IP) geophysical survey on its Tabasquena project in Zacatecas, Mexico is underway. This geophysical survey is designed to complement and enhance the 3D model derived from the recent drilling which confirmed a widespread gold and silver mineralized epithermal vein system.
Prior to Advance Gold acquiring the project, a limited IP survey had
been carried out. This historical IP survey effectively identified three
of the known veins as significant chargeability and resistivity
anomalies.
The goal of the survey is to assess the depth potential below the
near surface mineralized zone that was encountered in the andesites,
with the graphitic phyllites below still open at depth. It is important
to note that the vein systems in the nearby mines operated by Fresnillo
Plc., and MAG Silver’s Juanicipio mine currently under construction, are
epithermal veins systems focused on zones within the graphitic
phyllites.
The 3D IP geophysical survey will take thousands of data point
readings on an 800 X 500 metre grid. It is designed to give a clearer
picture of anomalies adjacent to and below the current drilling, which
is primarily down to 300 metres, and possibly see down to approximately
600 metres.
Allan Barry Laboucan, President and CEO of Advance Gold Corp. commented: “We
are in a unique position for a gold and silver explorer as having found
a fully intact epithermal vein system. This is a fairly rare
occurrence. Making things somewhat challenging is that with a system
like this, the boiling zone of the system is deeper. This is the case in
all of the nearby mines around the cities of Fresnillo and Zacatecas,
Mexico. The mines are hosted in the graphitic phyllites below the
andesites. We have drilled a widespread zone of gold and silver
mineralization in the andesites at Tabasquena. Hopefully, once the
geophysical survey is completed we will be better able to focus our
deeper drilling in the search for the boiling zone of the system. With
the gold and silver markets gaining strength, it is a very exciting time
for us to be advancing this exceptional project. In addition to the
technical merits of the project, we are in one of the most prolific
mining regions worldwide for silver as 10% of the historical world
silver production comes from the state of Zacatecas, from epithermal
vein systems. Since we made the discovery of this system approximately
one year ago, the gold and silver markets have gone from being subdued
to much more optimistic. One of the defining attributes of this region,
in addition to the prolific mines, is that the costs for exploration,
development and mining are some of the lowest in the mining sector. We
have a highly prospective project at Tabasquena, are doing the work to
advance the project, have a small and tight share structure and will be
delivering crucial news as the market for gold and silver are improving
yet the menu for investors to choose from is small when it comes to the
exploration of quality projects.”
Julio Pinto Linares is a QP, Doctor in Geological Sciences with
specialty in Economic Geology and Qualified Professional No. 01365 by
MMSA., and QP for Advance Gold and is the qualified person as defined by
National Instrument 43-101 and he has read and approved the accuracy of
technical information contained in this news release.
About Advance Gold Corp. (TSXV: AAX)
Advance Gold is a TSX-V listed junior exploration company focused on
acquiring and exploring mineral properties containing precious metals.
The Company acquired a 100% interest in the Tabasquena Silver Mine in
Zacatecas, Mexico in 2017, and the Venaditas project, also in Zacatecas
state, in April, 2018.
The Tabasquena project is located near the Milagros silver mine near
the city of Ojocaliente, Mexico. Benefits at Tabasquena include road
access to the claims, power to the claims, a 100-metre underground shaft
and underground workings, plus it is a fully permitted mine.
Venaditas is well located adjacent to Teck’s San Nicolas mine, a VMS
deposit, and it is approximately 11km to the east of the Tabasquena
project, along a paved road.
In addition, Advance Gold holds a 14.63% interest on strategic claims
in the Liranda Corridor in Kenya, East Africa. The remaining 85.37% of
the Kakamega project is held by Acacia Mining (63% owned by Barrick Gold
Corporation).
For further information, please contact: Allan Barry Laboucan, President and CEO Phone: (604) 505-4753 Email: [email protected]
American Creek owns a 20% Carried Interest to Production at the Treaty Creek Project in the Golden Triangle. 2019’s first hole averaged 0.683 g/t Au over 780m in a vertical intercept. The Treaty Creek property is located in the same hydrothermal system as Pretivm and Seabridge’s KSM deposits. Eric Sprott recently made a strategic 1$M investment in AMK
Lead by Shawn Ryan and Roger Moss, LAB has 2 district scale Gold projects in Labrador that have never seen any modern exploration techniques. Ashuanipi and Hopedale are being systematically explored for gold potential utilizing the same techniques that created the White Gold discoveries. At Ashuanipi , a 15km long by 2 to 6 km wide north-south trend exists and a second 14 km long by 2 to 4 km wide east-west trend exists. At Hopedale, 2019 exploration has discovered two new mineralized showings.First showing extends potential strike length by approximately 500 metres along strike of the Thurber Dog gold occurrence; Second showing was discovered in the Misery North area
GGX gold has discovered high grade gold silver and tellurium in the Greenwood-Republic mining camp, British Columbia. The current 2019 drill program follows up on 2018 intercept of high grade gold-silver (129 g/t gold and 1,154 g/t silver over 7.28 meter) from the near surface COD vein which is projected to be 1.5 kms in length. In addition tellurium grades were announced with “up to 3,860 g/t telluriumâ€, including “823 g/t tellurium over 7.28-meter core length†and “640 g/t tellurium over 6.90-meter core length. 2019 drilling on COD North is currently underway.
Great Atlantic is situated between Marathon Gold and Sokoman in Canada’s newest emerging gold district. The Company reported a NI 43-101mineral resource estimate for the JMZ in late 2018 on Golden Promise and 2019 is focused on prospecting and geochemical sampling at high priority targets within the property. Planned 24 hole program in the northern half of the property at the gold-bearing Jaclyn Zone, specifically at the Jaclyn Main Zone (JMZ) and Jaclyn North Zone (JNZ).
Posted by AGORACOM
at 10:10 AM on Monday, July 29th, 2019
SPONSOR: Advance Gold AAX.v – Advance Gold controls 100% interest in the Tabasquena Silver Mine in Zacatecas, Mexico. A cluster of 30 Epithermal veins have been discovered, with recent emphasis on exploring a large anomaly to drill. Advance also owns 15% of the Kakamega JV attached to Barrick Takeover Offer for Acacia Mining
AAX.v
Caution ahead of this week’s U.S. Federal Reserve meeting, with investors likely to look beyond an expected rate cut
Interest rate futures are fully priced for a quarter-point rate cut from the Fed on Wednesday, with only a small chance of a half-point move.
Gold was little changed on Monday as caution set
in ahead of this week’s U.S. Federal Reserve meeting, with investors
likely to look beyond an expected rate cut to the central bank’s
guidance on monetary policy for the rest of the year.
“A rate cut is entirely priced in while a 50 basis points cut is
extremely unlikely. So guidance becomes absolutely key,†OANDA senior
market analyst Craig Erlam said.
â€(Gold’s movement) will depend
on how dovish or how far ajar Jerome Powell leaves the door on these
rate cuts in the months ahead.â€
For the first time since the
financial crisis, the Fed is expected to trim the key interest rate by
at least 25 basis points (bps) at its July 30-31 meeting. Investors will
also look for signals of likely additional cuts in the pipeline.
“Much will also depend on what Fed Chair Powell says in the subsequent
press conference: if he makes no mention of a cycle of rate cuts,
causing gold to come under pressure, we would not see this as a trend
reversal but as an attractive buying opportunity,†analysts at
Commerzbank said in a note.
Interest rate futures are fully priced
for a quarter-point rate cut from the Fed on Wednesday, with only a
small chance of a half-point move.
Traders
will also keep a close eye on the U.S. and Chinese trade talks in
Shanghai this week, as negotiators from both countries meet for their
first in-person talks since a truce at G20 last month. Expectations are
low for a breakthrough.
On the technical front, $1,400 will be the key downside support for gold, and beyond that, $1,380, OANDA’s Erlam said.
“Bulls are very reluctant to let go just yet, but if we do see those
levels break, we might see gold bulls head for the exits quite quickly.â€
Hedge
funds and money managers reduced their bullish stance in COMEX gold in
the week to July 23, the U.S. Commodity Futures Trading Commission
(CFTC) said in a report on Friday.
SPDR Gold Trust, the world’s largest gold-backed exchange-traded fund, said its holdings fell 0.1% to 818.14 tonnes on Friday.
Among other precious metals, silver dipped 0.1% to $16.37 per ounce.
Palladium fell 0.3% to $1,530.38 per ounce, while platinum gained 0.8% to $867.26 per ounce.
Posted by AGORACOM
at 1:40 PM on Monday, July 22nd, 2019
SPONSOR: GGX’s Gold Drop property, situated in one of the most prolific gold-copper mining camps of North America, the Greenwood-Republic mining camp. The current 2019 drill program is following up on the 2018 drilling which intercepted high grade gold-silver results (129 g/t gold and 1,154 g/t silver over 7.28 meter) from the near surface COD vein which is projected to be 1.5 kms in length. Click here for more information
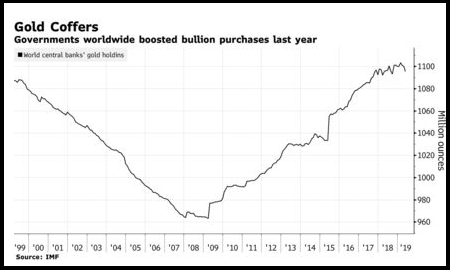
Central Banks Return to Gold
Central banks bought more gold in 2018 than at any time since the early 1970s
Bullion holdings rose by 651.5 tons last year, the most since 1971
In the 1990s, gold was an unloved asset among central banks. Reserve managers lent or sold their gold, particularly in Europe, and the gold price fell to a low of US$250/oz. Years of persistent selling triggered the Central Bank Gold Agreement of 1999, under which signatories agreed to limit collective sales to 400 tonnes per annum, put a cap on gold leasing and take a disciplined approach to gold futures and options.
The Agreement delivered two clear benefits: it helped to stabilise
the gold price and increased transparency around central bank gold
sales. Today, however, sentiment towards gold has been transformed and
gold has regained its status as a valuable and highly regarded reserve
asset.
In 2018 alone, central banks bought 651 tonnes of gold, up 74% compared to 2017 and the highest level since 1971.
Key Changes
A glance back over the past 20 years highlights some of the key changes in central bank behaviour.
First, central banks have rapidly and consistently added to their
foreign exchange reserves since the Asian crisis of 1998. Reserves are a
crucial element in a country’s armoury, providing protection against
both domestic and external shocks and acting as a show of confidence to
the outside world. Emerging market economies led the charge in this
respect, sending worldwide foreign exchange reserves from around US$3
trillion (tn) in 2000 to approximately US$13tn in 2014. Purchases have
plateaued over the past five years but still stand at some US$13tn
today.
The dollar is the most widely held reserve asset but, according to
International Monetary Fund statistics, gold comes third, accounting for
11% of global reserves. Having been net sellers until 2000, central
banks have been net buyers ever since. In 2018 alone, central banks
bought 651 tonnes of gold, up 74% compared to 2017 and the highest level
since 1971. Over the past decade, central banks have purchased more
than 4,300 tonnes of gold, taking their total holdings to around 34,000
tonnes today. The trend has continued in 2019, with net purchases
reaching 90 tonnes before the end of the first quarter.
Notably too, central bank buying has been geographically diverse. Russia
has been the most committed purchaser of gold – acquiring almost 275
tonnes in 2018, the largest amount ever purchased in a single year.
China has been consistently adding to its reserves as well, but many
other emerging market countries have been accumulating gold over the
past year and more, including Hungary, Poland, Egypt, Kazakhstan and
India.
The Drivers
What is the rationale behind this renewed interest in gold? First,
heightened uncertainty about the global economic and geo-political
outlook and second, gold’s intrinsic value as a reserve asset.
Ten years after the Global Financial Crisis, the macro-economic
outlook remains fragile and hard to read. In April, the IMF outlook
highlighted weakening GDP growth, with risks skewed to the downside. As
IMF Chief Economist Gita Gopinath explained, the global economy is at “a
delicate momentâ€. Advanced economies are predicted to grow by just 1.8%
in 2019 and 1.7% in 2020, while growth in the Euro area is expected to
be even lower, at 1.6% and 1.5% respectively. The emerging market growth
trajectory is more solid (4.4% in 2019 and 4.8% in 2020) but risks
remain tilted downwards.
Trade tensions are a major unknown. They have already had a negative
impact on growth and if the US and China do not reach a genuine truce,
the global outlook may worsen further. Fears of retaliation and
escalation may hit business investment, supply chains may be disrupted,
and productivity may slow across the world stage. The Euro area faces
specific challenges too. Business confidence is low, especially in
Germany due to the introduction of new fuel emission standards in the
auto industry. Fiscal policy is affecting Italian sovereign and
commercial bank spreads. And, of course, uncertainty about Brexit
persists, particularly as the exit date has now been postponed to
October 2019.
Furthermore, global geo-political risks have not abated and may have a
negative impact on economic activity. Idiosyncratic risks are
increasing too, such as the rise of populist governments in Latin
America and across Europe.
What is the rationale behind this renewed
interest in gold? First, heightened uncertainty about the global
economic and geo-political outlook and second, gold’s intrinsic value as
a reserve asset.
Gold Advantages
All these uncertainties accentuate negative market sentiment and
drive central bank investors to reallocate their portfolios away from
risky assets to safe haven assets.
This is where gold comes into its own, as it fulfils central banks’ three core objectives: safety, liquidity and return.
Gold is well known as a safe haven asset. It carries no credit risk,
has little or no correlation with other assets and the price generally
increases in times of stress. As such, it offers valuable protection in
times of crisis.
Gold is highly liquid too. It can easily be traded in global market
centres, such as London and New York. It can be used in swap
transactions to raise liquidity when needed and it can be actively
managed by reserve managers.
Gold can also enhance the risk/return profile of a central bank portfolio. Its lack of correlation to other major reserve assets makes it an effective portfolio diversifier and, over the long term, it delivers higher returns than many other assets.Â
Posted by AGORACOM
at 7:30 PM on Tuesday, July 16th, 2019
Barrick Gold Corporation’s offer for Acacia Mining PLC under review by Independent Mining Consultants
Arguing Acacia is worth 38% more than Barrick’s offer
The takeover offer and its effect on the Kakamega joint venture project between Acacia and Advance Gold are not yet understood
The Kakamega joint venture project is owned 85.37% by Acacia and 14.63% by Advance Gold
New licenses for the joint venture project were issued and exploration program is underway post rainy season
Kakamega – The Rosterman Mine
Acacia Exploration Kenya Ltd. (“Acaciaâ€) has 85.47% equity in the
Kakamega Project, which comprises the Rosterman, Burkura, and Sigalagala
Projects in Kenya, East Africa.
Rosterman SL267: The most northerly of the three
licences hosts the historic Rosterman mine, which is reported to have
produced in excess of 250,000oz Au at average grade in excess of 13g/t. Click Click here for map
Bukura SL265 and Sigalagala SL266: The southern licences host numerous significant historical colonial mines and areas of active artisanal mining. Click here for map
About Advance Gold Corp. (TSXV: AAX)
Advance Gold is a TSX-V listed junior exploration company focused on
acquiring and exploring mineral properties containing precious metals.
The Company acquired a 100% interest in the Tabasquena Silver Mine in
and the Venaditas project in Zacatecas state. Advance Gold also holds a
14.63% interest in the Kakamega project held by Acacia Mining (63% owned
by Barrick Gold Corporation)
Posted by AGORACOM
at 9:12 AM on Thursday, July 11th, 2019
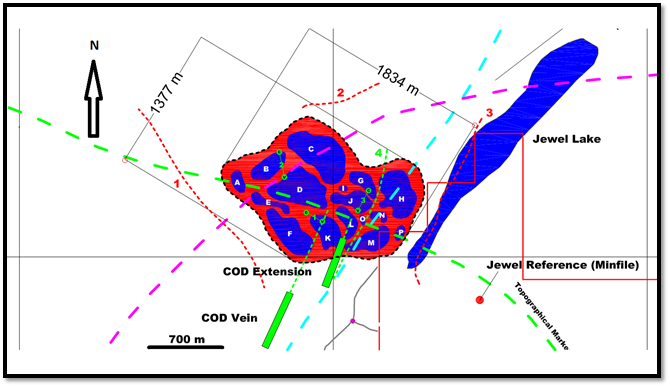
Drilling at the C.O.D. North vein, where sample results obtained late last year ranged up to 21.7 grams per tonne gold over 0.4m
Drilling will then be directed to the area of a new-technology geophysical target identified by Stargate II
Anomaly measures 1834 by 1377 metres and is interpreted as a pipe-like structure that tops out at about 360 metres
Drilling to a depth of at least 400 and up to 764 metres
VANCOUVER, BC / ACCESSWIRE / July 11, 2019 /
GGX Gold Corp. (TSX-V: GGX), (OTCQB: GGXXF), (FRA: 3SR2) (the “Companyâ€
or “GGXâ€) announces that it will resume drilling next week at its Gold
Drop property in the Greenwood Mining Camp.
After
taking a much-deserved field break, the drill and geological crews are
returning to the Company’s operations base in Greenwood, B.C. to resume
drilling activity on the Gold Drop property. Drilling will resume next
week initially at the C.O.D. North vein, where sample results obtained
late last year ranged up to 21.7 grams per tonne gold over 0.4 metres
(see news release dated Nov 20, 2018).
Drilling
will then be directed to the area of a new-technology geophysical
target identified by Stargate II, an enhanced, deep-penetrating
ultra-sonic AMT (Audio-Magnetotellurics) geophysical survey conducted
by Earth Science Services Corporation of Oshawa, Ontario (see news
release dated July 3, 2019). The new geophysical anomaly on the Gold Drop property is centered at the intersection of three interpreted major fault-conduit structural lineaments, two of which are coincident with known structures: C.O.D. vein system and a cross-fault. Geometrically, the
anomaly measures 1834 by 1377 metres (see figure below) and is
interpreted as a pipe-like structure that tops out at about 360 metres,
requiring drilling to a depth of at least 400 and up to 764 metres. This
will be the deepest ever to be drilled on the Gold Drop property.
Stargate II Anomaly Map:
Drilling
is expected to continue through this month on these and other targets.
Assay results from the first round of this season’s drilling on the
C.O.D. vein are also expected to be received this month.
David
Martin, P.Geo., a Qualified Person as defined by National Instrument
43-101 and consultant to the Company, approved the technical information
in this release.


