Agoracom Blog Home

Posts Tagged ‘#Canada’

Secular Gold Bull Resumes with Force SPONSOR: Affinity Metals $AAF.ca $SII.ca $TUD.ca $GTT.ca $AMK.ca $OSK.ca $RKR.ca

Posted by AGORACOM at 12:50 PM on Monday, May 11th, 2020
This image has an empty alt attribute; its file name is Affinity_Metals_Corp_Logo.png

Sponsor: Affinity Metals Corp. (TSX-V: AFF) is a Canadian mineral exploration company building a strong portfolio of mineral projects in North America. The Corporation’s flagship property is the drill ready Regal Property near Revelstoke, BC where Affinity Metals is making preparations for a spring drill program to test two large Z-TEM anomalies. Click Here for More Info

COVID-19: The Pin that Punctured the Credit Balloon

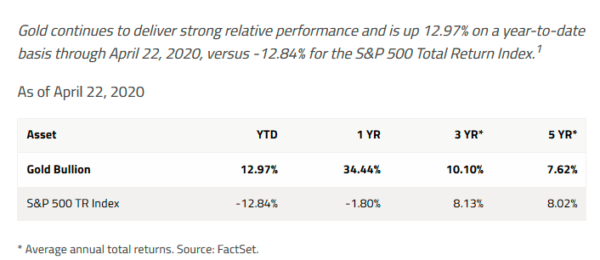
Gold is on the cusp of breaking out to all-time highs in U.S. dollars and has already done so in virtually every other currency. Gold mining stocks continue to lag the metal and, in our opinion, represent a compelling investment opportunity at this moment. The COVID-19 pandemic panic was merely the black swan that punctured a financial market asset bubble that took almost a decade to inflate.

Think of the pandemic as the pin that punctured the credit balloon. In a few months, the pandemic will ease (hopefully) with the formulation of a COVID-19 vaccine, widespread testing and other responses that will surely come from the healthcare industry. However, the fiscal and monetary policy damage committed by all governments to save the world has created a debt hangover that will linger for years. Economic growth will rebound but only to subpar levels once extreme health-related restrictions are lifted and “stimulus” kicks in.

The requisites for robust economic growth most likely to misfire are investment confidence and bank lending. Both have been severely compromised. Whether this landscape evolves into a long stretch of deflation or combusts into untamed inflation remains to be seen. What seems quite apparent is that traditional Keynesian stimulus measures are in their endgame. They will most likely deliver only steadily diminishing returns. Starkly opposite economic outcomes are possible from this policy morass; both would be positive for gold but negative for real returns on fixed income or equities.

Q1 Marks a Pivotal Turning Point for All Asset Classes

As of this writing, gold is trading about 10% less than its all-time high of US$1,900 attained nine years ago (September 2011). In effect, it has gone nowhere for a decade despite a tectonic shift in the investment and economic outlook. A lengthy correction lasting until 2016 and subsequent churning resulted in the establishment of a powerful multi-year basing structure. From this base and with strong macroeconomic tailwinds, we believe new highs well above $1,900 can be achieved over the next four years.

Despite enthusiastic advocacy and much chatter from investment luminaries, including Ray Dalio, Jeff Gundlach, Seth Klarman and others, gold remains severely and inappropriately underrepresented in the portfolios of fiduciaries, endowments and family offices. Flows into channels such as gold-backed exchange traded funds (“ETFs”) have been strong relative to previous low levels, but must still be considered a trickle in terms of what could still come. 

 Figure 1. Gold-Backed ETFs Reach Record Levels
Global gold-backed ETFs added 298 tonnes and net inflows of US$23 billion in Q1 2020 — the highest quarterly amount ever in absolute U.S. dollar terms and the largest tonnage additions since 2016.
Source: World Gold Council. Data as of 3/31/2020.

In our opinion, the first quarter of 2020 will mark a pivotal, secular turning point for all major asset classes including equities, bonds, gold and currencies. A return to the pre-2020 financial market normalcy and investment complacency is unlikely. In our view, consensus hopes remain high that the credit smash is only a temporary repercussion of the health scare. We disagree and suggest the effects will be long lasting.

Despite the solid price gains achieved by gold in the past two years, there is much more upside to come as investors gradually give up on repeated equity market bottom fishing and the hope of a return to financial market normalcy. A full reversal to the previous complacency cannot take place following a brief crash. The mood change will more likely become pervasive after grueling stretches of disappointing returns from previously successful investment strategies.

Unprecedented Central Bank Monetary Expansion

In our view, the decade preceding 2020 was characterized by the systematic stifling of price discovery for interest rates and the appropriate dependent valuations for financial assets. Such distortion was made possible only by unprecedented central bank balance sheet expansion that encouraged, abetted and rewarded risk taking in the form of ever greater leverage.

The prolonged somnolence of gold was among the most egregious price distortions of the previous decade and this suppressed interest in the metal as a risk mitigator and portfolio diversifier. Disinterest was fed in large part by the nearly universal expectation that the past would always be prologue and that highly leveraged financial and economic structures would perpetually result in outsized returns. In our view, the greatest change stemming from the credit bust will be a mood shift or paradigm change in the opposite direction.

At gold’s previous peak in 2011, the combined balance sheets of the U.S. Federal Reserve (“U.S. Fed”) and the European Central Bank (“ECB”) totaled approximately US$5.5 trillion. Today, that number is more than $11.4 trillion and rapidly moving higher. The USD gold price is still lower than nine years ago. In our view, gold price is still well below where it should be and will likely trade higher in the new macro landscape.

 Figure 2. Pandemic Policy Response Pushes Global Balance Sheets to Record Levels
Source: Bloomberg. Data as of 3/31/2020.

Gold Mining Stocks are Inexpensive

If gold is not correctly priced for what has transpired and what lies ahead, gold mining stocks are even more inappropriately priced. Based on current metal prices, most companies are generating positive earnings and cash flow and in many cases, free cash flow that can be applied to higher dividend payouts. Compared to other sectors of the economy, the gold mining industry stands almost alone in looking forward to strong 2020 earnings and a positive outlook for 2021.

2020 free cash flow yields for large-cap producers range from 3%-7% and 6%-25% for intermediate producers based on conventional sell-side research. The stats are similar or better for 2021 based on spot gold prices. As Figure 3. shows, mining stocks are inexpensive in absolute terms and have never been so cheap relative to the gold price. 

Figure 3. Gold Equities Are Undervalued Relative to Bullion
Ratio of XAU Index to Spot Gold (12/23/1983-3/31/2020)

Since 2008, the relative valuation of gold equities to gold bullion has fallen 75% from the prior 25-year average. The ratio of the XAU Index to spot gold averaged 0.2497x for a quarter century through 2008. As of 3/31/2020, the ratio was 0.0501x.

It is undoubtedly true that the industry will suffer health-related mine shutdowns and other shortfalls this year. Much of the disruption potential has already been broadcast and priced into the market. Some downside news may still have yet to surface. However, most miners are not financially levered and should be able to survive a few quarters of lower or no production. Unlike the airline, leisure, retail and manufacturing sectors, gold not produced today should grow in value and be produced at higher prices and lower costs next year and those beyond. It is not the same story for many other sectors of the economy. Based on fundamentals, gold stocks are inexpensive. By contrast, several other sectors of the economy could face long stretches of poor earnings, bad news flow and financial woes.

The gold mining sector registered a decline of approximately 20% in Q1 (as measured by GDX2) as shares did get battered by indiscriminate liquidations during March. However, as of this writing, two weeks after the close of the quarter, most shares trade near to where they stood at the beginning of the year, and have certainly registered outstanding performance in relative terms. It is remarkable that the largest sector ETF, GDX, suffered outflows of $381 million3 during the quarter at what could be the threshold of an upside breakout. In a favorable cycle for the gold price, mining stocks have historically delivered outperformance 3 to 5 times that of the metal itself.

Gold mining shares continue to be viewed by investors with deep skepticism as reflected by valuation and flows. When we scan Figure 4, it appears to us that the sector is on the verge of an upside breakout from a multi-year base should our assessment of the macroeconomic environment prove correct.

Figure 4. NYSE Arca Gold BUGS Index (HUI4)

Monetary and Fiscal Policy Going Ballistic

There is no need to belabor the obvious. However, the consequences of these actions have yet to be priced into the financial markets or gold. The risk parity trade has fallen short, partly because bonds were caught up in the indiscriminate liquidations of Q1. Looking forward, bonds may no longer be able to play the safe haven role they traditionally filled to balance equity risk. The vacuum could be filled in part by increased gold exposure for all classes of investors. Sovereign credit liquidity injections are likely to remain significant and permanent. The bond market has become socialized. Owning Treasury bonds of any duration could become akin to parking Treasury bills, with little upside and considerable risk of impairment through inflation. Gold is the antidote to the fixed-income investor’s dilemma.

Gold is extremely under-owned, under-represented, and poorly thought of in the circles of conventional investment thinking. It is still considered to be a fringe asset. Just ask Goldman Sachs which recently advised its clients:

 “We concluded then (2010) that gold does not have a role as a strategic asset class in clients’ already well-diversified portfolios. We have updated the research and the evidence is even more compelling today than it was then.” (4/5/2020; Goldman Sachs Investment Strategy Group)

We remind the reader that Goldman is the same firm that in December 2019 declared the U.S. economy to be “recession proof” and then in March 2020 cautioned that stocks had substantial further downside:

“Overall, the changes underlying the Great Moderation appear intact, and we see the economy as structurally less recession prone today.” (12/31/2019; Goldman economists Jan Hatzius and David Mericle)

“Goldman Sachs on Friday dramatically cut its U.S. economic forecast, saying it now expects GDP to decline by 25% in the second quarter of 2020 because of the coronavirus panic.” (3/20/2020; Business Insider)

“What is your estimate for the S&P 500 by yearend 2020? David Kostin, “3400.” (1/2020; GS Podcast, David Kostin Goldman, U.S. chief equity strategist and Jake Siewert) 

“Kostin thinks the market goes lower. ‘In the near term, we expect the S&P 500 will fall towards a low of 2000.’” (3/22/2020; Yahoo Finance)

Goldman’s commentary is, in our opinion, a reasonable proxy for conventional wisdom. One could easily find other embarrassing examples of mainstream thinking ignorant of the best-performing asset class (by far) versus equities and bonds since 2000.

Contrarians and value investors, take note! The secular gold bull that began in 2000 and corrected for a few years has returned to life with renewed vigor. Pullbacks — price declines during this uptrend — should be bought. The setup for gold and gold mining shares ticks every box for highly rewarding investment returns.

Figure 5. Gold Has Outperformed Stocks, Bonds and USD over the Past 20 Years
Returns for Period from 12/31/1999-4/13/2020

Source: Bloomberg. Period from 12/31/1999-4/20/2020. Gold is measured by GOLDS Comdty; US Agg Bond Index is measured by the Bloomberg Barclays US Agg Total Return Value Unhedged USD (LBUSTRUU Index); S&P 500 TR is measured by the SPX; and the U.S. Dollar is measured by DXY Curncy. Past performance is no guarantee of future results.

Figure 6. Gold Provides Portfolio Diversification
Gold provides diversification in a portfolio, and has low correlation with other asset classes. The period measured is April 1, 2015 to April 1, 2020.


* Source: World Gold Council. Period from April 1, 2015 to April 1, 2020, based on monthly returns. Gold is measured by the LBMA Gold Price; stocks by the S&P 500 Index; commodities by the Bloomberg Commodity Index;  Bonds by the BarCap Treasuries and Corporates.

1The S&P 500 or Standard & Poor’s 500 Index is a market-capitalization-weighted index of the 500 largest U.S. publicly traded companies. You cannot invest directly in an index. TR, “Total Return”, represents the index with dividend income reinvested.
2VanEck Vectors Gold Miners ETF (GDX) seeks to replicate the NYSE Arca Gold Miners Index (GDMNTR), which is intended to track the overall performance of companies involved in the gold mining industry.
3Source: ETFtrends.com.
4The NYSE Arca Gold BUGS Index (HUI) is a modified equal dollar weighted index of companies involved in gold mining.

SOURCE: https://sprott.com/insights/sprott-gold-report-secular-gold-bull-resumes-with-force/#

The Fed Can’t Print Silver SPONSOR: Affinity Metals $AAF.ca $SII.ca $TUD.ca $GTT.ca $AMK.ca $OSK.ca $RKR.ca

Posted by AGORACOM at 11:21 AM on Tuesday, April 28th, 2020
This image has an empty alt attribute; its file name is Affinity_Metals_Corp_Logo.png

Sponsor: Affinity Metals Corp. (TSX-V: AFF) is a Canadian mineral exploration company building a strong portfolio of mineral projects in North America. The Corporation’s flagship property is the drill ready Regal Property near Revelstoke, BC where Affinity Metals is making preparations for a spring drill program to test two large Z-TEM anomalies. Click Here for More Info

As a general rule, the most successful man in life is the man who has the best information Richard (Rick) Mills, Ahead of the Herd

April 27, 2020 (Investorideas.com Newswire) Silver prices will test $19 an ounce later this year on the back of heavy investment demand, as the coronavirus continues to depress markets and push investors in the direction of safe havens like precious metals.

That is the conclusion of The Silver Institute’s annual World Silver Survey, compiled by research firm Metals Focus and released in April.

Silver prices are driven by mine supply/ recycling and demand from both retail/ institutional investors and industry.

Over half of silver demand comes from industrial uses like solar panels, electronics and automotive parts. (Around 20 grams of silver are required to build a solar panel)

While most of the world’s mined gold is still around, either cast as jewelry, or smelted into bullion and stored for investment purposes, the same cannot be said for silver. It’s estimated around 60% of silver is utilized in industrial applications, leaving only 40% for investing. Of the 60% used for industrial applications almost 80% ends up in landfills.

The drop in demand for most goods and services owing to covid-19 doesn’t exempt silver – industrial fabrication is seen falling by 7%, along with jewelry and silverware offtake – but the report projects these declines will be offset by a 16% increase in silver bar and coin demand. There is also expected to be strong inflows into silver-backed ETFs as well as net buying by institutional investors on both the futures and OTC markets.

And while the white metal, sometimes called “poor man’s gold”, is expected to be in surplus again this year, the Silver Institute says the glut will be limited (to 14.7 million ounces, 53% smaller than in 2019), by a number of government shutdowns in top producers Mexico and Peru. As of April 3rd silver mine closures had restricted 40% of global production.

The Silver Institute therefore expects silver prices, currently trading around $15 an ounce, to hit $19/oz before year-end, possibly even outperforming gold on the back of its historically low relative value. If that happens, it would be a repeat of silver’s pattern last year.

Catching gold’s wave

In analyzing silver we also need to look at gold. The precious metals often follow each other’s price movements and they are frequently found together in mineral deposits.

Silver and gold both spiked last summer after the US Federal Reserve began cutting interest rates to deal with slowing global growth and signs of a worsening US economy. In July the Fed lowered rates three times before freezing the federal funds rate at a range of 1.5 – 1.75%. (they have subsequently been cut to near 0%)

Rate cuts, along with similarly dovish policies among other central banks, a record $17-trillion of negative-yielding sovereign debt, and safe-haven demand due to tensions with Iran, to name a key issue, powered the precious metals to new heights.

Silver prices rose 15% in 2019, helped by a 12% increase in silver investment demand – the highest annual growth since 2015. 

The onset of the coronavirus, first appearing as an epidemic in China, then spreading to Iran and South Korea, before becoming a full-blown pandemic in mid-March, has meant high volatility for gold and silver.

We’ve seen gold spike on safe-haven demand, as investors piled into gold ETFs, US Treasuries and the US dollar, only to fall sharply mid-March, as traders sold their gold holdings to cover losses in other assets

Since the beginning of April gold has surged, reclaiming $1,700/oz on the back of a record $2.2 trillion spending package announced by the US government, to combat the economic fallout from covid-19.

Other central banks have launched huge stimulus measures to head off, or more likely dampen, the effects of a global recession or even depression.

On April 14 Comex gold futures for June delivery vaulted to $1,785 an ounce, the highest since October 2012. Although gold prices have slipped back a bit, currently trading around $1,720/oz, some analysts see the potential for another leg up. Bloomberg quoted Hans Goetti, founder and chief executive officer of HG Research, saying:

“What’s happening here is that the Fed is expanding its balance sheet and every other central bank in the world is doing the same,” he told Bloomberg TV. “What you’re looking at is massive currency debasement in the long term. That’s the major reason why gold is higher, and I would think that over the next few weeks or months, we’re probably going to retest the high that we saw in 2011” (when gold passed an all-time high of $1,900/oz).

Another factor in gold’s favor is negative real interest rates.

Many countries including the United States have seen bond yields approach or even go below 0%. When real rates (yield minus rate of inflation) turn negative, investors tend to rotate from bonds into gold.

And while securities analysts quoted by Bloomberg expect the Federal Reserve’s renewed quantitative easing, combined with large fiscal stimulus (spending), could see long-end rate rise during the recovery phase of coronavirus, they don’t see that happening without inflation, “which should keep real rates suppressed.”

This week, Bank of America released a forecast predicting gold will rocket as high as $3,000 an ounce within 18 months.

According to Marketwatch, BofA Global Research raised its 18-month price target from an earlier $2,000, citing the prospects of endless monetary expansion from central banks, including the Federal Reserve, to limit the economic damage from the COVID-19 pandemic.

“The rather lofty upside gold price forecast from Bank of America continues to echo in the marketplace with the widely publicized quote ‘the Fed can’t print gold’ a very strong point for the bull camp,” analysts at Zaner Metals wrote in a daily update.

As we showed in a previous article, there is a close relationship between gold and debt-to-GDP ratios.

Undervalued silver

Gold and silver prices are often compared, to get a sense of which direction each are headed. The gold-silver ratio is the amount of silver one can buy with an ounce of gold. Simply divide the current gold price by the price of silver, to find the ratio.

When gold is over-valued compared to silver, investors take advantage of the arbitrage opportunity, by selling some of their gold holdings to buy silver. The opposite occurs when silver is over-valued compared to gold. In that situation, precious metals investors sell silver to buy gold.

The higher the number, the more undervalued is silver.

The current gold-silver ratio, 113:1, is double the historical ratio of 50-60 ounces of silver to one ounce of gold, meaning that silver is highly undervalued compared to gold. It means an investor with an ounce of gold could sell his gold for 113 ounces of silver.

All the bullish factors for gold are in place: a “black swan” event that has created huge fear and uncertainty, imploding global stocks and sending traders/ investors flocking to the safety of havens like the US dollar, US Treasuries and precious metals. The demand for Treasuries has pushed up their prices, causing their yields to fall to new lows. Negative real yields (yields minus inflation) are bullish for gold, and we expect real yields to remain negative for some time.

Remember, gold rises proportionally to debt. As long as governments are wrangling the coronavirus, we fully expect national debt piles to keep growing. Indeed the political pressure on governments to help the most vulnerable in society, for fear not only of losing power, but in some countries, extreme social unrest, is bound to keep the stimulus taps gushing.

While demand for silver, like for most industrial metals, will fall during this period of virus-related uncertainty, after the pandemic is beaten, we expect it to come roaring back, and the extremely out-of-whack gold-silver ratio to correct, in silver’s favor.

Silver mines, ranked

Silver supply is sensitive to mine production cuts – as we have seen recently with coronavirus-related stoppages. However, silver is also vulnerable to supply slippage, more so than gold, because there are relatively few pure-play silver mines.

Only around 30% of annual supply comes from primary silver mines while more than a third is produced at lead/zinc operations and a further 20% is from copper mines. Over two-thirds of the world’s silver resources are sourced from polymetallic ore deposits.

That makes silver quite a bit different from gold, in that primary gold deposits, with relatively few other minerals, are common. Large deposits of gold are also found in copper-gold porphyries.

Not so for silver, which most often has to be coaxed out of lead and zinc ores, followed by mines specializing in copper and gold, in that order.  
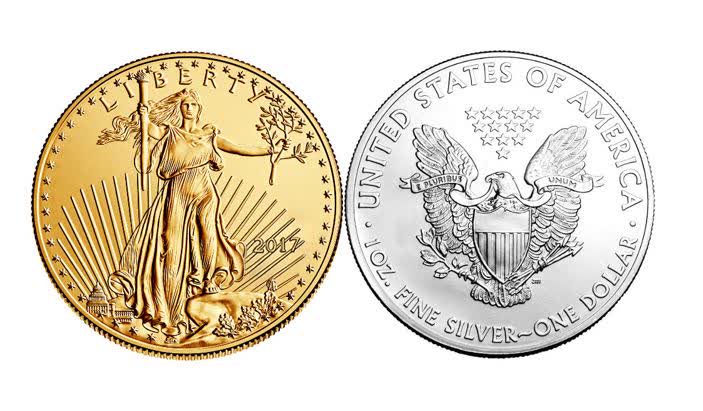
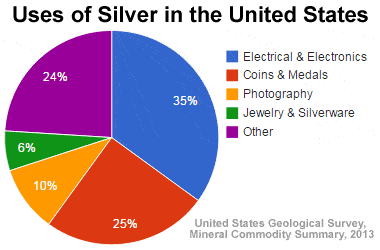
Only twenty eight percent of global silver production is sourced from primary silver mines. Last year’s World Silver Survey delineated the world’s largest primary silver mines. Topping the list was Fresnillo’s Saucito mine in Mexico, which in 2018 produced 19.9 million ounces. Second spot went to Polymetal’s Dukat mine in Russia (16.5Moz), followed by Buenaventura Mines’ Uchucchacua mine in Peru, producing 15.4Moz. According to the US Geological Survey, Mexico is by far the largest producer, outputting 6,300 tonnes in 2019, followed by Peru and China, at a respective 3,600t and 3,800t. Next on the list are Russia, Poland and Australia. Global silver production in 2019 totaled 27,000 tonnes, or 868 million ounces. 

Where are the world’s largest silver mines, including mines that produce silver as a by-product of other metals?

The 2020 Silver Survey has KGHM Polska Miedz’s three copper-silver mines in Poland – Lubin, Rudna and Polkowice-Sieroszowice – leading by a long shot, at 40.2Moz in 2019.

That is almost twice the production of number 2 Penasquito (22.7Moz) and over double Dukat’s 19.3Moz. Saucito, ranked highest last year in primary silver mine production in 2020, is the fourth-largest mine in the world containing silver and other metals.


Poland’s Kupferschiefer silver

State-run Polska Miedź (KGHM) is the second largest silver producer in the world, behind only Fresnillo, and the sixth biggest copper miner. 

Why is so much silver produced from one company, KGHM Polska Miedz, versus Mexico and Peru, which are more closely associated with silver mining?

To know the answer, we must first understand Poland’s giant “Kupfershiefer” copper-silver deposits, of which the Lubin, Rudna and Polkowice-Sieroszowice mines, containing 1.4 billion ounces of silver reserves, are a significant part.

Sedimentary-hosted stratiform copper deposits are among the two most important copper sources in the world, the other being copper porphyries. They typically range from 1.6 million to 170 million tonnes copper ore, grading between 0.7% and 4.2%, with a median of 14 million tonnes at an average grade of 1.6% Cu, according to a 2019 academic paper, ‘The Kupferschiefer Deposits and Prospects in SW Poland: Past, Present and Future’.

Sedimentary copper deposits are formed in ocean basins, where copper and other minerals travel up through porous lithologies such as sandstone and become trapped in the upper sequence of sandstone and overlaying it black shale and limestone.

Red-bed deposits, so named due to oxidation resulting from exposure to the atmosphere, are divided into volcanic and sedimentary.

Kupferschiefer deposits are similar to red-beds but larger, even regionally extensive. They typically form in a marine setting, after land is gradually submerged into a shallow sea, then overlain by sedimentary rocks – which formed from the gradual deposition of the carcasses of dead sea creatures, onto the ocean floor.

A classic “Kupferschiefer” consists of three main layers – sandstone, bituminous shale and limestone overlain by evaporates often containing oil and gas. Copper-containing fluids migrate up through the sandstone and get trapped by the carbon-rich copper shale. This is where most of the mineralization is concentrated, although it can also be found in the sandstone, limestone, or a combination of all three layers.

The Kupferschiefer copper belt that underlies Germany and Poland is among only three giant sediment-hosted copper deposits in the world. It is also within an elite 1% of deposits that contain over 60 million tonnes of copper.

Orebodies can range in thickness from 0.3 m, contained largely within the black shale of the Kupferschiefer sensu stricto, up to more than 50 m, where sublevel stoping, backfilling, and pillar mining reflect the pervasive mineralization, states a research paper.

According to the Polish Geological Institute, Poland holds the largest economic copper resources in Europe, about 36 million tonnes, and the most anticipated economic silver resources on the continent, about 3.4 billion troy ounces.

Other metals recovered from copper ores at Poland’s Kupferschiefer deposits include gold, platinum, palladium and rhenium.

Despite being a small country, about the size of New Mexico, Poland produced 54.6 million ounces of silver in 2019, up 18% from 2018, mainly as a product of copper mining.

The richest silver deposits are located in the Lower and Upper Silesia regions, where the first shallow mines pre-date the Roman Empire, going back as far as 1136 AD.

According to the US Geological Survey, the massive volume of metal in Poland’s Kupferschiefer deposits is due to continuous mineralization that extends down dip and laterally for kilometers.

Identified resources within the giant Lubin-Sieroszowice deposit, are 1.6 billion tonnes of ore containing 30.3 million tonnes of copper and 2.7 billion ounces of silver, at average grades of 1.63% Cu and 57 g/t Ag. Reserves are 23.7 million tonnes copper and 1.4 billion ounces silver.

The strongest copper sulfide mineralization occurs in the black clay shales, including chalcocite, bornite, covelline and chalcopyrite, accompanied by minerals associated with silver, native silver, lead, zinc, cobalt and nickel.

A comparison at this point is interesting. #1 primary silver mine Saucito contains 130.3Moz in reserves, at an average silver grade of 272 g/t Ag. #2 is Dukat, with 93.4 Moz in reserves averaging 4.1 g/t Ag. The third largest primary silver mine, Uchucchacua, has 98.5Moz at 294.2 g/t.

Lubin-Sieroszowice dwarfs all three, at 10 times the reserves of Saucito, 15 times those of Dukat, and 14 times Uchucchacua’s. (Saucito and Uchucchacua are admittedly much higher-grade)

Minerals from three underground mines – Lubin, Polkowice-Sieroszowice and Rudna – are extracted using the room and pillar method at depths of between 600 and 1,250 meters. Expected minelife is 50 to 60 years, producing at a rate of 30 million tonnes a year. Consider that three of the four original mines have been producing since the late 1960s. They’ve already been going for 50+ years, yet they have another 50-60 more years to go and mineralization is open down dip.

The earliest exploration dates back to 1914, when German geologists conducted studies of the Zlotoryja region, and later, Grodziec. The first mine, Lena, started in 1936 but production was halted due to the onset of World War Two.

In 1959, 24 drill holes outlined the Lubin-Sieroszowice deposit, found at depths of between 400 and 1,000 meters. A resource estimate tallied indicated resources of 1.364 billion tonnes of ore grading 1.42%, containing 19.34 million tonnes of copper and about 1.157 billion ounces of silver.

Copper mining began in 1968 with the commissioning of two mines, Lubin and Polkowice.

According to KGHM’s 2019 results, the Lubin, Polkowice-Sieroszowice and Rudna mines produced 1,400 tonnes of silver last year, or 45 million ounces, at an average 48.7 g/t Ag.

In 2014, a project called “Deep Glogow” began mining from below the 1,200m level, using infrastructure from Rudna and Polkowice-Sieroszowice. The project contains 265.5 million tonnes grading 1.6% copper and 54 g/t silver, and has a minelife of 40 years.

There are also three undeveloped deposits to the north with identified resources (2018) of 139,535 million tonnes of ore including 2.2 million tonnes of copper and 356.3 million ounces of silver. And this year, 2020, Zielona Góra Copper (a Canadian company) documented a new Cu-Ag deposit “Nowa Sól” located northwest from the Lubin area. This new deposit has an estimated resource of 848 MT of copper and 0.036 MT of silver.

CESAR copper+silver project

The reason we have spent so much time writing about Poland’s Kupferschiefer is because of Max Resources (TSX.V:MXR).

Since November, Max’s geological teams have been identifying copper and silver targets within a 120 km x 20 km area, at their CESAR copper+silver project in northeastern Colombia.

Max field crew has been mapping copper-silver bearing stratabound horizons, rock chip channel sampling across mineralized beds and wall rock and following continuity of identified horizons along strike, to determine potential size prior to drilling.

The Vancouver-based company sees similarity of mineralization at the CESAR project to Kupferschiefer as a new giant sediment-hosted coppersilver mineralized system.

In a Feb. 27 news release, Max notes that its recent AM North and AM South discoveries are hosted in well-bedded sandstone-siltstone similar to KGHM’s monster “Kupferschiefer” mines in Poland.

In an earlier interview with AOTH, Max’s head geologist, Piotr Lutynski, said Colombia’s stratigraphy is similar to his homeland, Poland, and its cluster of Kupferschiefer sediment-hosted copper-silver deposits.

The last news release from CESAR concerns the AM South discovery – which features a stratabound copper-silver horizon, with mineralized structures totaling over 5 km of strike length. Earlier this year, sampling from 0.1 to 25-meter intervals returned highlight values of 5.4% copper and 63 g/t silver.

Having recently discovered a 10-meter by 2-meter panel which returned copper and silver grades of 3.5% Cu + 26 g/t Ag, the 1.4-km stratabound copper-silver horizon has been extended 1,000m, to 2,400m. (2.4 km).

Max also reported a new discovery, AM-2, located 500 meters south of AM-1. The new zone extends for 1,000 meters, and is open along strike and dip. The fact that it is parallel to AM-2 strongly suggests stacked horizons.

Assays at AM-2 are pending.

The CESAR project and its potential to be a Kupfershiefer analogue has grabbed the attention of one of the most important research centers in the world for the study of these sedimentary-hosted stratiform copper deposits which are also large repositories of silver.

In the press release below, Max says it has sent surface rock samples extracted from CESAR’s stratabound copper-silver mineralization horizons to the University of Science and Technology’s Department of Economic Geology, located in Krakow, Poland. Researchers at the university, which has worked extensively with KGHM in Poland, will conduct mineralogical and geochemical studies on the samples; also, a Masters-level student is planning on writing a thesis paper on the results.

Vancouver B.C., April 21, 2020 – MAX RESOURCE CORP. (“Max” or the “Company”) (TSX.V: MXR; OTC: MXROF; Frankfurt: M1D2) is pleased to report the involvement of the University of Science and Technology (“AGH-UST”), Faculty of Geology, Geophysics and Environmental Protection, Department of Economic Geology (“AGH”), Krakow, Poland in a study of the sediment-hosted copper-silver mineralization of the CESAR project, located 420-km north of Bogota, in NE Colombia.

Max has dispatched surface rock samples extracted from the CESAR stratabound copper-silver mineralized horizons to AGH. From these samples, AGH will conduct various mineralogical and geochemical studies.

AGH Professors and teaching staff have a long history of cooperation with KGHM Polska Miedz (“KGHM”), the largest copper producer in Europe and the worlds largest silver producer. AGH will leverage their extensive knowledge of KGHM’s world renowned Kupferschiefer sediment-hosted copper-silver deposits in Poland, on the academic study of CESAR.

Max and AGH agreed that results from the study on CESAR may be used for public presentations and scientific papers. In addition, discussion have commenced with respect to an AGH M.Sc. student focusing their thesis on selected material sent from the CESAR project.

AGH-UST in Krakow, Poland has a distinguished history and a deep understanding of sediment-hosted copper-silver deposits, due to their extensive work with Kupferschiefer, established in Poland as a world-class producer of copper and silver since 1968, also producing, gold, palladium, platinum and rhenium as by-products.

“We anticipate the scientific team from the Department of Economic Geology will play a significant role in identifying the similarities with Kupferschiefer and unlocking the ultimate potential of CESAR,” Max CEO, Brett Matich, commented.

“Max’s CESAR project in Colombia provides for significant exposure to both copper and silver, and notably silver has increased from a low of $11.74 per ounce in March to a high of $16.06 in April,” Mr. Matich concluded.

Max cautions investors that mineralization at Kupferschiefer is not necessarily indicative of similar mineralization at CESAR.

Conclusion

Investment demand for silver looks solid, with no end in sight to the low-interest-rate/ loose monetary policy direction of central banks, combined with record-breaking stimulus packages being passed by governments, as the coronavirus crisis rages on.

Adding higher demand due to shrinking silver supply, lower grades, and less by-product credits from falling lead and zinc mine production, we see a floor forming under silver prices.

The 113:1 gold-silver ratio is very high by historical standards. This is a warning to investors that at any time, the ratio could correct, either meaning a move up in silver prices or a move down in gold prices. Trust me, gold is not going down anytime soon, meaning silver prices must eventually correct.

The coronavirus has lit a fire under gold prices, which have burned past $1,720 an ounce. Historically, silver rides the wave started by gold.

As long as governments are wrangling the coronavirus, we fully expect national debt piles to keep growing. Gold prices rise proportionally to debt.

Consider what a $10 trillion Fed balance sheet will do to the debt-to-GDP ratio. Consider what it will do for gold and silver!

Despite broad-based market volatility, now is an unbelievably good time to be investing in precious metals. Buying physical gold and silver won’t hurt you, but high prices do not make an attractive entry point and we don’t see a significant pullback happening anytime soon.

Historically, and especially so today, the greatest leverage to rising precious metals prices has been owning the shares of junior resource companies focused on acquiring, discovering and developing precious metals deposits.

Identifying who owns the most attractive silver, in the ground, that can be bought at historically low valuations would seem to me a very prudent investing strategy at the moment.

For the last several months I’ve been following Max Resource Corp. as it develops CESAR. Max’s goal is to bring in a major as a partner, that can help finance a drill program at CESAR and bring it to a resource, then, fingers crossed, complete the rest of the steps (PEA, prefeasibility study, feasibility study, permits, etc.) required to build a mine.

We are also encouraged to see interest expressed by AGH-UST university in Poland, where some of the people most familiar with Kupfershiefer-type deposits, other than KGHM, will study samples from Max’s CESAR to see if there is a correlation. That’s exciting.

Could Max be sitting on another Kupfershiefer? Time will, as always, tell. But by the time we get a definitive answer I would expect the share price to have already runaway.

Richard (Rick) Mills

subscribe to my free newsletter

aheadoftheherd.com

Source:https://aheadoftheherd.com/Newsletter/2020/The-Fed-cant-print-silver.htm

VIDEO: Affinity Metals $AFF.ca Discusses Significant Silver Discovery at their Regal Project in B.C $SII.ca $TUD.ca $GTT.ca $AMK.ca $OSK.ca $RKR.ca

Posted by AGORACOM-JC at 9:37 AM on Wednesday, April 22nd, 2020
Affinity Metals Corp. Enters into Agreement to Acquire the Regal ...

Rob Edwards discusses the extraordinary exploration results at the ALLCO Project and the implications of discovering such a significant discovery hole at their Regal Pollymettalic Property in the Kootenay Arc, B.C.

The numbers show there is a considerable source of mineralization on the property to create 11.10 meters of 143.29 g/t silver including 0.55 meters of 2612.0 g/t,   only further exploration will continue to define the limits of the Allco area and other the Major targets Affinity has plans for developing during the 2020 exploration season.

Take a seat and grab your favorite beverage and have a listen to the remarkable story that is Affinity Metals.

The Gold / Silver Ratio: It Will Keep On Climbing SPONSOR: Affinity Metals $AAF.ca $SII.ca $TUD.ca $GTT.ca $AMK.ca $OSK.ca $RKR.ca

Posted by AGORACOM at 10:31 AM on Tuesday, April 21st, 2020

The gold silver ratio has been rising for nine years.

There are many commentators suggesting that the gold silver ratio is nearing a top at present. Here and here are good examples. I am not of that opinion and consider that it will keep climbing for the next 10 years at least. Below is a chart of the gold silver ratio (Source)

As you can see, the chart shows that the gold silver ratio hit a high of 125.89 on the 18th March 2020 and has since declined back to 111.81 (16/4/20). It is likely over time to retest and break the recent highs and then keep on climbing.

The analysis

To understand why the ratio is going to keep on climbing, we need to look at how gold and silver are used.

Silver

Below is the breakdown of the percentage usage of silver in the US:

Source

As you can see, 45% is used in photography and electrics. The other category (24%) is a mix of energy use, brazing and soldering, chemical production, mirror production and medicine (see link above). In total therefore 69% is used in industry. Only 31% is used in jewelry and coins (silver kept in circulation).

Gold

Below is a breakdown of the percentage uses of gold in the US:

Source

Industrial use of gold is only 37%, but 58% is used in coins and jewelry (gold kept in circulation).

Conclusion

As silver is 69% used in industry and gold only 35%, silver is much more sensitive to the strength of the economy than gold is. The last economic cycle in the US was the weakest in modern economic history. Real potential GDP was 1.6% from 2008 to 2018 (Source). This is the lowest 10-year rate since before the Second World War. The gold silver ratio is therefore doing exactly what you would expect it to do in a weak economic backdrop. It is steadily rising. If the economy remains weak after the present recession, I would expect that the gold silver ratio will continue to rise. So will it remain weak?

Here is a link to the latest Hoisington Investment Management March report. Their conclusion is that growth and inflation will remain weak, despite the massive money printing and stimulus presently being rolled out by the US government and Federal Reserve. I heartily agree with this analysis. Below is a long-term chart of US GDP:

Source

Growth peaked during the second world war and has been steadily falling since then. Since the war, average growth is falling at .7 of a percent every 10 years. As the US government and Federal Reserve are insistent on bailing out all industries and companies, productivity will remain low. This is because the weak companies will not be eliminated, allowing a re-allocation of the capital from the weak to the strong. Below is the population growth of the US economy for the last decade:

The 2019 growth rate was .6 of 1%. With slow population growth and slow productivity growth, the growth rate of the US economy must remain weak. GDP growth is the product of the change in population growth and the change in productivity growth. If both are weak, GDP must remain weak.

Implications

For investment (not trading) purposes, it is clear that if the gold silver ratio keeps climbing, gold will outperform silver on a long-term basis. If you like precious metals to diversify your portfolio, you should buy gold and not silver. It may well be that the gold silver ratio trades lower in the short term and is a good trade, but it is not the way to go if you are an investor. It is also clear that gold miners will outperform silver miners. I presently have no exposure to any silver mining stocks (although some of my gold miners produce silver as a byproduct). Don’t be fooled into thinking that just because the gold silver ratio has hit a high and is now falling that it will mean revert. We are in a low growth environment for the foreseeable future and the ratio will behave accordingly!

SOURCE: https://seekingalpha.com/article/4338404-gold-silver-ratio-will-keep-on-climbing

Affinity Metals Reports Drill Results for Regal Project with New Silver Discovery of 11.10 m of 143.29 g/t Silver $AAF.ca $SII.ca $TUD.ca $GTT.ca $AMK.ca $OSK.ca $RKR.ca

Posted by AGORACOM at 9:16 AM on Thursday, April 16th, 2020
This image has an empty alt attribute; its file name is Affinity_Metals_Corp_Logo.png

Affinity Metals Corp. (TSXV: AFF) (“Affinity”) (“the Corporation”) is pleased to release assay results from the late fall drill program conducted on the Regal property encompassing 8,800 hectares of the northern end of the prolific Kootenay Arc approximately 25 km northeast of Revelstoke, British Columbia, Canada.

Along with numerous high grade intercepts in multiple holes, a significant new silver discovery was made in the ALLCO area with drill hole #10 intersecting 11.10 meters of 143.29 g/t silver including 0.55 meters of 2612.0 g/t silver. This intersection also carried high grade zinc and lead with some copper.

A total of 1,846.35 meters of diamond drilling was completed with 21 holes being drilled.

The drilling was divided over two separate target areas with 10 holes from two separate drill pads allocated to testing two areas within a graphitic argillite/limestone contact in the ALLCO area. Mineralized intersections encountered within the ALLCO area drill core consisted mostly of argentiferous galena, sphalerite and tetrahedrite hosted within quartz veins and breccias along a northwest-southeast fault that separates the limestones from the argillites.

A further 11 preliminary confirmation holes were drilled from a single drill pad designed to begin testing the underground structure associated with the historic 1971 resource (pre NI43-101 and therefore not compliant) reported for the past producing Regal/Snowflake mines. The Regal mine is located within moderately to gently, westerly dipping, graphitic phyllites/argillites of the lower Index Formation. Mineralization, hosted in quartz veins concordant with host rocks, consists of pyrite, galena, sphalerite, and locally with scheelite (lower levels), stannite (upper levels), and trace chalcopyrite/tetrahedrite throughout. Sulphides occur either as disseminations in the quartz, or as massive pods or bands parallel with slatey partings.

Robert Edwards, CEO of Affinity stated: “We are extremely encouraged to see such positive assay results from the 2019 drilling, our first drill program on the property. Our expectations were that the assays would show strong mineralization given what we have seen from our prior surface sampling program and the historical production grades, but to find this new 11 meter silver zone is truly exciting! These results set the backdrop for our 2020 exploration program which will target not only this new silver discovery but even more importantly, the two very large anomalies identified by the geophysics that may be the core deposits associated with all this surrounding mineralization. 2020 should be a very exciting year for Affinity.”

Significant intervals from the drill program are presented below:

ALLCO
Hole
No.
From
(m)
To
(m)
Interval
(m)
Ag
g/t
Cu
%
Pb
%
Zn
%
RP-19-0128.6729.090.42106.000.060.330.01
RP-19-01105.00106.001.0028.720.100.050.09
RP-19-0348.7048.770.07171.000.051.240.46
RP-19-0438.6441.002.36214.130.142.602.67
including38.6440.321.6862.550.080.250.16
and40.3241.000.68588.630.308.418.87
RP-19-0540.2543.002.7529.740.020.020.01
RP-19-0544.7545.510.7650.800.020.251.64
RP-19-0556.3356.780.4526.160.000.890.91
RP-19-0639.2643.294.0329.530.080.137.38
including42.0042.620.6217.900.040.024.12
and42.6243.290.67130.000.400.4140.14
RP-19-0649.7250.570.85129.020.030.040.32
RP-19-0738.3739.270.90182.000.130.300.32
RP-19-0743.7046.512.8149.210.020.340.78
including45.1046.251.1591.920.020.711.68
RP-19-0756.6157.420.8198.600.012.422.45
RP-19-0845.4445.940.5020.640.000.460.01
RP-19-0847.8452.274.43111.960.090.230.29
including49.2451.121.88238.200.190.510.50
RP-19-0857.5158.521.0145.700.000.050.03
RP-19-0867.8668.050.1985.240.021.210.11
RP-19-0882.4682.660.2011.390.000.320.01
RP-19-0884.8285.020.20568.000.550.080.18
RP-19-0944.4146.622.2128.700.020.150.13
RP-19-0946.6248.702.0831.700.020.471.12
RP-19-0948.7049.761.066.880.000.140.32
RP-19-1061.0072.1011.10143.290.040.620.50
including61.0067.816.81230.840.070.940.66
including61.0061.310.31122.000.034.185.04
and62.7263.270.552612.000.666.002.89
REGAL
Hole
No.
From
(m)
To
(m)
Interval
(m)
Ag
g/t
Cu
%
Pb
%
Zn
%
RP-19-119.149.380.2413.240.000.730.03
RP-19-1111.1415.794.6512.230.000.320.36
including15.3515.790.4452.470.001.202.89
RP-19-1158.4459.851.4124.850.010.770.25
RP-19-127.327.620.3040.020.000.690.02
RP-19-1211.2011.800.6039.640.000.950.25
RP-19-1211.9313.021.0935.900.010.890.79
RP-19-1213.8017.773.9726.000.000.590.25
including13.816.172.3739.780.000.900.30
RP-19-1260.1860.700.5212.280.000.070.96
RP-19-1313.7617.413.6525.380.000.580.48
including16.9117.410.50102.210.001.870.28
RP-19-1318.5719.050.4815.440.010.710.22
RP-19-1410.8911.180.2960.810.021.241.64
RP-19-1412.2812.840.5619.830.000.250.21
RP-19-1412.9913.340.3513.280.030.540.47
RP-19-1413.4913.820.3320.020.000.350.96
RP-19-1413.9314.220.2933.000.001.320.53
RP-19-1416.0416.310.2743.860.001.651.01
RP-19-1514.8815.380.5012.370.000.380.68
RP-19-1611.3011.880.5831.230.010.910.55
RP-19-1613.0713.800.7341.880.000.920.46
RP-19-1614.4815.320.8423.840.000.620.44
RP-19-1616.8817.800.9232.150.001.400.56
RP-19-1628.1328.290.164.990.020.022.21
RP-19-177.017.160.151360.000.0119.670.21
RP-19-1710.9411.690.7562.320.002.780.19
RP-19-1714.6415.470.8319.820.000.520.36
RP-19-1812.1213.411.2948.310.002.660.53
including12.1212.940.8270.500.004.020.53
RP-19-1815.9718.532.5613.020.000.331.43
including15.9717.411.4412.810.010.372.52
RP-19-1819.9220.520.6027.270.041.150.76
RP-19-196.007.001.0068.420.002.380.22
including6.006.300.30134.000.017.130.13
RP-19-1912.1317.685.5513.350.000.460.39
including15.8217.681.8630.830.001.170.78
RP-19-1929.9130.420.5122.880.021.220.89
RP-19-206.156.650.5046.470.011.750.13
RP-19-207.608.320.7233.370.000.500.19
RP-19-2012.0112.680.6721.510.010.670.49
RP-19-2015.2716.361.0918.630.000.480.43
RP-19-2017.2918.681.3910.520.000.340.62
RP-19-2028.0831.173.0958.780.000.350.33
including29.5230.220.70214.000.000.340.19
RP-19-219.059.560.5137.450.000.580.02
RP-19-2112.9813.820.8417.290.010.470.79
RP-19-2115.8917.271.3839.770.001.550.70
including15.8916.570.6876.500.003.070.31
and17.0017.270.271.840.000.062.27
RP-19-2130.4030.540.1446.830.000.310.16
RP-19-2131.8232.821.0061.100.013.391.49
RP-19-2172.0172.260.2577.110.000.620.02

Note: True widths are presently unknown.

Additional assay work is presently being conducted regarding Tin results in the drill core. Those results will be released once received and interpreted.


To view an enhanced version of this graphic, please visit:
https://orders.newsfilecorp.com/files/5458/54511_53b9ae91d42028a8_001full.jpg


To view an enhanced version of this graphic, please visit:
https://orders.newsfilecorp.com/files/5458/54511_53b9ae91d42028a8_002full.jpg

Photo description: Photos of 11.10 meter silver discovery intersection in Hole #10. Host rock is a limestone dissolution breccia/dolomitization breccia with weak to moderate silicification overprinting. Flooding this is milky quartz which hosts wispy veinlets of galena and blebby sphalerite at intersections of these or other veinlets.

As previously reported, the Corporation received assay results for 22 rock samples collected from surface outcrops in September 2019 from the Black Jacket and ALLCO areas of the property. Of the 22 grab samples collected, the majority contained bonanza grade silver, zinc, and lead with many samples reaching assay over-limits. The over-limit results for zinc and lead are reported in the table below (italicized) beside the original assay values. Assay values for tin, including high grade samples 11, 14 and 20 which were over-limit in the original assay report, are also presented in the last column of the table.

Sample NumberSample TypeSilver
g/t
Copper
%
Zinc
%
Lead
%
Gold
g/t
Tin
ppm
ALC19CR01grab0.0350000.4
ALC19CR02grab1300.41518.20>20.0 (35.69)0.7046.1
ALC19CR03grab120.232.034.9840.022.4
ALC19CR04grab131.089.026.1022.661.1
ALC10CR05grab16.7.295.060.0130.090.4
ALC19CR06grab74.9.144>30.00 (34.97).0590.282.6
ALC19CR07grab10.05.310.086.0290.040.5
ALC19CR08grab1870.49524.5>20.0 (31.90)1.85189.5
ALC19CR09grab88.1.077>30.00 (39.98)1.880.0832
ALC19CR10grab1545.17826.7>20.0 (28.67)0.68373
ALC19CR11grab2360.36616.80>20.0 (43.67)0.11900
ALC19CR12grab3700.6241.645>20.0 (71.14)3.14273
ALC19CR13grab964.71617.3017.50.11386
ALC19CR14grab3530.3501.945>20.0 (59.54)1.571600
ALC19CR15grab3670.0261.895>20.0 (77.01)0.33205
ALC19CR16grab1790.1075.28>20.0 (52.77)0.37146.5
ALC19CR17grab751.0696.4518.050.45107
ALC19CR18grab1065.718.178.5140.107.6
ALC19CR19grab2510.2995.58>20.0 (70.63)0.06167
ALC19CR20grab44102.2726.40>20.0 (21.56)5.684500
ALC19CR21grab47.5.177.048.0921.788.8
ALC19CR22grab87.7.095.011.0474.792.9

Property History & Background

The Regal Project hosts several past producing small-scale historic mines including the Regal Silver.

The property also hosts numerous promising mineral occurrences. From the historic records it appears that most, and perhaps all, of the known mineralized showings/zones have not been previously drilled using modern diamond drilling methods.

The geology of the Regal property generally consists of the Badshot and Lade Peak limestones, and argillites and phyllites of the Index Formation.

Snowflake and Regal Silver (Stannex/Woolsey) Mines

The Snowflake and Regal Silver mines were two former producing mines that operated intermittently during the period 1936-1953. The last significant work on the property took place from 1967-1970, when Stannex Minerals completed 2,450 meters of underground development work and a feasibility study, but did not restart mining operations. In 1982, reported reserves were 590,703 tonnes grading 71.6 grams per tonne silver, 2.66 per cent lead, 1.26 per cent zinc, 1.1 per cent copper, 0.13 per cent tin and 0.015 per cent tungsten (Minfile No. 082N 004 – Prospectus, Gunsteel Resources Inc., April 29, 1986). It should be noted that the above resource and grades, although believed to be reliable, were prepared prior to the adoption of NI43-101 and are not compliant with current standards set out therein for calculating mineral resources or reserves.

ALLCO Silver Mine

The ALLCO Silver Mine is situated 6.35 Kilometers northwest of the above described Snowflake/Regal Mine(s). The ALLCO Silver Mine operated from 1936-1937 and produced 213 tonnes of concentrates containing 11 troy ounces of gold (1.55 g/t), 11,211 troy ounces of silver (1,637 g/t) and 173,159 lbs of lead (36.9%).

Airborne Geophysics to Guide Future Exploration

An extensive airborne geophysics survey conducted by Geotech Ltd of Aurora, Ontario, for Northaven Resources Corp. in 2011, on the Regal Project identified four well defined high potential linear targets correlating with the same structural orientation as the Allco, Snowflake and Regal Silver mines. Northaven also reported that the mineralogy and structural orientation of the Allco, Snowflake and Regal Silver appeared to be similar to that of Huakan’s J&L gold project located to the north, and on a similar geophysical trend line. The J&L is reportedly now one of western Canada’s largest undeveloped gold deposits. Rokmaster Resources Corp. recently optioned the J&L property in a $44.2M deal and has renamed it the Revel Ridge Project. Rokmaster is presently working on expanding the current resource.

After completing the airborne survey, Northaven failed in financing their company and conducting further follow up exploration on the property and subsequently forfeited the claims without any of the follow up work ever being completed. Affinity Metals is in the fortunate position of benefitting from this significant and promising geophysics data and the associated targets.

The aforementioned Northaven airborne geophysical survey conducted at a cost of $319,458.95 in August of 2011 is described in The BC Ministry of Energy, Mines and Petroleum Resources Assessment Report #33054. The results of the survey are competently explained and illustrated by professionals on You Tube at: https://www.youtube.com/watch?v=GX431eBY_t0

Condor Consulting, Inc. who compiled the survey data and produced the original geophysics report was recently retained by Affinity in order to provide more detailed interpretations and potential drill target locations with the aim of testing two of the four main target areas in the future.

Earth Sciences Services Corp. (ESSCO) has also recently provided acoustical geophysics data for portions of the Regal property. This data is also being interpreted and analyzed with respect to future drill targets.

The Corporation is presently in the process of correlating and interpreting all of the historic and new geophysical and geochemical data as well as the 2019 drill results with the objective of further defining 2020 drill targets.

Affinity Metals has been granted a 5 Year Multi-Year-Area-Based (MYAB) exploration permit which includes approval for 51 drill sites.

Assay Procedure, Quality Assurance and Quality Control Procedures

All drill core samples were sent to MSA Laboratories in Langley, British Columbia for assay. Samples were analyzed by the following methods, as appropriate, to determine grades: ICP-130 35 element two acid digestion with ICP-AES finish, IMS-130 51 element two acid digestion with ICP-AES/MS finish, FAS-418 Ag 30g fire assay with gravimetric finish, determination of Ag, Cd, Pb, W, and Zn with four acid digestion and ICP-AES finish, determination of Pb and Zn by titration, and determination of Sn by Sodium Peroxide fusion with ICP-OES finish.

The Company employed a QA/QC program that was managed by a Qualified Person during the entire drill program. Blanks, duplicates (both pulp splits and 1/4 core), and two certified standard reference materials were used. These QA/QC samples were inserted at a rate of 1 every 10 to 15 samples.

Qualified Person

The Qualified Person for the Regal Project for the purposes of National Instrument 43-101 is Frank O’Grady, P.Eng. He has read and approved the scientific and technical information that forms the basis for the disclosure contained in this news release.

About Affinity Metals

Affinity Metals is focused on the acquisition, exploration and development of strategic metal deposits within North America.

The Corporation’s flagship project and present focus is the Regal.

On behalf of the Board of Directors

Robert Edwards, CEO and Director of Affinity Metals Corp.

The Corporation can be contacted at: [email protected]

Information relating to the Corporation is available at: www.affinity-metals.com

Why The Price Of Silver Could Skyrocket SPONSOR: Affinity Metals $AAF.ca $SII.ca $TUD.ca $GTT.ca $AMK.ca $OSK.ca $RKR.ca

Posted by AGORACOM at 8:59 AM on Tuesday, April 14th, 2020
This image has an empty alt attribute; its file name is Affinity_Metals_Corp_Logo.png

Sponsor: Affinity Metals Corp. (TSX-V: AFF) is a Canadian mineral exploration company building a strong portfolio of mineral projects in North America. The Corporation’s flagship property is the drill ready Regal Property near Revelstoke, BC where Affinity Metals is making preparations for a spring drill program to test two large Z-TEM anomalies. Click Here for More Info

By the mid-6th century BC, Darius the Great was ‘King of Kings’, ruling over the vast Achaemenid Empire.

By that time, gold and silver had already been in use by earlier civilizations for thousands of years.

There are cuneiform tablets that are nearly 4,000 years old from ancient Sumeria which record commercial transactions made in gold and silver.And subsequent civilizations – the Babylonians, Egyptians, Lydians, etc. all used gold or silver in commerce.But Darius had a unique idea. He borrowed the idea of minting gold and silver coins from the Lydians… but then established a fixed exchange rate between the two metals.

Darius decreed that one gold “daric” was worth 13.5 silver coins– one of the first examples in history of a fixed, bimetallic standard.

His idea caught on. And for thousands of years afterward, later civilizations established a fixed gold/silver ratio.

In ancient Greece during the age of Pericles, gold was valued at 14x silver. In ancient Rome, Julius Caesar valued gold at 12x silver.

It remained this way for centuries.

Even in the earliest days of the United States, eighteen centuries after Caesar, The Coinage Act of 1792 established a ratio of 15:1.

(According to the law, one US dollar is supposed to be 24.1 grams of silver, or 1.6 grams of gold. So those pieces of paper in your wallet are not dollars– they are technically “Federal Reserve Notes”.)

In modern times there is no longer a fixed ratio between gold and silver, though its long-term average over the last several decades has been between 50:1 and 80:1.

This is a lot higher than in ancient times… but the circumstances are obviously different.

Today, gold is still widely used as a reserve by central banks and governments around the world.  And investors still buy gold as a hedge against inflation and uncertainty.

Silver, on the other hand, has countless industrial applications; it’s a critical component in everything from mobile phones to automobiles to solar panels.

Like gold, silver is also a hedge against inflation and uncertainty.

But silver’s demand fundamentals are more heavily influenced by overall economic health. If the economy is in recession, silver prices can fall because there’s less demand from industry.

Gold, on the other hand, doesn’t follow that pattern. In 5 out of the last 6 recessions, in fact, gold has increased in price.

That’s why recessions, and extreme turmoil, can lead to a massive spike in the gold/silver ratio. Gold goes up, and silver stays flat (or falls).

  • Just prior to World War II as Hitler launched his invasion of Poland, the ratio spiked to 98:1.
  • In 1991 as the first Gulf War began, the ratio again reached 100:1.
  • Today we’re back again in that territory; as of this morning, the ratio is 110:1, and it’s been as high as 120 or more in recent weeks

Source: MacroTrends.net

Now, there are very few things about this pandemic that we can be certain about.

Things that were unthinkable even a month ago are now part of our daily lives. And so as I’ve written over and over again, EVERY possible scenario is on the table right now.

But one thing that does seem very clear is that central banks around the world are going to print an extraordinary amount of money.

Many of them already have.

The Federal Reserve in the US, for example, has already expanded its balance sheet to SIX TRILLION DOLLARS.

That’s a nearly 50% increase from last month. And they’re just getting started.

Why does something so mundane as a central bank balance sheet even matter?

Because a rising balance sheet means they’re conjuring trillions of dollars out of thin air to bail everyone out.

This is the way they solve problems: they print money and debase the currency, something that policymakers have been doing for thousands of years.

But you can only get away with doing that a limited number of times before the currency starts to lose value.

We don’t know how long it will last, how much destruction it will cause, or what the world will look like once this is over.

But we can be pretty sure that central banks are going to print a ridiculous amount of money, and that governments will go into a ridiculous amount of debt.

They’ve told us this much. And they’ve already started to do it. So this seems pretty obvious.

The price of gold is up significantly over the last several months, and since the start of this crisis.

But the price of silver has declined… leading to a record-high gold/silver ratio.

This ratio may stay elevated for a while, or even go higher.

But in the past, the ratio has always returned to more traditional levels. Always. Even when the world was facing Adolf Hitler or the Great Depression.

So it stands to reason that, if they keep printing money (which they already are), and the ratio eventually returns to its historical range, the price of silver could really skyrocket.

We’ll spend some time this week talking about some interesting ways to take advantage of this.

SOURCE: https://www.zerohedge.com/commodities/why-price-silver-could-skyrocket

Bullion Bank Nightmare as LBMA-COMEX Spread Blows Up Again SPONSOR: Affinity Metals $AAF.ca $SII.ca $TUD.ca $GTT.ca $AMK.ca $OSK.ca $RKR.ca

Posted by AGORACOM at 4:04 PM on Monday, April 13th, 2020
This image has an empty alt attribute; its file name is Affinity_Metals_Corp_Logo.png

Sponsor: Affinity Metals Corp. (TSX-V: AFF) is a Canadian mineral exploration company building a strong portfolio of mineral projects in North America. The Corporation’s flagship property is the drill ready Regal Property near Revelstoke, BC where Affinity Metals is making preparations for a spring drill program to test two large Z-TEM anomalies. Click Here for More Info

  • The gaping price differential between spot gold and gold futures that has been plaguing the paper gold markets in London and New York for the last three weeks shows no signs of abating and is continuing to flare up.

In essence, the contango phenomenon we are seeing is one of gold futures prices trading far above spot gold prices, a sign of liquidity problems in the London gold market and a signal that something is completely broken between the world‘s two predominant â€œgold price discovery” trading venues – which both, by the way, trade paper gold. As a reminder, London LBMA trades unallocated gold over the counter (OTC), a form of synthetic fractional gold derivative. The vast quantities of unallocated gold which are traded in London are then netted and cleared in an electronic clearing engine called Aurum by 5 LBMA bullion banks that comprices London Precious Metals Clearing Limited (LPMCL), namely JP Morgan, HSBC, UBS, Scotia, and ICBC Standard Bank). Allocation of physical gold is a totally separate process beyond clearing in Aurum

COMEX trades predominantly cash-settled gold futures contracts on exchange and facilitates the trading of these contracts bilaterally. COMEX futures are 99.9% cash-settled and even those that result in delivery really result in warehouse warrants changing hands but the gold staying in the New York vaults of JP Morgan, HSBC and Scotia.

That the wide-open spread continues to persist is even more remarkable, despite the best efforts of the London Bullion Market Association (LBMA), CME Group (operator of COMEX) and the powerful London-New York bullion bank syndicate to throw all they have at the problem.

At the time of writing, spot gold was trading at US$ 1696 against US$ 1753 for the front-month (most actively traded) COMEX gold futures contract, a $36 spread with futures over 3.44% over spot. The spread we‘re referring to can be seen in the below 3-day chart, which plots June 2020 gold futures (red and green line) against spot XAUUSD (blue line) from 6 April to 8 April. Notice that over this time the futures price has stayed far above spot, and more importantly, it has persistently done so.

3 day chart of COMEX gold futures price (June 2020) versus LBMA spot gold price, 6 – 9 April 2020. Source: www.barchart.com

The spot-futures spread blow out that has been running into its third week now can vividly be seen by zooming out and looking at a similar chart but this time from 24 March until 9 April, the first day that the price spread between London and New York gaped open. Notice the big gaps between futures and spot over 24-25 March, the persistence of the gap over the remainder of the week, and the subsequent re-explosion of the divergence since early April, particularly over the last few days.

COMEX gold futures price (June 2020) versus LBMA spot gold price; Source: Bloomberg


Three Weeks and Counting

Its instructive to review a short timeline of some of the events which have contributed to this ongoing saga over the last three weeks, because it shows that no matter what the LBMA and CME do, the spread between London and COMEX continues to stay out there.

Week 1

23 March – COMEX gold futures (April contract) begin trading noticeably above LBMA bullion bank spot gold prices.

24 March – Spreads between COMEX futures and London spot blew out to $100 at one point during the day, while bid – ask spreads within London spot widened substantially.

24 March – Rumors in the gold market suggested that bullion banks that were required to deliver physical gold for COMEX Exchange for Physical (EFP) transactions failed to do so, suffered losses and exited the market, and that this caused the Spread between COMEX and London to widen substantially.

The bullion bank controlled LBMA releases its first control statement, deflecting attention away from London, saying it will help (essentially collude with) the CME-COMEX in the gold market – The official language is that the LBMA â€œis working closely with COMEX and other key stakeholders to ensure the efficient running of the global gold market.”

Note – Who are these other key stakeholders, what do they mean by efficient running, and what gives them the right to think they can â€œrun“ the global gold market?

24 March – LBMA and its bullion banks pressure CME to launch a gold futures contract with a deliverable clause in London 400 oz gold bars.

24 March – At end of day, CME announces the launch of a new gold futures contract that can theoretically deliver 400 oz bars, 100 oz bars and kg bars but that uses a fractional paper concept called Accumulated Certificates of Exchange (ACEs) to divide 400 oz deliverable bars into 100 oz bars, and that critically includes all refiner brands on the LBMA Good Delivery List (current and former Good Delivery refiners). This contract will be called 4GC (See here and here).

See BullionStar article “LBMA colludes with the COMEX – To lockdown the global gold market?” for background to the above.

25 March until end of March – For the rest of the week, disinformation from bullion banks to mainstream media about flight cancellations and refinery closures preventing bullion banks delivering gold from London to New York thus causing prices on COMEX and London to diverge. See hereherehere and here for examples. From the below chart you can see that there is never any gold exported from London to New York.Gold imports in the USA, 2019. US DOES NOT import gold from the UK, despite what Reuters parrots without checking facts. Source: www.GoldChartsRUs.com


Week 2

30 March – CME published its daily gold vault stocks report (for Friday 27 March) with a new category for “400 oz AND eligible brands”, but with all vaults showing zero stocks of 400 oz gold bars. And notably, that the JP Morgan vault in New York had zero holdings.

30 March – When Bullionstar draws attention to this new CME vault report,  in “COMEX can’t find a 400 oz bar for its new 400 oz gold futures contract“, the CME then deletes the new report from its website on the morning of 31 March,  and replaces it intra-day with a report which reverted to the original version.

1 April – LBMA and CME publish an unprecedented second control statement titled “LBMA and CME group comment on healthy gold stocks in New York and London”, saying that “CME Group and LBMA..will continue to coordinate efforts as market circumstances evolve”. See “LBMA and COMEX try to Reassure the Market – Twice in One Week“ for background.

Note – If LBMA and CME are trading gold bars, why would they need to coordinate efforts, and more importantly, coordinate efforts to what end?

LBMA disingenuously refers to 8326 tonnes of gold in London, a figure that is from 3 months ago, and nearly all of this total tonnage is central bank gold, gold held in ETFs, and allocated gold held by other investors. The real float of physical gold in the london LBMA gold vaults controlled by the LBMA bullion banks is less than 1000 tonnes and some estimates from sources in the bullion banks say it could be between 300 and 500 tonnes.

In the same statement, CME refers to 9.2 million ozs ( 287 tonnes) of gold held in its approved vaults, with irrelevant claims that 5.6 million ozs of this is eligible gold. Eligible gold is gold which just happens to be in the form that satisfies the deliverable unit of the contracts (1 kg bars or 100 oz bars). The rest of this figure is registered gold, which already has warehouse warrants attached.

2 April – The spread between COMEX gold futures prices and London spot gold prices starts to gap up strongly again.

Rest of week – CME Group releases publicly a PowerPoint slide presentation titled â€œPrecious Metals Physical Delivery Process”, which includes the new 4GC contract and explains how to get an electronic warrant if standing for delivery of COMEX gold futures contracts, but that explains nothing about withdrawing gold from the COMEX vaults.

The COMEX presentation also features a slide discussing the COMEX New York approved vaults but unbelievably instead of showing photos of one of its approved New York vaults, this slide contains photos of a HSBC gold vault in London showing gold bars belonging to the exchange traded fund, the SPDR Gold Trust (GLD). This GLD gold has nothing to do with COMEX gold vaults in New York (or does it?).

COMEX presentation slide uses photos of a HSBC gold vault in London featuring SPDR Gold Trust gold bars

Week 3

6 April – The spread between the COMEX June gold futures contract and the LBMA spot gold price blows out again very widely to over $80 at one point in the day.

6 April – CME adds back the category “Enhanced Delivery (400 oz AND eligible brands)” to its New York daily vault report. Of the 9 vaults on the report, 5 have 0 holdings in this 400 oz category, 2 (Brinks & Loomis) have a combined 2 tonnes, HSBC claims 21.5 tonnes, JP Morgan appears for the second time, claiming 126.8 tonnes. The first time being 30 January when JP Morgan was listed as having zero tonnes of 400 oz bars.

Note – “400 oz AND Eligible Brands” will be the subject of another article soon, but for now it means as follows. For the new 4GC contract, CME added all LBMA Good Delivery gold bar Brands (Current and Former) as Eligible brands. That’s 68 brands from the existing GC100 contract + 71 brands from the LBMA current Good Delivery List  + another 113 LBMA former Good Delivery List As another aside, where did the JP Morgan New York vault suddenly get 126.8 tonnes of gold suddenly to add to Eligible category for the COMEX 4 GC contract? Was this 126.8 tonnes of gold suddenly shipped in to the JP Morgan vault from London? Hardly. Were 126.8 of London Good Delivery gold bars already sitting in its New York vault. Probably not as its London and not New York which is the center of 400 oz gold bar storage. Was there some type of gold swap involved between London and New York. Possibly.

Another intriguing possibility is that now that former LBMA Good Delivery List gold bars are eligible for the new 400 oz contract, that JP Morgan borrowed Old US Assay Office gold bars from the New York Fed (their two gold vaults are beside each other), and then added these to the Eligible category for the new 4GC gold contract.

Root Cause of Spot vs Futures Gold Price Discrepancy

So what is the cause of this dislocation in pricing between the lower ‘spot’ price and the higher ‘futures’ price, i.e. between the London LBMA gold spot market and the New York COMEX gold futures market? The answer in general is that the problem is with the spot price. And where is the spot price? London.

Ironically, the LBMA bullion banks are trying to shift the attention away from London, when London is exactly where the problem is. The spot price problem appears to be due to liquidity problems of the LBMA market makers in London where they are suspicious of trading with each other. This is despite the fact that these LBMA market makers are obliged to constantly make a market and offer two way price quotations to each other. These market makers are BNP Paribas, Citibank, Goldman Sachs, HSBC, ICBC Standard, JP Morgan Chase, Merrill Lynch, Morgan Stanley, Standard Chartered, Bank of Nova Scotia, Toronto-Dominion and UBS.

The spot price problem has nothing to do with air travel cancellations or shipments of 100 oz gold bars from London to New York. These market makers do not make markets in physical gold. The unit of trading in London is not real gold anyway, its unallocated gold or gold credit which is issued by a bullion bank and which has counterparty risk.

Something has spooked these market makers and caused a drop in liquidity in the London market. These banks, which normally trade with each other, now do not want to trade with each other due to heightened counterparty risk. Unallocated trading volumes in the London gold market have fallen over the last three weeks. See chart below.LBMA – Unallocated gold trading volumes, week-to-week, last 4 weeks to 5th April. Source: www.lbma-i.com

Likewise, according to Bloomberg, COMEX gold futures trading volume last week was 80.6 million ounces, a 72% drop compared to the end of February. From the same Bloomberg article, there is an intriguing and obviously dramatic quote from commodities broker Marex Spectron, saying:

“You have a bunch of shell-shocked market makers who are literally hiding under their desks and do not and possibly can not make markets in any size, shape or form,” said David Govett, head of precious metals trading at Marex Spectron. “Hence we have the lack of liquidity, the small volumes and the wide spreads.”

Marex is a broker for EFPs, so maybe the LBMA market makers are not answering calls. Then they are failing in their duty and obligations as market makers. But why would market makers not want to trade and how does this relate to EFP spreads? If banks suffered EFP problems and then the EFP spread between London and New York blew up, and then they use the excuse that the EFP spread is too large for them to make a market in spot because they don’t want to take on risk, then that’s just circular logic and a pathetic excuse. But what causes LBMA market makers to become shell shocked and literally hide under their desks?

Could it be that the gold trading activities of some of these LBMA bullion banks have blown up and they have ceased their market making activities, but have not publicly stated this, and covered it up? Stranger things have happened. All the while, as trading volumes continue to fall in the paper gold markets of London and New York, the opposite is the case in physical gold markets, where BullionStar and other bullion dealers – those that continue to have inventory – see unprecedented demand and increasing trading volumes.

SOURCE:BullionStar.com website with the same title “Bullion Bank Nightmare as LBMA-COMEX Spread Blows Up Again“.

Gold and Silver Mines Closed as Physical Silver Becomes “Most Undervalued Asset” SPONSOR: Affinity Metals $AAF.ca $SII.ca $TUD.ca $GTT.ca $AMK.ca $OSK.ca $RKR.ca

Posted by AGORACOM at 11:48 AM on Monday, April 6th, 2020
This image has an empty alt attribute; its file name is Affinity_Metals_Corp_Logo.png

Sponsor: Affinity Metals Corp. (TSX-V: AFF) is a Canadian mineral exploration company building a strong portfolio of mineral projects in North America. The Corporation’s flagship property is the drill ready Regal Property near Revelstoke, BC where Affinity Metals is making preparations for a spring drill program to test two large Z-TEM anomalies. Click Here for More Info

  • Production of scarce assets such as precious metals and an array of commodities is likely to fall off a cliff.
  • The current supply and demand dynamic in most raw materials is both unprecedented and unsustainable.

A surge in coronavirus cases, an expansion of economic lockdowns, and an explosion in unemployment claims hit markets this week.  But this deluge of bad news didn’t seem to catch investors by surprise.

Instead of crashing to new lows, the stock market held within a trading range and rallied yesterday following the release of a horrific jobs report. 

It’s been a huge week for commodity markets as oil prices posted their biggest single day percentage gain ever Thursday, popping more than 25%.  Oil prices lifted from their severely depressed $20 per barrel level after President Donald Trump met with oil executives and announced Russia and Saudi Arabia would agree to curtail production.

Turning to the precious metals, volatility finally tamped down a bit after three straight weeks of some of the wildest moves we’ve ever seen in both the spot market and the bullion market. 

With so many disruptions and dislocations now hitting the economy, investors have to ask themselves: What is truly sustainable?  A great many businesses won’t be around after this global pandemic finally recedes.  Entire industries will never be the same.  And so many families will be financially wiped out.

Government “stimulus” may well prevent politically favored companies from going under.  But at the cost of putting federal spending and borrowing on an even more unsustainably steep trajectory. 

While there is no limit to how much currency the Federal Reserve can create to prop up the government and the entire financial system, there are limits to the U.S. dollar’s credibility as a store of value. And they are likely to be tested as the currency supply accelerates upward.

At the same time, production of scarce assets such as precious metals and an array of commodities is likely to fall off a cliff.  The current supply and demand dynamic in most raw materials is both unprecedented and unsustainable. 

The big story we have been told with regard to crude oil is pandemic-driven demand destruction.  The global oil market is seeing demand contract by up to 25 million barrels per day as economies remain virtually shut down.

To make matters worse for oil producers, Russia and Saudi Arabia had been flooding the world with more output. They drove crude prices down so low that the entire North American shale industry, which was already reeling, now faces the prospect of being driven out of business.

In the first quarter of 2020, oil prices suffered a 66% crash – a record drop for a single quarter – settling right around $20 per barrel.  At that price, nearly the entire energy sector is unsustainable.  From the frackers to the deep-sea drillers to even the more conservatively positioned diversified energy giants, $20 oil simply doesn’t work.

Until oil prices get back above $40, the only way some of these companies can hope to survive is by drastically shrinking their operations.  Wells are being capped.  Industry analysts anticipate a 70% drop in U.S. drilling over the coming months.

At the same time, demand is also expected to recover from current levels.  Although energy use will increase gradually at first as sections of the economy reopen, demand can increase a lot faster than supply – especially when that demand is being accelerated by $6 trillion in federal stimulus so far, and likely even more ahead.

Similar supply and demand pressures face the base metals and precious metals mining industries.  Multiple mines around the world – from South Africa to South America – are currently shuttered due to the coronavirus.


Even before the pandemic, the mining industry was in distress due to low market prices for metals.  First Majestic CEO Keith Neumeyer had determined it made more business sense for the company to hold onto its silver assets rather than sell them into the market at extremely depressed prices.

This year could see a record decline in mining supply for silver and other metals.  And while the crude oil market entered the year with a supply glut that has only continued to grow, silver and palladium in particular were headed for supply deficits.  Although industrial demand is currently way down, when it does recover, it will be difficult to see how those deficits don’t widen and perhaps lead to price spikes.

Analyst and MoneyMetals.com contributor Steve St. Angelo expects investors will continue to seek precious metals for financial security during this pandemic and its aftermath.  But there may simply not be enough gold and silver above ground to go around – not at current prices, anyway. 

And here are some of Steve St. Angelo’s thoughts from a video presentation he posted earlier this week:

Steve St Angelo: 

As a lot of large cities in the US and around the world, and countries are on lockdown and they’re going to continue to be unlocked down. I believe the US now according to Trump, is on lockdown till the end of April. That’s another month. This is really going to damage the system and so we’re going to get into a financial storm in the next several months. So, I believe the precious metals, you’re going to see a lot more investors move into the precious metals and there just won’t be the supply.

I believe we’re going to see serious trouble with the bond market in the next month or so. And that’s going to cause trouble with actual bank accounts, the money market accounts, all the money… the digits that are held in the commercial banks, and then as well as the fiat money, the currency in circulation. So right now, the total gold value, and this is identifiable above ground investment stocks, central bank and private is valued about $4 trillion. Compare that to the base money supply, which is about $28 trillion. That’s seven times more than all the gold. Now, get silver, total silver value is only $40 billion. It’s 100 of the gold. Again, to me, I believe the most undervalued asset is physical silver, and we’ll start to see that in the future as more and more investors move into silver to protect wealth.

Retail investors in precious metals across the globe seem to agree that silver is the asset to own at current prices.  Supply of minted coins, bars, and rounds have all but disappeared in the past three weeks.

SOURCE: http://news.goldseek.com/GoldSeek/1585943940.php

BMO Hikes #Gold Forecast; Prices ‘Natural Beneficiary’ of Low interest Rates SPONSOR: Affinity Metals $AAF.ca $SII.ca $TUD.ca $GTT.ca $AMK.ca $OSK.ca $RKR.ca

Posted by AGORACOM at 8:03 PM on Thursday, April 2nd, 2020

This image has an empty alt attribute; its file name is Affinity_Metals_Corp_Logo.png

Sponsor: Affinity Metals Corp. (TSX-V: AFF) is a Canadian mineral exploration company building a strong portfolio of mineral projects in North America. The Corporation’s flagship property is the drill ready Regal Property near Revelstoke, BC where Affinity Metals is making preparations for a spring drill program to test two large Z-TEM anomalies. Click Here for More Info

BMO Capital Markets upgraded its forecast for gold prices Wednesday while downgrading the outlook for many other commodities.

BMO sees gold averaging $1,660 an ounce in the second quarter and rising to $1,700 in the fourth. The bank’s full-year forecast is now at $1,654, increasing to $1,698 next year.

The bank looks for silver to average $15.50 an ounce in the second quarter, then $18.50 in the next two quarters, with a full-year average of $17.18. The 2021 outlook was put at $18.05.

A previously expected global economic and industrial recovery in 2020 has been “stopped in its tracks” by the COVID-19 pandemic, BMO said. Businesses are shutting down around the world to slow the spread of the virus. As a result, the bank now expects a 0.8% contraction in global industrial production this year, the first slowdown since 2009.  â€œAnd as a result, we have revised down our 2020 outlook across many of the commodities we cover, while pushing gold expectations higher,” BMO said.

Nevertheless, prices for all commodities – with the exception of iron ore – are likely to be higher next year, as supportive government stimulus efforts take hold, BMO said.

“We see gold as a natural beneficiary of even lower global interest rates and its safe-haven status should receive another airing in 2020,” BMO said. “Meanwhile, we see silver as not only hanging on gold’s coattails, but also potentially outperforming should governments move towards fiscal spending on 5G and solar technology.”

Analysts pointed out that after the 2008 global financial crisis, gold and silver prices recovered months ahead of the global industrial economy.

Meanwhile, BMO said the platinum and palladium markets are likely to be volatile with both weaker auto sales and supply. However, since palladium stocks are already low, another price rally is likely when the auto industry restarts, BMO continued.

Platinum is seen averaging $950 an ounce in the second quarter and $1,000 in the fourth, with a full-year forecast of $971. Palladium is seen averaging $2,500 in the second quarter but falling to $2,250 in the fourth for a full-year average of $2,313.

BMO said its biggest downward revision to commodity prices in 2020 was in copper, but the outlook for other base metals was also lowered, including aluminum, zinc and nickel. These are all industrial metals. Copper is seen averaging $2.27 a pound in the second quarter and $2.33 for the full year.

Source: https://www.kitco.com/news/2020-04-01/BMO-hikes-gold-forecast-prices-natural-beneficiary-of-low-interest-rates.html

A Historical Perspective on Silver SPONSOR: Affinity Metals $AAF.ca $SII.ca $TUD.ca $GTT.ca $AMK.ca $OSK.ca $RKR.ca

Posted by AGORACOM at 3:04 PM on Tuesday, March 31st, 2020
This image has an empty alt attribute; its file name is Affinity_Metals_Corp_Logo.png

Sponsor: Affinity Metals Corp. (TSX-V: AFF) is a Canadian mineral exploration company building a strong portfolio of mineral projects in North America. The Corporation’s flagship property is the drill ready Regal Property near Revelstoke, BC where Affinity Metals is making preparations for a spring drill program to test two large Z-TEM anomalies. Click Here for More Info

When we don’t understand the present, we can turn to the past. It is believed the natural ratio in the earth’s crust is ~10 ounces of silver for one ounce of gold.

Back in 3000 BC in Mesopotamia (modern day Turkey, Iraq, Iran), silver and gold were used to enable trade at a rate of 5 ounces of silver to 1 ounce of gold. For about 2,000 years, from 1670 B.C. to 432 AD, the rate was between a low of 9 to 1 in 59-44 BC to a high of 18 to 1 in 422 AD.

For the next 1,000 years from 527 to1453, the price was roughly 15 to 1. For the next three centuries the ratio was a low of 10.75 to 1 to a high of 15.52 to 1.

When the United States passed its first coinage law in 1792, the ratio was fixed at 15 to 1 but at that rate gold was considered undervalued and disappeared from circulation, so to correct the situation Congress moved the ratio to 16 to 1 in 1834.

At that rate gold was slightly overvalued and silver undervalued and silver coins began to disappear and were dropped from the list of coins by the Act of February 12, 1873, or the “Crisis of 1873,” and so thereafter the U.S. was on the Gold Standard, which became law in the Gold Act of March 14, 1900. (Hint: two 60 year cycles to today).

In 1919 the ratio was 15.20 to 1; by 1932 the ratio was up to 72.27 to 1 or about five times.

John Newell is a portfolio manager at Fieldhouse Capital Management and president and CEO of Golden Sky Minerals Corp. He has 38 years of experience in the investment industry acting as an officer, director, portfolio manager and investment advisor with some of the largest investment firms in Canada. Newell is a specialist in precious metal equities and related commodities and is a registered portfolio manager in Canada (advising representative)

https://www.streetwisereports.com/article/2020/03/30/an-historical-perspective-on-silver.html