Agoracom Blog Home

Posts Tagged ‘#Discovery’

Crescat Turns Activist on #Gold SPONSOR: Labrador Gold $LAB.ca $RIO.ca $WHM.ca $SIC.ca $NXS.ca $NVO.ca

Posted by AGORACOM at 10:00 AM on Monday, June 22nd, 2020

SPONSOR: Labrador Gold – Two successful gold explorers lead the way in the Labrador gold rush targeting the under-explored gold potential of the province. Exploration has already outlined district scale gold on two projects, including a 40km strike length of the Florence Lake greenstone belt, one of two greenstone belts covered by the Hopedale Project. Recently acquired 14km of the potential extension of the new discovery by New Found Gold’s Queensway project to the south. Click Here for More Info

Dear Investors:

The US stock market should not be trading anywhere close to the multiples it is today given the enormity of the macro events that have already unfolded this year:

  • US and Iran being on the brink of war in January with still unresolved problems.
  • The virus pandemic that now has an incredibly high probability of a 2nd wave unfolding.
  • The steepest economic downturn in US history.
  • Front-month crude oil prices turning negative in April.
  • 20 million of unemployed Americans enjoying a temporary boon of Federal unemployment benefits under the CARES Act, a program that expires at the end of July.
  • The savings rate shot up to 33% in April, the highest monthly level ever. A new trend in consumer savings versus spending will be a major drag on the overly anticipated recovery.
  • Government debt outstanding has increased by $2.5 trillion so far this year with the deficit doubling from 5 to 10% while corporate debt issuance is surging. Treasury debt alone has consumed all the money printing by the Fed.
  • The days for a US-China trade deal are long gone. Since the virus outbreak, relations have deteriorated yet again. The world’s two largest economies are firmly entrenched not just in a trade war but a new cold war.
  • Riots and protests have been breaking out nationwide in the US with race discrimination and wealth inequality at the core.
  • The latest Fed liquidity injections have divided the rich and poor to the highest levels since the Great Depression creating class warfare and heightened political conflict.
  • Conflicts between Beijing and Hong Kong, and even Taiwan, are heating up again with wealth inequality in China and Hong Kong even greater than the US.
  • Similar to China, Hong Kong suffers from a credit bubble of its own. Poor living standards for the bulk of Hong Kong’s younger population fuels its willingness to protest against the recent interventions by the China Communist Party. Hong Kong’s role as a global banking and trade hub is severely threatened by CCP interventions.

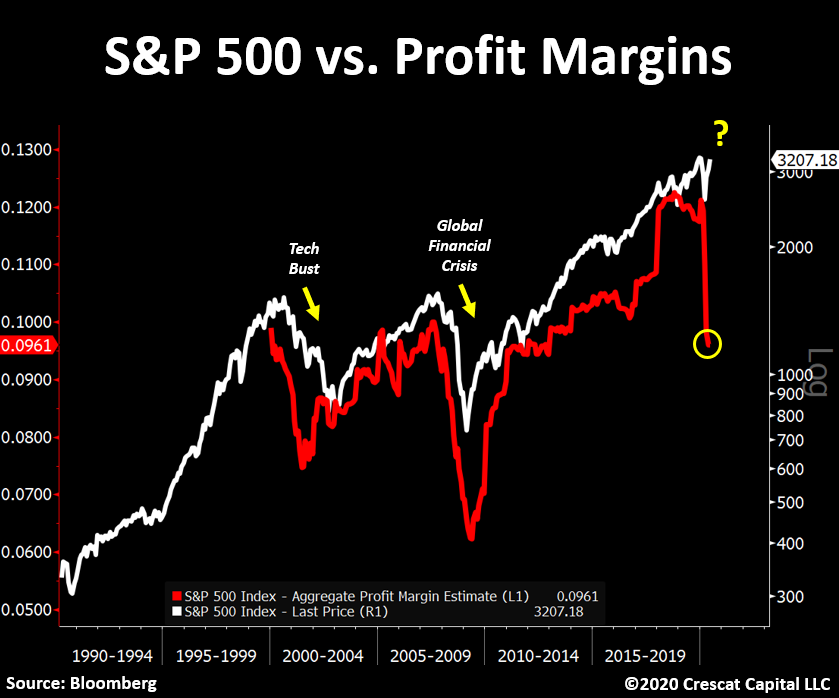
The chart below is a great illustration of how insanely disconnected equity prices are from their underlying fundamentals. S&P 500 profit margin estimates are plunging! “Buy the dip” investors are not paying attention and have simply been too eager to call the bottom.

At Crescat, we are focused on three major macro investing themes in our portfolios today:

  1. Record Overvalued US Stock Market

The US stock market is absurdly overvalued. In our analysis, the gap between current prices and discounted present value of likely future cash flows is the highest ever. Speculation is rampant and being championed by a bold new breed of Millennial day-traders. The mania is based on a widespread hope in Fed money printing. The catalysts for reckoning are numerous as a major cyclical economic downturn has only just begun. With too many afraid to tread there, the potential reward-to-risk tradeoff from shorting stocks is worthy of a significant allocation today. It is perhaps one of the best macro set-ups in US history to rotate out of overvalued stocks and into undervalued precious metals.

  1. New Precious Metals Bull Market

Crescat is working in concert with renowned exploration geologist, Quinton Hennigh, PhD on an exciting new activist investing campaign in the precious metals exploration industry which you can read about below. We are confident that a critical mass of investors will soon realize there is an alternative to buying over-valued US stocks with abysmal growth and profitability outlooks. Those who care about fundamentals can buy historically inexpensive precious metals instead with outstanding macro supply and demand drivers, especially for gold and silver mining companies. We believe we are in the early innings of a major new bull market for precious metals as a non-correlated macro asset class. There is good reason why gold and silver have served as hard money around the world for thousands of years. It is the same reason gold remains the most ubiquitous global central bank reserve asset on the planet. We expect the world’s sovereign treasury departments acting in their national interests to provide strong demand for gold in the current global economic downturn. Treasury departments must consider the value of owning government obligations of highly indebted economies with fiat money printing presses compared to the value of gold today.

  1. China Currency Bubble

With even greater non-performing domestic debt than the US and even greater poverty and wealth inequality, China is run by a totalitarian government responsible for running what in Crescat’s view is the largest banking and currency Ponzi scheme in world history. The inevitable if not imminent implosion of China’s financial system and economy only adds to our globally contagious economic downturn thesis and case for precious metals.

US Imbalances

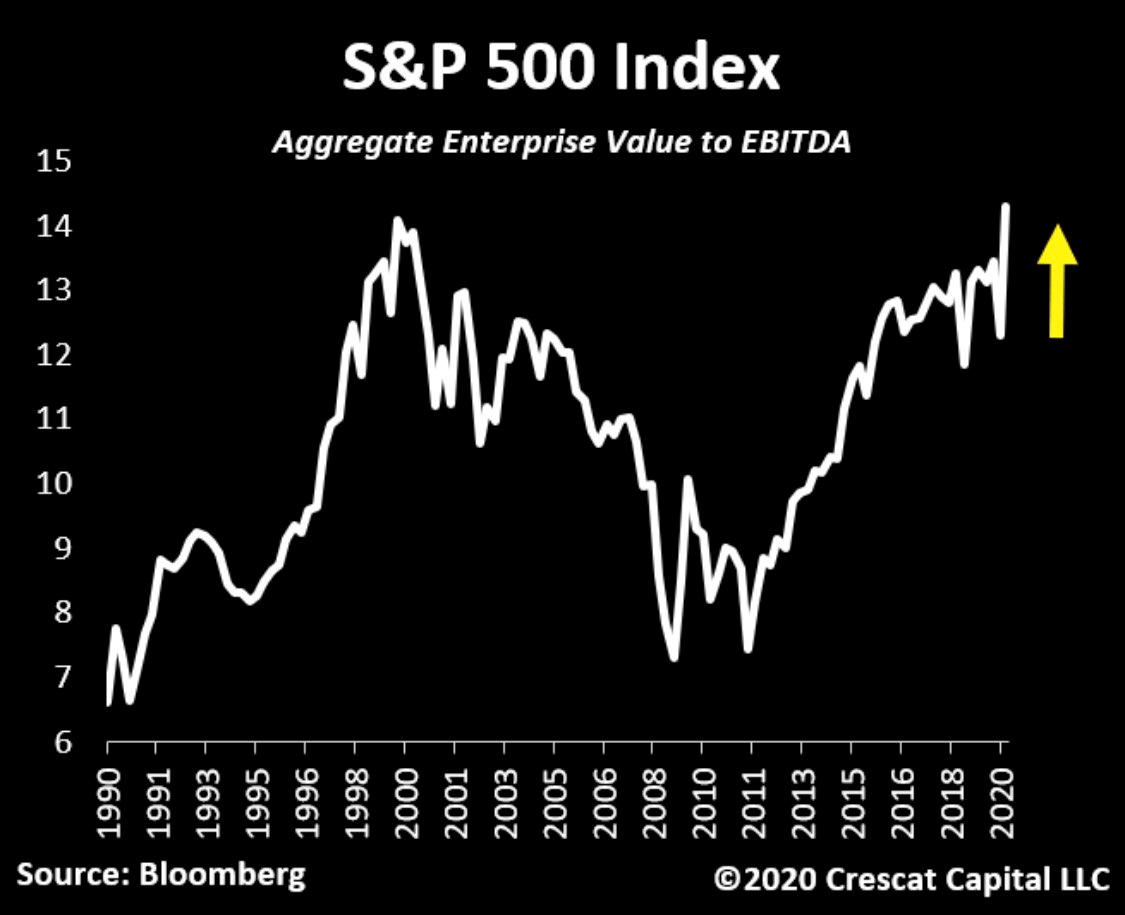
Aggregate enterprise value to EBITDA for the S&P 500 has never been higher. The set-up reminds us of early February when stocks were also grossly misaligned with economic reality. We think we are about to see another reckoning moment which will mark the second leg of the bear market.

Markets driven by euphoria never end well. The US stock market today is in la-la land. It is discounting a new expansion phase of the economy at the same time as a major recession has only just begun. Since the March lows, investors have turned overwhelmingly bullish. They are trusting that central banks’ liquidity will miraculously create economic growth rather than just temporarily ease the pain of declining gross domestic incomes and crushing debt burdens. This delusional thinking is induced by the intense but short acting dopamine response to Fed money printing but completely ignores how business cycles work. Government money printing has failed miserably, repeatedly, throughout history at eliminating recessions and frequently coincides with some of the worst downturns. Today, it is a major symptom of a severe recession if not a depression.

Ongoing government fiscal and monetary stimulus does not prevent economic downturns. To the contrary, such past actions are the moral hazard that is chiefly responsible for the imbalances that have built up over time already, the set-up for today’s recessionary environment in the first place. Brutal bear markets and recessions begin from record asset valuation bubbles and debt imbalances, and that is the case again this time. In our analysis, the current downturn has only just started and has much further to play out. Economic downturns are rarely halted and reversed by government intervention so early in the process. They must play out to bring the necessary creative destruction that sets the stage for a new economic expansion and bull market. That is how the business cycle works. We have not seen anything yet in terms of such a necessary downturn in equity valuations. We only had a brief taste of it in March, the first tremor. It has been followed by a massive, but overzealous relief rally.

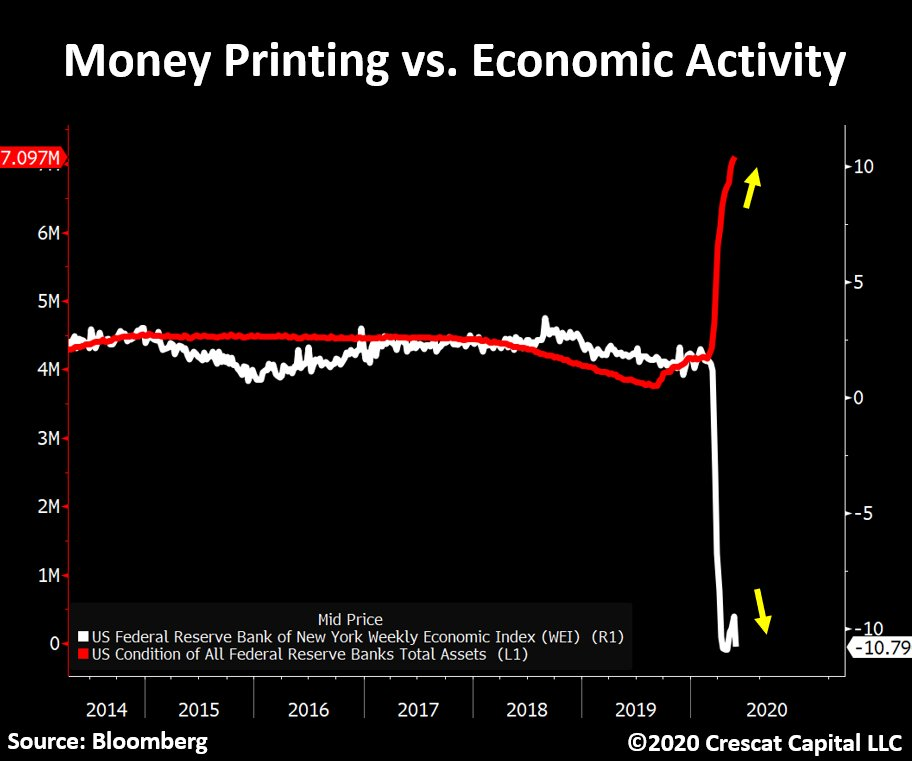
Money printing does not fix the economy. It is visually astonishing how divergent the Fed’s balance sheet assets and the Weekly Economic Index (WEI) has been. Developed by the Federal Reserve of New York, WEI measures activity by combining a series of other baseline indices such as same-store retail sales, consumer sentiment, initial jobless claims, temporary and contract employment, steel production, fuel sales, and even electricity consumption. The chart below shows clearly that this index hasn’t experienced any level of improvement since the March lows, a drastic comparison to the recent vertical growth in Fed’s assets.

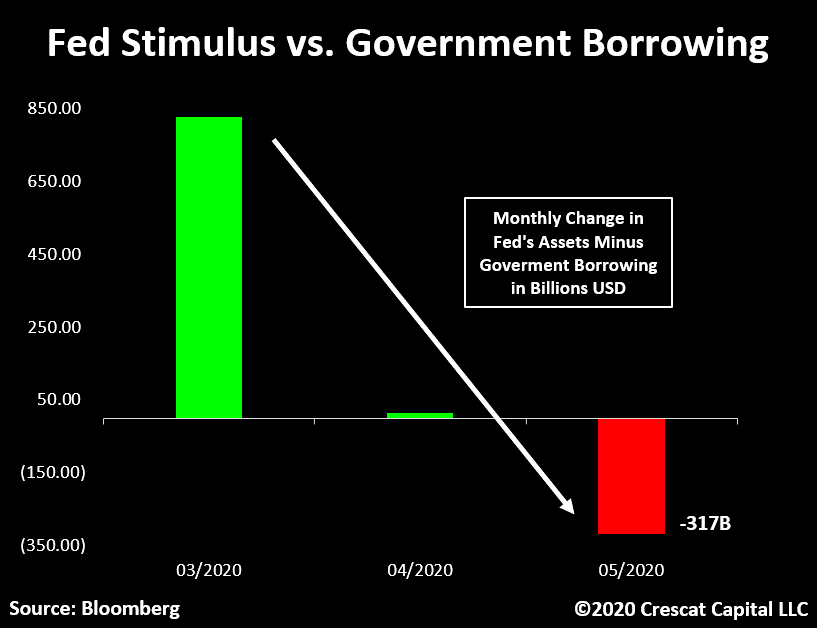
We are also seeing a significant liquidity withdrawal due to the historic debt imbalance today. The Fed’s weekly monetary stimulus has not only been drastically reduced but is also being dwarfed by the amount of government debt growth. We just had the largest monthly net issuance of Treasuries in history, $760B in May alone. This number surpassed the Fed’s quantitative easing by over $300B! It is the largest net decline in Fed assets vs. government debt since the repo crisis started back in September of 2019. The government debt is more than crowding out all the new liquidity.

In our view, the Fed is incapable of injecting enough liquidity to quell the losses in asset values associated with what was $250 trillion in global debt at a record three times global GDP before the Covid-19 crisis even began without also triggering a fiat money crisis. This is what we call a liquidity trap.

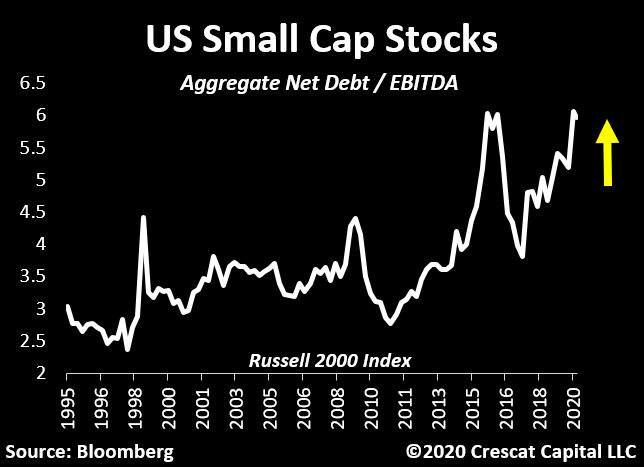
Another part of the market and economy that looks particularly fragile is small cap stocks. These stocks have never been so indebted relative to EBITDA. In terms of valuation, the Russell 2000 stocks now trade at a historic 15x EV to 2020 EBITDA estimates! There is a stunning and totally unwarranted level of optimism still priced into the markets today.

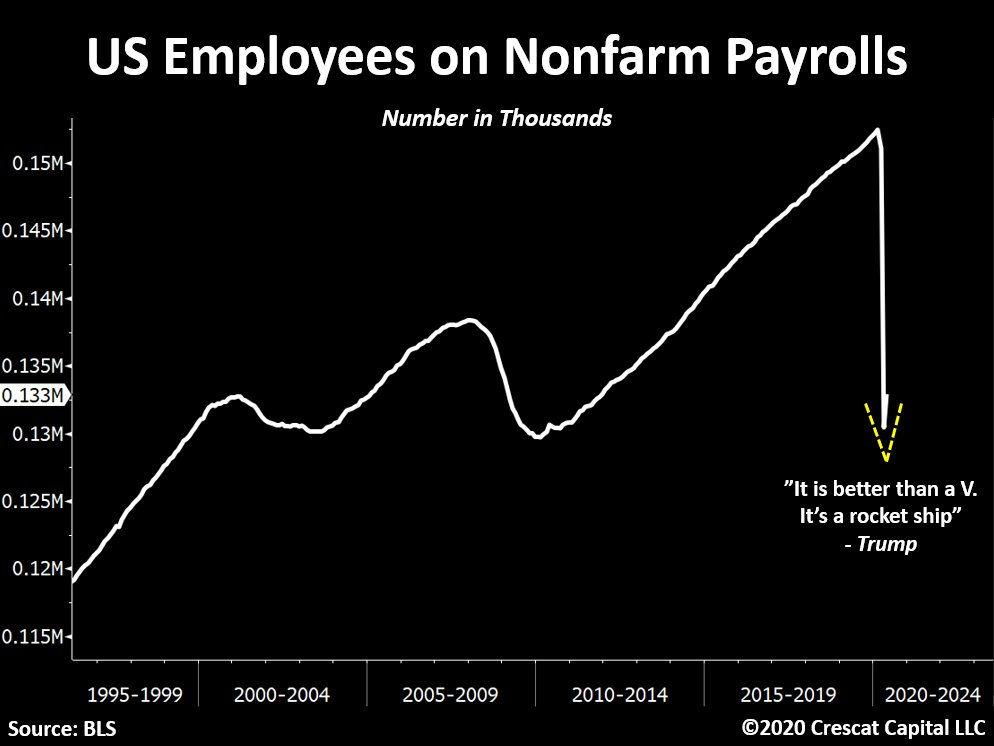
US labor markets unexpectedly improved last month but were not enough to support the bullish narrative of late. To put things into perspective, since the market peak we saw nonfarm payrolls drop by close to 22 million employees. May’s positive number, the best monthly change ever, was an improvement of close to 3 million payrolls, but even the Department of Labor questioned the validity of these numbers. The DOL said it believed the unemployment rate was understated in both April and May while May indeed did register improvement. In any case, we would need 7 months like the prior to regain the same level of strength in labor markets prior to the virus outbreak. The timid “V” shape recovery looks nothing like a “rocket ship” as Trump referred to in one of his recent tweets.

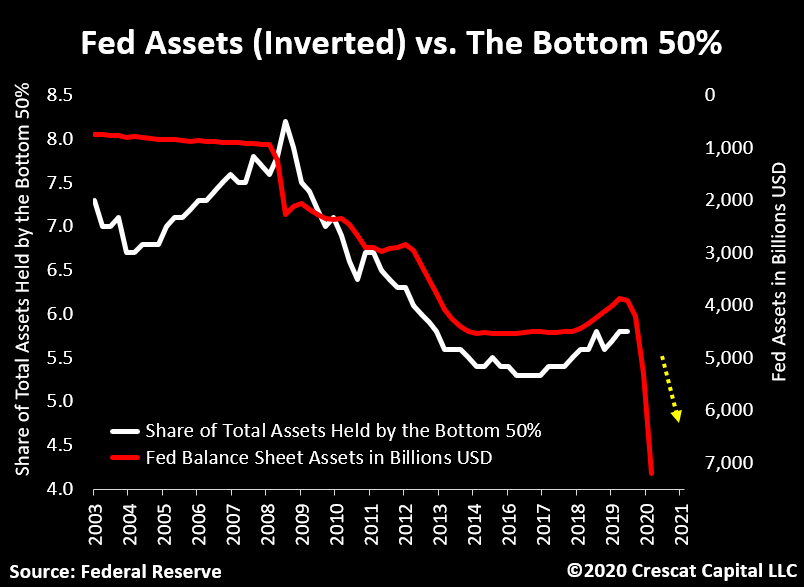
The current monetary stimulus is severely amplifying the wealth gap problem in the US. When inverted, the Fed’s balance sheet asset has followed the share of total assets held by the bottom 50% remarkably close. Logically, this relationship makes sense. As shown in the chart below, since QE 1 started, the less financially privileged parts of the society have suffered from a shrinkage of wealth relative to the overall pie. If the economy continues to prove incapable of growing organically, further monetary stimulus will be necessary and therefore only exacerbating the inequality problem.

Crescat’s New Precious Metals Activist Campaign with Quinton Hennigh as Advisor

With record global debt to GDP, historic US equity valuations, and new fiat money printing around the globe, the macro environment is incredibly bullish for precious metals today. We have been hard at work negotiating deals in select gold and silver exploration companies. In our hedge funds, we have been investing in private placements in public companies, often at significant discounts with warrants. We are building activist positions in some the best properties around the globe at highly attractive valuations after a decade long bear market. We are following the economic and technical advice of renowned exploration geologist, Quinton Hennigh, PhD. Based on his extensive experience and many past successes, we have asked Quinton to serve as Crescat’s geologic and technical advisor. He has identified many of the best next generation mining assets on the planet that are still in hands of junior exploration companies today. We are bringing necessary capital to advance these projects in return for significant stakes.

Quinton has 30 years of exploration experience, starting with Homestake, Newcrest, and Newmont then branching off from there. He is now Chairman and President of Novo Resources, one of Crescat’s largest positions. At Novo, Quinton made a massive nonconventional and potentially highly profitable gold discovery in the Pilbara region of Western Australia. Quinton is credited with the 5 million ounce discovery of the Springpole alkaline gold deposit near Red Lake, Ontario. He was instrumental in recognizing the potential for Fosterville mine in Eastern Australia and advocating for Kirkland Lake to acquire it, which it did in 2016. It was Quinton’s expertise and enthusiasm that made the allocation of capital happen to develop what was arguably the single most economically successful high-grade gold mine of the last decade.

At Crescat, we are striving to recreate that same kind of value again capitalizing on Quinton’s knack for identifying junior companies with high quality assets today that have the potential to be some of the most profitable mines of the next decade. We are bringing friendly activist capital to these exciting new deposits. They are not the same old picked-over carcasses of the last mining cycle. We are investing in a new generation of mining deposits all over the world. Each company is unique and each one has a great story tell. Crescat will be broadcasting a series of live videos with Quinton in the coming days and weeks on Youtube profiling our strategy and the investment thesis behind each of these companies. Each one controls potentially rich underground gold and silver deposits in viable jurisdictions that should propel them to substantially larger valuations in today’s macro environment.

Capitalizing on a new bull market in precious metals is one of our most important themes today. Crescat is infusing important growth capital into carefully vetted companies. In some cases, we are also bringing in new expertise to the board and technical team. Most importantly, and with Quinton’s guidance, we are making sure that our capital is spent on the key technical work needed to validate and expand what are some of the world’s most promising discoveries.

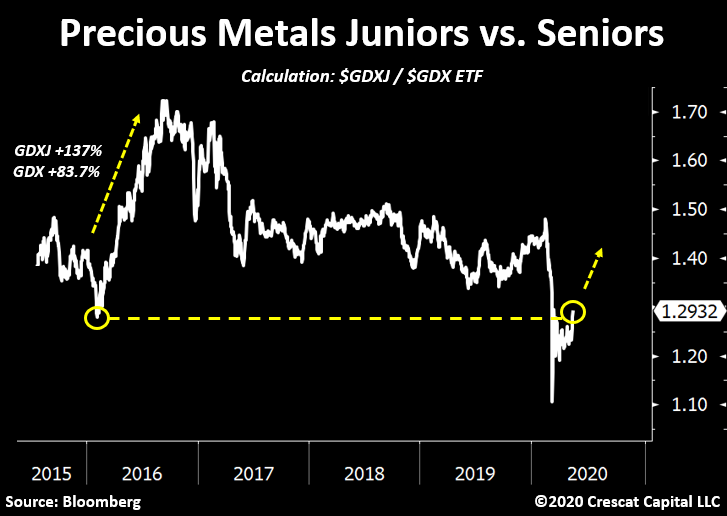
We are encouraged that small cap precious metals miners have recently started to outperform big caps. The junior-to-senior ratio is exactly where it was ahead of the 2016 gold rally. If you recall, back then, after 6 months: the GDX ETF (seniors focused) went up 87% while the GDXJ ETF (juniors focused) was up 137%!

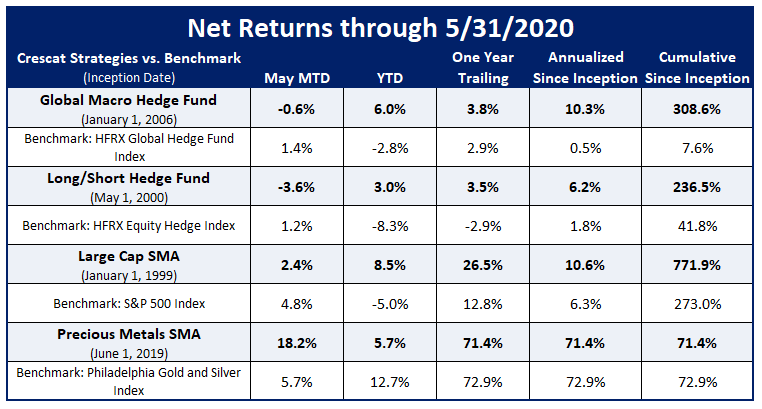
Crescat’s Precious Metals SMA strategy with its overweighting in more of the smaller cap names, including many of Quinton’s favorites, handily outperformed its benchmark in May rising 18.2% for the month versus 5.7% for the Philadelphia Stock Exchange Gold & Silver Index.

China

In our analysis, the Chinese Communist Party is running a $42 trillion banking Ponzi scheme that is ripe to implode in a currency crisis. The US and other highly leveraged democratic developed economies are in bad shape economically today, no doubt, but its peoples need not fall into a Thucydides’ trap, i.e., to be unduly threatened by a perceived rising power. China is a menace to global freedom and democracy, to be sure, but the country has a weak hand economically which will almost certainly be its downfall. It is true and well documented that the CCP runs an unfair technology transfer regime, discriminatory licensing, outbound investment schemes, cyber hacking, and intellectual property theft. As a result, Western democratic advanced economies and their Eastern allies are doing the right thing today by disengaging with the CCP on trade. The Chinese economy is destined to implode on its own, most importantly due to its historic banking imbalances.

We should not forget that US economic prominence in the world is a result of a long-standing Constitution built on core principles that include individual rights and freedoms, rule by the people, freedom from tyranny, checks and balances that prevent abuse of power, and limited government. The grass is most definitely not greener under totalitarian communism which by contrast has a track record of persistent and inevitable economic impoverishment and human rights enslavement. It is important to understand that the imbalances in the Chinese economy are even more extreme than the US which faces its own historic imbalances. As a result, global economic contagion risks remain extremely elevated today. China at the forefront of these risks arguing for a continuation of the serious global financial market downturn and recession that only just began in March.

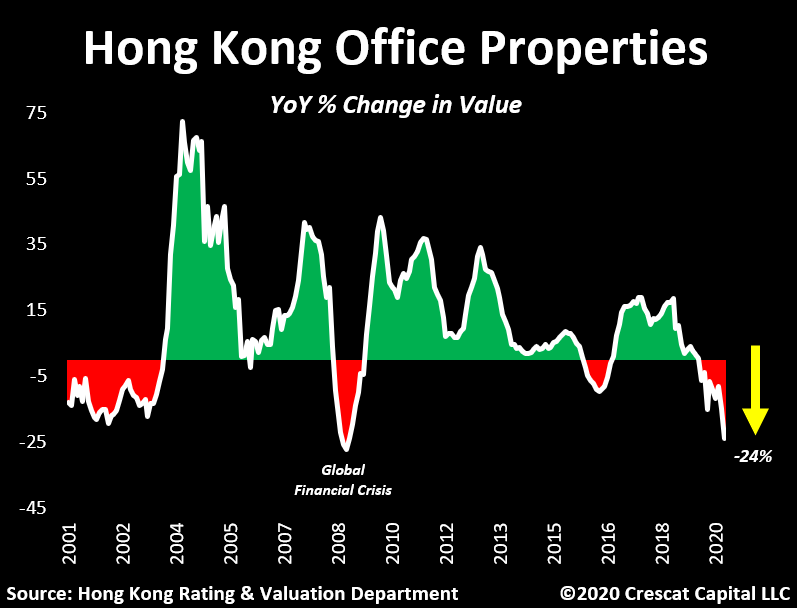
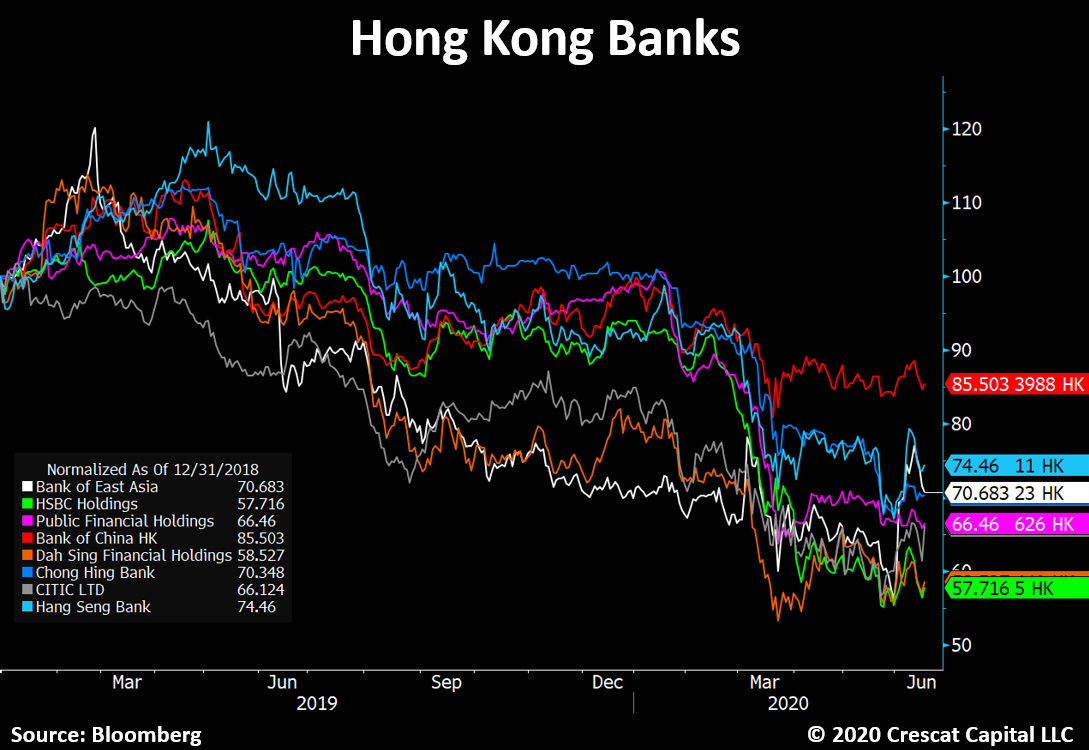
The Chinese Communist Party takeover of Hong Kong along with the dismantling of its democracy has destroyed the former British colony’s status as an international banking haven and jeopardized its special trade status with both the US and the UK. We believe global capital has been fleeing the country and outflow pressure only continues. Meanwhile, Hong Kong sits on one of the most overvalued property markets in the world that has just started to burst. For instance, Hong Kong office properties are now plunging by 24% YoY, the worst decline since I the Global Financial Crisis. One major difference, however, is that Hong Kong’s under-reserved massive $3.3 trillion banking system was not 9 times the size of its economy back then.

Private non-financial credit in the country is a world beating 300% of GDP. Hong Kong is on the Bank for International Settlements’ crisis watch list for that as well as its record high debt service ratio among all countries. The performance of Hong Kong’s banks over the last two years, as we show below, illustrates the risks to the Hong Kong banking system and the country’s currency peg to the US dollar.

Like with China, the world still believes Hong Kong maintains sufficient foreign reserves to maintain the value of its currency. We believe the reserves supporting both the yuan and Hong Kong dollar are encumbered. Necessarily, these reserves are the collateral in the global interbank FX markets that have been posted in defense of these currencies against years of Chinese capital outflow pressure. We believe China and Hong Kong are not netting the collateral posted for their short FX positions from their FX reserves. A currency crisis is potentially just a margin call away.

Crescat’s Positioning

At Crescat, we remain determined to capitalize on a US equity market downturn via short positions in our hedge fund strategies and believe there is much further downside for stocks at large ahead. Asset bubbles always burst. US stocks prices are way ahead of future fundamentals and poised to disappoint. Equity and credit markets are not immune from a business cycle downturn. They must eventually catch up to the abysmal fundamentals of today’s global economy that is in a severe recession.

With the Covid-19 shutdowns, we just experienced an economic shock likely worse than any single quarter of the Great Depression. It was made worse by the pre-existing imbalances that were threatening to send the economy into a recession of their own accord as had been forewarned by Crescat’s macro model. Yet stock prices are back near record highs and record valuations in response to temporary excitement over massive fiscal and monetary stimulus. It is the same unwarranted speculative mania that was driving the market in 2019 and early 2020, a pumping up of stock prices totally unwarranted by simultaneously deteriorating fundamentals and solely based on the faith in government stimulus.

The macro fundamentals for a new precious metals bull market have never been better as we have outlined herein. We are positioned long gold and silver mining equities across all four Crescat strategies.

Persistent, bi-partisan abuse of Keynesian policies has been a poor substitute for free market capitalism. The lesson is clear. Excessive and ongoing government intervention only creates mounting non-productive debt that stifles future real economic growth. Credit imbalances in the world today are at a historic high relative to global GDP. They are even worse in state-run communist China where historic banking bubbles warn of coming currency crises for both the Chinese yuan and Hong Kong dollar. Crescat Global Macro Fund continues to maintain long US dollar call option positions versus yuan and Hong Kong dollar puts with large US banks counterparties. Our goal is to profit with asymmetric reward-to-risk. While it has yet to play out in the dramatic fashion we envision, we believe it is coming soon.

Profit Attribution by Theme in the Crescat Global Macro Fund

Performance Across All Crescat Strategies

Given the enormous imbalances in the markets today, we believe it is an excellent time to consider an allocation to Crescat’s strategies.

Download PDF Version

SOURCE: https://www.crescat.net/crescat-turns-activist-on-gold/

Barrick Begins Drilling on Loncor $LN.ca Joint Venture Ground in DRC $LN.ca $ABX.ca $TECK.ca $RSG $NGT.to $GOLD $NEM

Posted by AGORACOM at 8:41 AM on Monday, June 22nd, 2020
  • Barrick Gold commenced drilling on several high priority gold targets
  • Since entering the JV agreement with Loncor in January 2016, Barrick has conducted various exploratory programs to define drill targets that offer the early potential of attaining “Tier 1” status.
  • “Tier 1” deposits target a minimum of 5 million ounces

TORONTO, June 22, 2020 (GLOBE NEWSWIRE) — Loncor Resources Inc. (“Loncor” or the “Company“) (TSX: “LN”; OTCQB: “LONCF”) announces that Barrick Gold (Congo) SARL has commenced its core drilling program on several priority gold targets within the Ngayu greenstone belt in the northeast of the Democratic Republic of the Congo (“DRC”). The beginning of the drilling campaign signals a significant step in the sequence of events necessary to assess numerous areas of potential. Since entering the JV agreement with Loncor in January 2016, Barrick has conducted various exploratory programs to define drill targets, targets that offer the early potential of attaining “Tier 1” status.

Commenting on the start of drilling at Ngayu, Loncor’s CEO Arnold Kondrat said: “Barrick continues to illustrate the progress that can be made in the DRC. Having built the successful Kibali gold mine approximately 220 kms away, Barrick has now embarked on its drilling program at Ngayu, an area that we believe holds the potential for further significant gold discoveries similar to our own Adumbi deposit.”

The drilling on the Anguluku prospect is targeting a folded and thrust sequence of mineralised banded ironstone formation (“BIF”). Further drilling is planned to be undertaken by Barrick at the other priority targets of Medere, Makasi, Lybie, Salisa and Bakpau NE in the Imva area in the west of the Ngayu belt (see Figure 1 below)

Loncor Continues to Explore – Imbo Exploitation Permit (Loncor 76.29%)

Outside of the Barrick joint venture, exploration activities by Loncor continued on Loncor’s Imbo Project in the east of the Ngayu belt. The Imbo Project contains 2.5 million ounces of inferred mineral resource (30.65 million tonnes grading 2.54 g/t Au), which includes the 2.19 million ounce inferred mineral resource of the Adumbi deposit (28.97 million tonnes grading 2.35 g/t), with 76.29% of this resource being attributable to Loncor via its 76.29% interest in the Imbo Project. Fieldwork by Loncor geologists have been focusing on the Imbo East prospect 12 kilometres southwest of the Adumbi deposit, along the same mineralised structural trend. Gridding, soil and rock sampling are being undertaken over a strike length of 3.6 kilometres at Imbo East.

In addition, two new targets have been generated. Both these target areas were identified from the compilation and interpretation of previous, historical exploration data including soil geochemistry, rock chip and channel sampling. At Mambo Bado, 1.5 kilometres northwest of the Adumbi deposit, a prominent geochemical gold in soil anomaly is located on an extensional, E-W structural jog along the 14-kilometre northwest trending mineralised shear zone within the Imbo permit area. No drilling has been undertaken previously on this promising target. Two kilometres south of the Adumbi deposit, at Lisala, altered and brecciated BIF with anomalous rock sampling requires further follow up with gridding, soil sampling and additional channel sampling.

About Loncor Resources Inc.
Loncor is a Canadian gold exploration company focussed on the Ngayu Greenstone Belt in the northeast of the Democratic Republic of the Congo (the “DRC”). The Loncor team has over two decades of experience of operating in the DRC. Ngayu has numerous positive indicators based on the geology, artisanal activity, encouraging drill results and an existing gold resource base. The area is 220 kilometres southwest of the Kibali gold mine, which is operated by Barrick Gold (Congo) SARL (“Barrick”). In 2019, Kibali produced record gold production of 814,000 ounces at “all-in sustaining costs” of US$693/oz. Barrick has highlighted the Ngayu Greenstone Belt as an area of particular exploration interest and is moving towards earning 65% of any discovery in 1,894 km2 of Loncor ground that they are exploring. As per the joint venture agreement signed in January 2016, Barrick manages and funds exploration on the said ground at the Ngayu project until the completion of a pre-feasibility study on any gold discovery meeting the investment criteria of Barrick. In a recent announcement Barrick highlighted six prospective drill targets and are moving towards confirmation drilling in 2020. Subject to the DRC’s free carried interest requirements, Barrick would earn 65% of any discovery with Loncor holding the balance of 35%. Loncor will be required, from that point forward, to fund its pro-rata share in respect of the discovery in order to maintain its 35% interest or be diluted.

In addition to the Barrick JV, certain parcels of land within the Ngayu project surrounding and including the Adumbi and Makapela deposits have been retained by Loncor and do not form part of the joint venture with Barrick. Barrick has certain pre-emptive rights over the Makapela deposit. Adumbi and two neighbouring deposits hold an inferred mineral resource of 2.5 million ounces of gold (30.65 million tonnes grading 2.54 g/t Au), with 76.29% of this resource being attributable to Loncor via its 76.29% interest in the project. The Makapela deposit (which is 100%-owned by Loncor) has an indicated mineral resource of 614,200 ounces of gold (2.20 million tonnes grading 8.66 g/t Au) and an inferred mineral resource of 549,600 ounces of gold (3.22 million tonnes grading 5.30 g/t Au).

Resolute Mining Limited (ASX/LSE: “RSG”) owns 26% of the outstanding shares of Loncor and holds a pre-emptive right to maintain its pro rata equity ownership interest in Loncor following the completion by Loncor of any proposed equity offering. 

Additional information with respect to Loncor and its projects can be found on Loncor’s website at www.loncor.com.

Affinity Metals $AFF.ca Provides West Timmins Project Drill Program Update $MKR.ca $SII.ca $TUD.ca $GTT.ca $AMK.ca $OSK.ca $RKR.ca

Posted by AGORACOM at 9:10 AM on Thursday, June 18th, 2020
This image has an empty alt attribute; its file name is Affinity_Metals_Corp_Logo.png
  • 1st hole drilled to depth of 525m at West Timmins Property
  • Core logging and sampling will commence shortly and samples will then be submitted for analysis.

Vancouver, British Columbia–(Newsfile Corp. – June 18, 2020) – Affinity Metals Corp. (TSXV: AFF) (“the Corporation”) (“Affinity”) is pleased to report that it has now completed drilling the first hole on the West Timmins property located approximately 29 km southwest of Timmins, Ontario, Canada.

The hole was drilled to a depth of 525 meters. Core logging and sampling will commence shortly and samples will then be submitted for analysis.

The property package consists of 20 mineral tenures spanning 429 hectares. The property directly adjoins to the west and along geological strike to the Melkior Carscallen project with both properties optimally located directly along the northern flank of the prolific Destor Porcupine Fault Zone. Melkior very recently made a significant gold discovery that has attracted not only the market’s attention but also the interest of Kirkland Lake Gold to participate in furthering exploration of the Melkior project model through joint participation.

The ground making up the West Timmins property was included/highlighted as a specific project example which meets exploration model recommendations as outlined within the 2012 published, Timmins Resident Geologist Report: “Recommendations for Exploration – Gold in Felsic Intrusions”. The geological model and potential of the West Timmins property correlate positively with the recent Melkior Carscallen exploration advancements.

The property is road accessible with a major highway (101) and regional scale power utility transmission lines passing directly through the property. Both Induced Polarization and Acoustic EM geophysics surveys have been conducted on the property and will assist in guiding future exploration.

The West Timmins property is located along the same structural and geological trend which hosts the Pan American Silver “Timmins West Mine” located approximately 13 km to the east along highway 101 and is also in close proximity to the Timmins mining camp, which is a major structural control corridor that has produced over 75 million ounces of gold.

About Affinity Metals

Affinity is focused on the acquisition, exploration and development of strategic metal deposits within North America. The Company is structured as a “Prospect Generator”.

In addition to the present work being conducted on the West Timmins property, Affinity is also focused on advancing the Regal Project located near Revelstoke, British Columbia, Canada. The Regal property is located in the northern end of the prolific Kootenay Arch and hosts two major geophysical anomalies as well as three past producing mines. Recent drill results included a new silver discovery with an 11.10 meter interval of 143.29 g/t silver which included a 0.55 meter interval of 2,612.0 g/t silver.

On behalf of the Board of Directors

Robert Edwards, CEO and Director of Affinity Metals Corp.

The Corporation can be contacted at: [email protected].

Information relating to the Corporation is available at: www.affinity-metals.com

American Creek $AMK.ca Completes Sale of Minority Interest in Electrum Property $TUD.ca $SII.ca $GTT.ca $AFF.ca $SEA.ca $SA $PVG.ca $AOT.ca $ESK.ca

Posted by AGORACOM at 10:12 AM on Tuesday, June 16th, 2020

Cardston, Alberta–(Newsfile Corp. – June 16, 2020) – American Creek Resources Ltd. (TSXV: AMK) (the “Company” or “American Creek”) – Following its press release of May 12, 2020, the Company announces the completion of the sale of its 40% interest in the Electrum Project joint venture to Tudor Gold Corp. (‘Tudor”). The purchase price received was $250,000 cash and 1,400,000 Tudor common shares, which are subject to a contractual 8 month hold period expiring February 16, 2021.

Darren Blaney, American Creek CEO stated: “We are please to be able to complete this transaction which gives the Company additional operating funds and more importantly, further increases the Company’s exposure to the Treaty Creek JV Project. We are very much looking forward to the upcoming developments as the Tudor team is doing an outstanding job of advancing the Treaty Creek project in a major way”.

About American Creek

American Creek holds a strong portfolio of gold and silver properties in British Columbia.

Two of those properties are located in the prolific “Golden Triangle”; the Treaty Creek joint venture project with Tudor (Walter Storm) as well as the 100% owned past producing Dunwell Mine.

The Company also holds the Gold Hill, Austruck-Bonanza, Ample Goldmax, Silver Side, and Glitter King properties located in other prospective areas of the province.

For further information please contact Kelvin Burton at: Phone: 403 752-4040 or Email: [email protected]. Information relating to the Corporation is available on its website at: www.americancreek.com

Loncor Files NI 43-101 Technical Report on Imbo Project, Confirming Inferred Mineral Resource Increase to 2.5 Million Ounces $LN.ca $ABX.ca $TECK.ca $RSG $NGT.to $GOLD $NEM

Posted by AGORACOM at 10:07 AM on Thursday, June 11th, 2020
  • The Imbo inferred mineral resource increased by 49% to 2.5 million ounces (30.65 million tonnes grading 2.54 g/t Au). 76.29% of this gold resource is attributable to Loncor via its 76.29% interest in the Imbo Project.
  • 76.29% of this gold resource is attributable to Loncor via its 76.29% interest in the Imbo Project.
  • A planned drill program will look to add to the Adumbi resource over the next twelve months.

TORONTO, June 10, 2020 (GLOBE NEWSWIRE) — Loncor Resources Inc. (“Loncor” or the “Company“) (TSX: “LN”; OTCQB: “LONCF”) announces that it has filed on SEDAR an independent National Instrument 43-101 technical report (the “Technical Report”) relating to the Company’s Imbo Project, in particular, the updated gold mineral resource estimates for the Imbo Project reported in the Company’s April 17, 2020 press release.  The Technical Report, which was prepared by Minecon Resources and Services Limited, has an effective date of April 17, 2020 and is entitled “Independent National Instrument 43-101 Technical Report on the Imbo Project, Ituri Province, Democratic Republic of the Congo”.

Highlights from April 17, 2020 press release confirmed in Technical Report:

  • The Imbo Project inferred mineral resource increased by 49% to 2.5 million ounces of gold (30.65 million tonnes grading 2.54 g/t Au).  76.29% of this gold resource is attributable to Loncor via its 76.29% interest in the Imbo Project. 
  • Within the Imbo Project, the Adumbi deposit inferred mineral resource increased by 61% to 2.19 million ounces of gold (28.97 million tonnes grading 2.35 g/t Au) (the Adumbi deposit is one of the three deposits at Imbo currently with a resource). 
  • A planned drill program will look to add to the Adumbi resource over the next twelve months.

The Imbo mineral resources are in addition to Loncor’s resources at its Makapela Project (which is 100%-owned by Loncor) where there is an indicated mineral resource of 614,200 ounces of gold (2.20 million tonnes grading 8.66 g/t Au) and an inferred mineral resource of 549,600 ounces of gold (3.22 million tonnes grading 5.30 g/t Au). 

Arnold Kondrat, CEO of Loncor, stated: “This filing of the 43-101 represents the culmination of many years of persistence by the Loncor team in the Ngayu greenstone belt.  We believe this region is one of the few remaining areas around the world where Tier 1 gold deposits can still be discovered, built and mined profitably as shown by Barrick Gold at the Kibali mine.  Over the next 12 months, Loncor will look to drive forward with a drill program at the Adumbi deposit, with the aim of significantly increasing the current resource, while simultaneously awaiting with interest news on the imminent drilling program at the drill targets defined by our Joint Venture partner Barrick Gold.”

About Loncor Resources Inc.
Loncor is a Canadian gold exploration company focussed on the Ngayu Greenstone Belt in the North East of the Democratic Republic of the Congo (the “DRC”).  The Loncor team has over two decades of experience of operating in the DRC.  Ngayu has numerous positive indicators based on the geology, artisanal activity, encouraging drill results and an existing gold resource base.  The area is 220 kilometres southwest of the Kibali gold mine, which is operated by Barrick Gold (Congo) SARL (“Barrick”).  In 2019, Kibali produced record gold production of 814,000 ounces at “all-in sustaining costs” of US$693/oz.  Barrick has highlighted the Ngayu Greenstone Belt as an area of particular exploration interest and is moving towards earning 65% of any discovery in 1,894 km2 of Loncor ground that they are exploring.  As per the joint venture agreement signed in January 2016, Barrick manages and funds exploration on the said ground at the Ngayu project until the completion of a pre-feasibility study on any gold discovery meeting the investment criteria of Barrick.  In a recent announcement Barrick highlighted six prospective drill targets and are moving towards confirmation drilling in 2020. Subject to the DRC’s free carried interest requirements, Barrick would earn 65% of any discovery with Loncor holding the balance of 35%.  Loncor will be required, from that point forward, to fund its pro-rata share in respect of the discovery in order to maintain its 35% interest or be diluted.

In addition to the Barrick JV, certain parcels of land within the Ngayu project surrounding and including the Makapela and Adumbi deposits have been retained by Loncor and do not form part of the joint venture with Barrick. Barrick has certain pre-emptive rights over the Makapela deposit.  Loncor’s Makapela deposit (which is 100%-owned by Loncor) has an indicated mineral resource of 614,200 ounces of gold (2.20 million tonnes grading 8.66 g/t Au) and an inferred mineral resource of 549,600 ounces of gold (3.22 million tonnes grading 5.30 g/t Au).  Adumbi and two neighbouring deposits hold an inferred mineral resource of 2.5 million ounces of gold (30.65 million tonnes grading 2.54 g/t Au), with 76.29% of this resource being attributable to Loncor via its 76.29% interest in the project.  

Resolute Mining Limited (ASX/LSE: “RSG”) owns 26% of the outstanding shares of Loncor and holds a pre-emptive right to maintain its pro rata equity ownership interest in Loncor following the completion by Loncor of any proposed equity offering. 

Additional information with respect to Loncor and its projects can be found on Loncor’s website at www.loncor.com.

Qualified Person
Peter N. Cowley, who is President of Loncor and a “qualified person” as such term is defined in National Instrument 43-101, has reviewed and approved the technical information in this press release. 

Technical Reports
Additional information with respect to the Company’s Imbo Project is contained in the technical report of Minecon Resources and Services Limited dated April 17, 2020 and entitled “Independent National Instrument 43-101 Technical Report on the Imbo Project, Ituri Province, Democratic Republic of the Congo”.  A copy of the said report can be obtained from SEDAR at www.sedar.com. 

CLIENT FEATURE: American Creek’s $AMK.ca Treaty Creek Project Targeting 20 to 30 Million Ounces Gold Via 2020 Drill Program $TUD.ca $SII.ca $GTT.ca $AFF.ca $SEA.ca $SA $PVG.ca $AOT.ca $ESK.ca

Posted by AGORACOM at 10:52 AM on Tuesday, June 9th, 2020

SPONSOR: American Creek owns a 20% Carried Interest to Production at the Treaty Creek Project in the Golden Triangle. 2019’s first hole averaged 0.683 g/t Au over 780m in a vertical intercept. 2020 drilling has started, with 18,000 to 20,000 metres from 7-10 drill platforms with four diamond drill rigs. The Treaty Creek property is located in the same hydrothermal system as the Pretivm and Seabridge’s KSM deposits and is fully funded for exploration in 2020. Click Here For More Info

  • Located next to the world’s largest undeveloped gold deposit by reserves in B.C.’s  Golden Triangle (KSM) 
  • Drilling has started 1 month early  
  • There are already holes shipped off to the lab for assays.  

American Creek has a Fully Carried 20% Interest in the Treaty Creek Project 

  • The currently known length of the northeast axis of the Goldstorm system is 850 meters and the southeast axis is 600 meters by 700m depth. 
  • Mineralization depth in the north continues to 1,200m when the drills gave out  
  • The system remains open in both directions and in depth  
  • The total size of this mighty gold system has expanded significantly with each step-out borehole 
  • AMK Partner Tudor is planning a step-out of 150 meters to the east and the north in 2020.  
  • The richest mineralization at ‘Treaty Creek’ starts near the surface extending to a 300m depth, which clearly speaks for a future open pit mine. 
  • The gold system is open on all sides and the geology and geophysics indicate a much larger system than has been defined.  

The Treaty Creek Project is a Joint Venture with Tudor Gold owning 3/5th and acting as operator. American Creek and Teuton Resources each have a 1/5th interest in the project creating a 3:1 ownership relationship between Tudor Gold and American Creek. American Creek and Teuton are both fully carried until such time as a Production Notice is issued, at which time they are required to contribute their respective 20% share of development costs. Until such time, Tudor is required to fund all exploration and development costs while both American Creek and Teuton have “free rides”. 

Demand for world-class projects in politically stable regions such as Canada and Australia will increase significantly. Projects such as’ Treaty Creek ‘by Tudor Gold should be at the top of the big producers’ shopping list 

JS Research from Germany just came out with a report on Treaty Creek and American Creek’s JV partner Tudor Gold, which includes projections for the size and value of the project.  Below is the English translation: 

TRANSLATED ARTICLE: 

Tudor Gold Starts Powerful Drill Program With 22.5 To 32.1 Million Ounces Of Gold Eq Target ++ Billionaire Eric Sprott Invests Another CAD 2.9 Million! 

The exploration pearl Tudor Gold Corp. (Ticker Canada: TUD, WKN: A2AJ7Y) we presented you in detail several times last year. Many of our readers can already look forward to exceptional price gains in their securities accounts, since the share has exploded from CAD 0.24 in 2019 to CAD 1.07 in the meantime! A gain of 345%. But that’s not all – we are convinced that Tudor Gold still has very high price potential.  

Smart investors are now positioning themselves again at the perfect time – why? We have examined the latest company reports in more detail for you and summarized our assessment:  

TOP NEWS 1:  

Tudor Gold announced on May 11th (see link here) that the powerful drilling program has started on the flagship Project ‘Treaty Creek’ in BC’s Golden Triangle! The world-class explorer plans to drill a total of 20,000 meters there in the next few months. This means that this year’s drilling program is more than twice as large as last year when 9,781 meters were drilled in 14 holes.  

TOP NEWS 2:  

100% hit rate for the 2019 drilling program – all 14 holes have hit gold-bearing mineralization! Chapeau to the management team around the experienced CEO Walter Storm, who, as a co-founder of Osisko Mining (market capitalization then rose from under 10 million to over 4.5 billion CAD), had a real golden hand in exploration in Canada!  

TOP NEWS 3:  

The legendary star investor Eric Sprott has massively expanded his strategic stake in Tudor Gold! The billionaire announced on May 15, 20 that he had exercised two purchase warrants ahead of time and has thus transferred CAD 2.9 million to Tudor. (Read the German press release here: LINK) The smart Eric Sprott knows exactly how to make a lot of money in the raw materials sector! This further investment is a special seal of approval and strong proof of trust in the world-class Explorer Tudor Gold!!! Follow the ‘smart money’ and be there when Tudor Gold writes exploration history!  

TOP NEWS 4:  

Tudor Gold is one of the few exploration companies that are sufficiently funded to run such a mega exploration program! So there will be a lot of news flow in the next few months, which should cause extreme (positive) share price fantasy!  

TOP NEWS 5:  

The exploration team around Tudor Gold’s award-winning star geologist and VP Project Development, Ken Konkin , has even managed to start drilling four weeks earlier! This is top news, because the publication of the first drilling results can now be expected much earlier! Ken Konkin was instrumental in the discovery of Pretium Resources’ The Valley of Kings deposit. The very experienced Ken Konkin knows exactly what he is doing – we are expecting another successful exploration program this year!  

TOP NEWS 6:  

The company has big plans: On April 22, 20, Tudor announced that the metallurgical test work and preliminary basic studies on ‘Treaty Creek’ have started. For us, this is a strong sign that Tudor will continue to develop the project until it is ready for production after the release of a first resource (towards the end of this year?)! You can read the German press release here:  

LINK TOP NEWS 7:  

The gold price marked a new multi-year high of $ 1,765 in May and is still in a long-term cyclical uptrend. Many experts expect the nominal all-time high of around USD 1,920 to be exceeded in the next few months.  

In April, the renowned American Bank of America made a forecast that gold could rise to up to USD 3,000 per troy ounce within 18 months! One of the reasons for the gold price rise is the launch of global economic stimulus programs and the massive expansion of money supply by the major central banks. It is estimated that the staggering $ 10 trillion in new money will be printed or launched on government programs.  

These measures are designed to avert a severe recession / depression triggered by COVID-19. It is expected that we will see rapidly increasing inflation rates or even stagflation in the next few years! Gold is and remains one of the safest investments (a so-called ‘safe haven’) for investors in such an environment and offers the ultimate protection against inflation-related devaluation.  

Gold stocks traditionally have significant leverage against gold. This means that if the gold price trend is positive, they will increase significantly more in percentage terms. Experience has shown that the typical leverage effect of a gold share is 1.5 to 4x. (A 1% price increase in gold usually means an increase of 1.5 to 4% for shares in the gold sector). Not so with Tudor Gold: the exploration company even had a much stronger lever on the gold price in 2019! It was a strong 12.6x in 2019! The stock increased from $ 0.24 to $ 0.79 from January 2, 2019 to December 31, 2018. This corresponds to a percentage increase of 229.2%. The gold price rose by only 18.1% over the same period. Tudor Gold’s leverage was 12.6x (calculation formula: 229.2: 18.1 = 20.5). [Gold lever Tudor gold]  

https://assets.wallstreet-online.de/_media/144/2020/06/02/goldhebel-tudor-gold.png

TOP NEWS 8: Tudor Gold’s drilling results in 2019 are world class! We have listed a few of the most spectacular drill results to date:  

Drill hole GS19-42: 0.849 g / t Gold Eq over 780 meters including 1.275 g / t Gold Eq over 370.5 meters in the 300 Horizon section;  

Hole GS19-47: 0.697 g / t Gold Eq over 1,081.5 meters including 0.867 g / t Gold Eq over 301.5 meters in the 300 Horizon section;  

Drill hole GS19-52: 0.783 g / t gold Eq over 601.5 meters incl. 1.062 g / t gold over 336.0 meters in the 300 Horizon section;  

Hole GS19-48: 0.793 g / t Gold Eq over 927.0 meters;  

Hole GS19-49: 0.800 g / t gold Eq over 826.5 meters including 1.080 g / t gold over 249 meters;  

Hole GS19-50: 0.681 g / t Gold Eq over 577.5 meters; Hole CB-18-39: 1,086 g / t Gold Eq over 563.8 meters  

Tudor Gold has already managed to define a significant mineralization corridor on Treaty Creek. The currently known length of the northeast axis of the Goldstorm system is over 850 meters and the southeast axis is at least 600 meters. The system remains open in both directions and in depth!  

The total size of this mighty gold system has expanded significantly with each step-out borehole! As can be seen in the recently released press release, Tudor is planning another step-out well 150 meters away in 2020. Not to be painted if a long gold mineralization section is found again! And the best thing is that mineralization at ‘Treaty Creek’ starts near the surface, which clearly speaks for a future open pit mine!  

Tudor Gold has therefore defined the so-called ‘Horizon 300 Zone’. This means the area of the first 300 meters from the ground. As you can see in the above results, the ore grades are often even over 1.00 grams of gold per ton! This increases the economy of this world-class project enormously. The gold system is open on all sides and the overall size has not yet been fully defined. Thus, Tudor Gold’s flagship project still has enormous exploration potential!  

The company plans to begin producing an initial resource estimate for Treaty Creek immediately after the 2020 drilling season is completed. We took the trouble to simulate a potential resource based on the conceptual exploration target for Treaty Creek of 1 billion tons of rock and various assumptions of ore grades (grams of gold per ton). We would like to emphasize that this simulation is based on an interview by Ken Konkin with Swiss Resource Capital AG in November 2019 and various variable assumptions!  

Tudor Gold’s star geologist Ken Konkin, Vice President Project Development, gave an impressive interview in November 2019.  

Click on this link to watch the interview! LINK 

https://assets.wallstreet-online.de/_media/144/2020/06/02/interview-ken-konkin-november-2019.png

Tudor Gold’s ‘Treaty Creek’ – the next significant world-class project in stable and mining-friendly Canada (BC) [Conceptual exploration target Treaty Creek] 

https://assets.wallstreet-online.de/_media/144/2020/06/02/konzeptionelles-explorationstarget-treaty-creek.png

As more and more gold producers have to replace their mined gold resources in order to maintain constant gold production, we believe that demand for world-class projects in politically stable regions such as Canada and Australia will increase significantly. Projects such as’ Treaty Creek ‘by Tudor Gold should be at the top of the big producers’ shopping list. Because the flagship project ‘Treaty Creek’ is close to the infrastructure of roads and electricity in mining-friendly western Canada.  

Should Tudor Gold actually manage to prove an initial gold resource of 22-32 million ounces by the end of the year, there would be a highly explosive revaluation of the share! Currently, the market capitalization is only around CAD 137 million. As I said, Tudor Gold has not released a proven resource yet, but the spectacular drill results from 2019 show that the company may be controlling a world-class ore body on Treaty Creek!  

We have created a hypothetical valuation matrix for Tudor Gold. If a producer were willing to pay, for example, USD 65 for each ounce of gold after the publication of a gold resource, the value of the gold treasure (eg 20 million ounces) at Treaty Creek would be CAD 1.98 billion. Tudor Gold’s 60% stake in Treaty Creek would have a value of $ 1.19 billion or $ 7.80 per share. This corresponds to a price potential of an incredible 748%!  

https://assets.wallstreet-online.de/_media/144/2020/06/02/hypothetische-bewertung-von-treaty-creek.png

[Hypothetical assessment of Treaty Creek]  

Since Tudor Gold’s Treaty Creek project is located in politically safe Canada, a substantial takeover premium should be extremely realistic if a major is taken over by M&A.  

$ 90 per ounce of gold is also easy in the realm of possibility. The takeover value for Tudor Gold would of course be correspondingly higher – in theory it would be approx. 10.80 CAD per share! That is why in previous articles we allowed Tudor Gold a clear potential for excavators. We expect huge news flow from Tudor Gold in 2020, especially for the upcoming drilling season, which will be a combination of ‘infill’ drilling and ‘step-out’ drilling.  

In addition, the mineralization zones begin near the surface, which strongly suggests that a large open open- cast mine may develop here. And it is known that Tudor Gold’s flagship project can be connected to a few kilometers away infrastructure (electricity and road). 
 

‘Wild Card’:  

Seabridge Gold is the adjacent neighbor to Tudor Gold’s Treaty Creek project and plans to bring the “KSM project” into production. Should this extremely costly mine project, with an initial cost of capital of $ 5.4 billion estimated, ever be financed and go into production, Seabridge plans to build a tunnel directly through Treaty Creek. As can be seen from various company presentations and on the Seabridge website, this so-called ‘ Mitchell Treaty’ tunnel (‘MTT’) is to be used to design an underground train system via which not only ore but also personnel and consumables are to be transported. As we can assess the situation from a distance, the possible tunnel is quite close to the potential Goldstorm gold system on ‘Treaty Creek’ – Tudor Gold will definitely not allow sterilization of your future resource!  

In our opinion, this tunnel will only be possible, if at all, under very mutually acceptable conditions and at eye level with Tudor Gold! Otherwise, it would be hard for us to imagine how Seabridge would survive a multi-billion-dollar lawsuit if the planned tunnel ran straight through Tudor Gold’s future (potential) open pit mine.  

Tudor’s Treaty Creek project is significantly closer to key infrastructure such as highway and electricity than its neighbor Seabridge Gold. Therefore, gold producers’ interest in Tudor Gold should also be greater. We also expect significantly lower capital costs to build a mine at Treaty Creek.  

[Proposed sea bridge tunnel] Source: Seabridge Gold company presentation, July 2019  

Summary of Highlights:  

  • Prime location: Huge land package in the world-famous Canadian ‘Golden Triangle’ – more than 72 million ounces of gold have already been discovered within a few kilometers. 
  • The Treaty Creek flagship project is adjacent to the largest world-class deposits and mines. (Seabridge Gold and Pretium Resources) 
  • Top Management – Very experienced and successful team under the leadership of the renowned Walter Storm , co-founder of the Canadian mining company Osisko Mining . Ken Konkin , a multi-award winning geologist, has led the drilling program since 2019. He was instrumental in the discovery of Pretium Resources’ The Valley of Kings deposit. (8 million ounces of gold) 

World-Class Drill Results at Treaty Creek Project:  

  • The 2019 drilling program resulted in first-class continuous mineralization sections, for example Drill hole GS19-42: 0.849 g / t Gold Eq over 780 meters including 1.275 g / t Gold Eq over 370.5 meters in the 300 Horizon section;  
  • Hole GS19-47: 0.697 g / t Gold Eq over 1,081.5 meters including 0.867 g / t Gold Eq over 301.5 meters in the 300 Horizon section;  
  • Drill hole GS19-52: 0.783 g / t gold Eq over 601.5 meters incl. 1.062 g / t gold over 336.0 meters in the 300 Horizon section;  
  • Hole GS19-48: 0.793 g / t Gold Eq over 927.0 meters; Hole GS19-49: 0.800 g / t gold Eq over 826.5 meters including 1.080 g / t gold over 249 meters;  
  • Hole GS19-50: 0.681 g / t Gold Eq over 577.5 meters; Hole CB-18-39: 1,086 g / t Gold Eq over 563.8 meters  
  • Enormous exploration potential – large parts of the exploration projects are still largely unexplored. 

https://translate.googleusercontent.com/translate_c?depth=1&hl=en&prev=search&rurl=translate.google.com&sl=de&sp=nmt4&u=https://www.wallstreet-online.de/nachricht/12588728-gold-tudor-gold-tudor-gold-maechtiges-bohrprogramm-22-5-32-1-mio-unzen-gold-eq-target-milliardaer-eric-sprott-investiert-2-9-mio-cad&usg=ALkJrhgZ_VTqzOy2iUnvk4tm2Y-28AZa3Q

Your JS research team      
 
Risk warnings and disclaimer: We expressly point out that we accept no liability for the content of external links. Any investment in securities is risky. Due to political, economic or other changes, there may be significant price losses. This applies in particular to investments in (foreign) small caps as well as in small and microcap companies; Due to the low market capitalization, investments in such securities are highly speculative and involve an extremely high risk up to the total loss of the invested capital. In addition, some of the shares presented at JS Research UG (limited liability) are subject to currency risks. The background information, market assessments and securities analyzes published by JS Research UG (limited liability) for German-speaking countries have been prepared in compliance with Austrian and German capital market regulations and are therefore intended only for capital market participants in the Republic of Austria and the Federal Republic of Germany; other foreign capital market regulations have not been taken into account and do not apply in any way. 
 
The publications of JS Research UG (limited liability) are for informational purposes only and expressly do not constitute a financial analysis, but are promotional texts of a purely advertising nature for the companies discussed, which pay a fee for this. There is no consultancy agreement between the reader and the authors or the editor through the purchase of the JS Research UG (limited liability) publications. All information and analyzes do not constitute a solicitation, an offer or a recommendation to buy or sell investment instruments or for other transactions. Every investment in shares, bonds, options or other financial products is associated with – sometimes considerable – risks. The publishers and authors of the JS Research UG (limited liability) publications are not professional investment advisors !!! For this reason, you should always seek advice from a qualified specialist (for example, from your house bank or a qualified advisor you trust) when making your investment decisions. 
 
All information and data published by JS Research UG (limited liability) come from sources that we believe to be reliable and trustworthy at the time of creation. However, no guarantee can be given with regard to the correctness and completeness of this information and data. The same applies to the evaluations and statements contained in the analyzes and market assessments by JS Research UG (limited liability). These were created with due care. A responsibility or liability for the correctness and completeness of the information contained in this publication is excluded. All opinions expressed reflect the current assessment of the authors, which can change at any time without prior notice. 
 
Information about conflicts of interest: The publishers and responsible authors hereby declare that the following conflicts of interest exist with regard to the Tudor Gold company discussed in this publication at the time of publication: I. Authors and the publisher, as well as related consultants and clients, hold stocks of shares at the time of publication Tudor Gold and reserve the right to sell them at any time without notice or to take new positions in Tudor Gold. II. At the time of publication, authors and the publisher and their related consultants maintain a consulting mandate with Tudor Gold and receive a fee for this. Authors and the editor know that other stock market letters, Media or research companies discuss the Tudor Gold share in the same period. Therefore, symmetrical information and opinion generation occurs during this period. This publication by JS Research UG (limited liability) is expressly not a financial analysis, but rather a publication of a very clear and unambiguously advertising character on behalf of the company discussed and thus to be understood as an advertising / marketing communication. In accordance with section 34 of the WpHG, I would like to point out that Jörg Schulte, JS Research UG (limited liability) or employees of the company hold shares in Tudor Gold and can continue to buy or sell their own business in the shares of the companies presented (e.g. long or short positions) at any time . We expressly point out a conflict of interest. This also applies to options and derivatives based on these securities. The resulting transactions may influence the company’s share price. 
 
Information, recommendations, interviews and company presentations published on the “websites”, the newsletter or the research reports are paid for by the respective companies or third parties (so-called “third parties”). Third parties include, for example, investor relations and public relations companies, brokers or investors. JS Research UG (limited liability) or its employees can be paid directly or indirectly for the preparation, electronic distribution and other services by the companies discussed or so-called “third parties” with an allowance. Even if we compile each report to the best of our knowledge and belief, we advise you about other external sources such as, for example, your investment decisions Consult your house bank or a trusted advisor. For this reason, liability for financial loss that may result from using the explanations given here for your own investment decisions is categorically excluded. The custody account shares of individual shares should only be so much, especially with commodity and exploration shares and with low capitalized values, that even in the event of a total loss, the total portfolio can only lose marginally in value. Especially stocks with small market capitalization (so-called “small caps”) and especially exploration stocks as well as all listed securities in general are subject to considerable fluctuations. The liquidity in the securities can be correspondingly low. When investing in the raw materials sector (exploration companies, raw material producers, companies that develop raw material projects), additional risks must be taken into account. The following are some examples of separate risks in the raw materials sector: country risks, currency fluctuations, natural disasters and storms (e.g. floods, storms), changes in the legal situation (e.g. bans on exports and imports, punitive tariffs, prohibition of raw material extraction or exploration, nationalization of projects), environmental regulations (eg higher costs for environmental protection, designation of new environmental protection areas, prohibition of various mining methods), fluctuations in raw material prices and considerable exploration risks. Disclaimer: All information published in the report is based on careful research. Companies that develop raw material projects) must be aware of additional risks. The following are some examples of separate risks in the raw materials sector: country risks, currency fluctuations, natural disasters and storms (e.g. floods, storms), changes in the legal situation (e.g. bans on exports and imports, punitive tariffs, prohibition of raw material extraction or exploration, nationalization of projects), environmental regulations (eg higher costs for environmental protection, designation of new environmental protection areas, prohibition of various mining methods), fluctuations in raw material prices and considerable exploration risks. Disclaimer: All information published in the report is based on careful research. Companies that develop raw material projects) must be aware of additional risks. The following are some examples of separate risks in the raw materials sector: country risks, currency fluctuations, natural disasters and storms (e.g. floods, storms), changes in the legal situation (e.g. bans on exports and imports, punitive tariffs, prohibition of raw material extraction or exploration, nationalization of projects), environmental regulations (eg higher costs for environmental protection, designation of new environmental protection areas, prohibition of various mining methods), fluctuations in raw material prices and considerable exploration risks. Disclaimer: All information published in the report is based on careful research. The following are some examples of separate risks in the raw materials sector: country risks, currency fluctuations, natural disasters and storms (e.g. floods, storms), changes in the legal situation (e.g. bans on exports and imports, punitive tariffs, prohibition of raw material extraction or exploration, nationalization of projects), environmental regulations (eg higher costs for environmental protection, designation of new environmental protection areas, prohibition of various mining methods), fluctuations in raw material prices and considerable exploration risks. Disclaimer: All information published in the report is based on careful research. The following are some examples of separate risks in the raw materials sector: country risks, currency fluctuations, natural disasters and storms (e.g. floods, storms), changes in the legal situation (e.g. bans on exports and imports, punitive tariffs, prohibition of raw material extraction or exploration, nationalization of projects), environmental regulations (eg higher costs for environmental protection, designation of new environmental protection areas, prohibition of various mining methods), fluctuations in raw material prices and considerable exploration risks. Disclaimer: All information published in the report is based on careful research. Ex and import bans, punitive tariffs, prohibition of raw material extraction or exploration, nationalization of projects), environmental regulations (e.g. higher costs for environmental protection, designation of new environmental protection areas, prohibition of various mining methods), fluctuations in raw material prices and considerable exploration risks. Disclaimer: All information published in the report is based on careful research. Ex and import bans, punitive tariffs, prohibition of raw material extraction or exploration, nationalization of projects), environmental regulations (e.g. higher costs for environmental protection, designation of new environmental protection areas, prohibition of various mining methods), fluctuations in raw material prices and considerable exploration risks. Disclaimer: All information published in the report is based on careful research. 
 
The information does not constitute an offer to sell the shares discussed or a solicitation to buy or sell securities. This report only reflects the personal opinion of Jörg Schulte and is in no way to be compared with a financial analysis. Before you make any investments, professional advice from your bank is essential. The statements are based on sources that the publisher and his employees consider to be trustworthy. However, no liability can be accepted for the correctness of the content. No liability is assumed for the accuracy of the charts and data on the commodity, foreign exchange and stock markets. The source language (usually English) in which the original text is published is the official, authorized and legally valid version. This translation is included for better understanding. The German version can be shortened or summarized. No responsibility or liability is assumed: for the content, correctness, adequacy or accuracy of this translation. From the translator’s point of view, the message does not constitute a buy or sell recommendation! Read here – https://www.js-research.de/disclaimer-agb/ -. Please also note the original English message, if available. From the translator’s point of view, the message does not constitute a buy or sell recommendation! Read here – https://www.js-research.de/disclaimer-agb/ -. Please also note the original English message, if available. From the translator’s point of view, the message does not constitute a buy or sell recommendation! Read here – https://www.js-research.de/disclaimer-agb/ -. Please also note the original English message, if available.

Trend Reversal in Silver is Coming: TD Securities Bets Long on Silver SPONSOR: Affinity Metals $AAF.ca $SII.ca $TUD.ca $GTT.ca $AMK.ca $OSK.ca $RKR.ca

Posted by AGORACOM at 3:44 PM on Thursday, June 4th, 2020
This image has an empty alt attribute; its file name is Affinity_Metals_Corp_Logo.png

Sponsor: Affinity Metals Corp. (TSX-V: AFF) is a Canadian mineral exploration company building a strong portfolio of mineral projects in North America. The Corporation’s flagship property is the drill ready Regal Property near Revelstoke, BC where Affinity Metals is making preparations for a spring drill program to test two large Z-TEM anomalies. Click Here for More Info

  • A trend reversal is looking likely for silver, according to TD Securities, which issued a long call on silver, projecting a $19-an-ounce price level by March 2021.

TD Securities uses its C.H.I.L trend analytics to make trade predictions that uses “10,000 simulations of future price paths to determine critical thresholds for a change in trend.”

The bank’s latest call focuses on silver, with strategists citing an uptrend forming — “top trade betting on uptrend formation in silver: long Mar21 $19.00/oz silver call,” they said.

At the time of writing, July Comex silver futures were trading at $17.935, down 0.13% on the day. Silver has been playing catch-up to gold these past three weeks after missing out on the safe haven’s rally in April and the beginning of May.

TD Securities strategists project more gains for silver in the long term, highlighting industrial demand as one of the key drivers.

“A low hurdle rate for a sustained trend reversal, combined with a backdrop of firming industrial demand, rising investment flows and limited speculative activity argue for a potential positive skew in the distribution of silver’s returns,” the bank’s commodity strategists said this week.

This new trend could reverse the divergence in precious-metals space that saw gold posting gains while silver and platinum struggled, TD Securities said.

“Risk appetite and deflationary worries cap gold. Industrial precious benefits from improving commodity demand,” the strategists said. “Conditions are favorable for a trend reversal in silver which could keep prices supported as a sustainable uptrend forms.”

After reaching $19 in March 2021, TD Securities projects further gains that would see prices rise to $20.25 in the third quarter of 2021 and then to $21.75 in the fourth quarter of 2021.

‘Silver is an explosive metal’

Silver is benefiting from increased industrial demand as well as rising safe-haven flow demand, the bank pointed out.

“A simple analysis extracting the (rolling) regression coefficient of silver’s returns as a function of gold’s and our commodity demand indicator suggested that silver has increasingly been driven by commodity demand. At the same time, however, we note that silver ETF [exchange-traded-fund] holdings have been highly correlated to gold’s of late — suggesting investment demand for the precious metals theme is also flowing to silver. Speculative interest in CME products has been extremely low, but a CTA [Commodity Trading Adviser] buying program could revive speculative interest,” the strategists explained back in May.

The combination of the two drivers working side by side “creates the set-up for explosive performance,” the strategists added, pointing to fairly constrained supply side.

SOURCE: https://www.kitco.com/news/2020-06-04/Trend-reversal-in-silver-is-coming-TD-Securities-bets-long-on-silver.html

Gold Prices Solidly Up as Bulls Step in to Buy The Dip SPONSOR: Labrador Gold $LAB.ca $RIO.ca $WHM.ca $SIC.ca $NXS.ca $NVO.ca

Posted by AGORACOM at 10:31 AM on Thursday, June 4th, 2020

SPONSOR: Labrador Gold – Two successful gold explorers lead the way in the Labrador gold rush targeting the under-explored gold potential of the province. Exploration has already outlined district scale gold on two projects, including a 40km strike length of the Florence Lake greenstone belt, one of two greenstone belts covered by the Hopedale Project. Recently acquired 14km of the potential extension of the new discovery by New Found Gold’s Queensway project to the south. Click Here for More Info

Gold prices are solidly higher in early U.S. trading Thursday, as Wednesday’s sharp sell off has been met with bargain-hunting buying interest by the bulls. Weaker stock markets today are also slightly supportive for the safe-haven metals. August gold futures were last up $14.50 an ounce at $1,719.00. July Comex silver prices were last up $0.052 at $18.00 an ounce.

The just-released weekly jobless claims data showed 1.88 million in new claims, which was in line with market expectations. The marketplace got a pleasant surprise on Wednesday when the May ADP national employment report showed way less job-loss numbers than the marketplace expected. The U.S. Labor Department’s employment situation report for May is out Friday morning, expected to show non-farm payrolls down 8.3 million. In the April jobs report, there was a 20.5 million drop in non-farm payrolls.

Also in focus Thursday is the European Central Bank that held its regular monetary policy meeting. The ECB expanded its Euro bond-buying program by 600 billion Euros and said the program will last into June of 2021. The move by the ECB was expected. Meantime, Euro zone retail sales for April were reported down 11.7% from March and down 19.5%, year-on-year, it was reported today.

It’s a very lucrative & private industry, there are few chances to invest outside the Silicon Valley elite. This company recently went public & its sales are up 10X year over year with even bigger plans staged for 2021 Global stock markets were mixed to weaker in overnight trading. U.S. stock indexes are pointed toward lower openings when the New York day session begins, after hitting three-month highs on Wednesday.

The important outside markets see the U.S. dollar index higher early today on a corrective bounce after hitting an 11-week low Wednesday. Nymex crude oil prices are weaker and trading around $36.50 a barrel. The yield on the benchmark U.S. Treasury 10-year note is currently around 0.75%.  

Other U.S. economic data due for release Thursday includes the Challenger job-cuts report, revised productivity and costs, the international trade report and monthly chain store sales data.

Technically, the gold bulls have the overall near-term technical advantage but a price uptrend on the daily bar chart is in serious jeopardy. Bulls’ next upside price objective is to produce a close in August futures above solid resistance at this week’s high of $1,761.00. Bears’ next near-term downside price objective is pushing futures prices below solid technical support at $1,668.40. First resistance is seen at $1,725.00 and then at Wednesday’s high of $1,738.90. First support is seen at $1,700.00 and then at this week’s low of $1,690.30. Wyckoff’s Market Rating: 7.0

July silver futures bulls have the firm overall near-term technical advantage. Silver bulls’ next upside price objective is closing prices above solid technical resistance at the February high of $19.075 an ounce. The next downside price breakout objective for the bears is closing prices below solid support at $17.00. First resistance is seen at Wednesday’s high of $18.405 and then at $18.50. Next support is seen at this week’s low of $17.675 and then at $17.50. Wyckoff’s Market Rating: 7.0.

SOURCE: https://www.kitco.com/news/2020-06-04/Gold-prices-solidly-up-as-bulls-step-in-to-buy-the-dip.html

Gold & Silver Get Ready For A Big Move Higher SPONSOR: American Creek $AMK.ca $TUD.ca $SII.ca $GTT.ca $AFF.ca $SEA.ca $SA $PVG.ca $AOT.ca $ESK.ca

Posted by AGORACOM at 9:54 AM on Thursday, June 4th, 2020

SPONSOR: American Creek owns a 20% Carried Interest to Production at the Treaty Creek Project in the Golden Triangle. 2019’s first hole averaged 0.683 g/t Au over 780m in a vertical intercept. 2020 drilling has started, with 18,000 to 20,000 metres from 7-10 drill platforms with four diamond drill rigs. The Treaty Creek property is located in the same hydrothermal system as the Pretivm and Seabridge’s KSM deposits and is fully funded for exploration in 2020. Click Here For More Info

Gold and Silver moved lower early on June 2nd and 3rd.  Our research team believes this is a “Washout Low” price rotation following a technical pattern that will prompt a much higher rally in precious metals.  This type of washout price rotation is fairly common before very big moves after Pennant/Flag formations or just after reaching major price trigger levels.

With Gold, a sideways Pennant/Flag formation has been setting up near our GREEN Fibonacci Price Amplitude Resistance Arc.  We believe the downward price rotation recently is a perfect setup for skilled technical traders to take advantage of lower entry price levels.  The GREEN Fibonacci Price Amplitude Arc will very likely be breached over the next 5 to 10 trading days and the price of Gold should rally well above $1850 in the process.  We believe this Washout Rotation is a process of running through the Long Stops just below recent price activity that will end with a defined upside price rally over the next 2 to 5+ weeks.


Silver has set up a completely different type of price pattern – a true Double-Top pattern.  The downward price rotation recently in Silver is indicative of a weaker reaction to this massive resistance pattern and Double-Top.  The likelihood that Silver will find support above $17 and mount a further upside price rally over the next 2 to 5+ weeks is still very strong.  After the deep downward price collapse in Silver took place, just like what happened in 2009 and 2010, the upside potential for Silver is still massive – likely targeting $65 per ounce of higher.

This current Gold to Silver Ratio Monthly chart highlights the recent collapse in the ratio level as Silver rallied from near $12 towards current levels near $18.  A similar spike in the Gold to Silver Ratio took place in 2008-09 – just before the broader market collapse in the US and Global markets took place.  This happens as the initial reaction to risk in the global markets pushes Gold prices a bit higher while Silver, the often overlooked store of value, typically declines in value.

Once the price of Silver starts to rally, pushing the Gold to Silver ratio below 60 typically, both Gold and Silver start to align in price and begin to rally together.  The current level of the Gold to Silver ratio is 94.9.  This suggests that both Gold and Silver have quite a way to go in terms of reaching the “alignment phase”.  Our researchers believe Gold will rally above $2100 to $2400 and Silver will rally above $40 to $50 before the two metals align and begin to rally together in almost equal strength.

Concluding Thoughts:

Pay attention to what happens to precious metals over the next 10 to 15+ days.  If our research is correct, both Gold and Silver will rally higher by about 7.5% to 14% – setting up new price highs for both metals.  When the washout pattern completes, usually a fairly aggressive price trend begins where new price highs are established fairly quickly. Get ready, this should be a really nice upside price swing in precious metals over the next 6+ months or longer.

SOURCE: https://www.fxempire.com/forecasts/article/gold-silver-washout-get-ready-for-a-big-move-higher-653283

American Creek $AMK.ca Provides Update on Its Annual Filings and First Quarter Filings $TUD.ca $SII.ca $GTT.ca $AFF.ca $SEA.ca $SA $PVG.ca $AOT.ca $ESK.ca

Posted by AGORACOM at 9:10 PM on Friday, May 29th, 2020

AMK: TSX-V, OTCBB: ACKRF

American Creek Resources Ltd. (TSXV: AMK) (the “Company” or “American Creek”) – Following its press release of April 29, 2020, the Company is providing a further update on the status of filing of its annual financial statements, management’s discussion and analysis and related CEO and CFO certificates for the year ended December 31, 2019 (collectively, the “Annual Filings“).

On March 18, 2020, the Canadian Securities Administrators announced that they would provide issuers with a 45-day filing extension for filings required on or before June 1, 2020, as a result of COVID-19 pandemic. As such, the British Columbia Securities Commission has enacted BC Instrument 51-515 Temporary Exemption from Certain Corporate Finance Requirements (“BCI 51-515“).

In its April 29, 2020, press release, the Company announced its reliance on the exemption with respect to extending the deadline of the required filings pursuant to BCI 51-515. The Company currently still expects to file the Annual Filings on or prior to June 15, 2020.

The Company will also rely on BCI 51-515 to extend the deadline of filing its first-quarter consolidated interim financial statements, accompanying management’s discussion and analysis, and related CEO and CFO certificates for the three months ended March 31, 2020 (collectively, the “First-Quarter Filings“), which are required to be filed by June 1, 2020 under sections 4.3 and 4.4 of National Instrument 51-102 – Continuous Disclosure Obligations. The Company is continuing to work diligently and currently expects to have the First-Quarter Filings filed on or prior to the extended filing deadline of July 16, 2020.

As required by BC Instrument 51-515, and similar Instruments and Orders enacted in Alberta, Saskatchewan and Ontario, the Company discloses the following:

  • Until such time as the Company has filed the Annual Filings and the First-Quarter Filings, members of management and other insiders are subject to a trading black-out policy that reflects the principles in section 9 of National Policy 11-207 – Failure-to-File Cease Trade Orders and Revocations in Multiple Jurisdictions.
  • The Company confirms that there have been no material business developments, other than those announced through news releases, since November 2019 when the Company filed its third quarter interim financial results for the period ended September 30, 2019.

About American Creek

American Creek is a Canadian junior mineral exploration company with a strong portfolio of gold and silver properties in British Columbia.

Three of those properties are located in the prolific “Golden Triangle”; the Treaty Creek and Electrum joint venture projects with Tudor Gold/Walter Storm as well as the 100% owned past producing Dunwell Mine.

A major drill program was conducted in 2019 at Treaty Creek by JV partner and operator Tudor Gold. The focus of the program was on the Goldstorm zone where drilling has produced very wide intercepts of gold including a 780 meter intercept of 0.683 g/t gold including a higher grade upper portion of 1.095 g/t over 370.5 meters.

The Treaty Creek Project is a Joint Venture with Tudor Gold owning 60% and acting as operator. American Creek and Teuton Resources each have 20% interests in the project. American Creek and Teuton are both fully carried until such time as a Production Notice is issued, at which time they are required to contribute their respective 20% share of development costs. Until such time, Tudor is required to fund all exploration and development costs while both American Creek and Teuton have “free rides”.

A drill program was also recently concluded on the 100% owned Dunwell Mine property located near Stewart. Assay results are pending.

The Corporation also holds the Gold Hill, Austruck-Bonanza, Ample Goldmax, Silver Side, and Glitter King properties located in other prospective areas of the province.

For further information please contact Kelvin Burton at: Phone: 403 752-4040 or Email: [email protected]. Information relating to the Company is available on its website at www.americancreek.com