Treaty Creek Project is Fully Funded for the 2020 Exploration Season
Last year Eric Sprott became the largest external investor in Treaty Creek in B.C.’s Golden Triangle. He stated “Treaty Creek has a great shot at having 20 million ounces of gold.†A very successful program was run hitting wide intervals of gold in every drill hole. This year we’ll see if Eric is right as the objective of this year’s program is to develop a resource calculation.
The Goldstorm Zone will host a significantly larger drilling program in 2020
- 18,000 to 20,000 Meter Drill Program
- 7-10 Drill Platforms
- Four Diamond Drill Rigs
The drill program is designed to extend and to explore the limits of Goldstorm System
- The current conceptual model for Goldstorm is 1 billion tonnes at close to 1 gram of gold
- The system remains open in all directions and to depth
- The best mineralization encountered to date is from the two consecutive 150m step-out holes to the Northeast:
- GS-19-42 yield 0.849 g/t Au Eq over 780 m with 1.275 g/t Au Eq over 370.5m
- GS-19-47 yield 0.697 g/t Au Eq over 1,081.5m with 0.867 g/t Au Eq over 301.5m
- The best Southeast extension:
- GS-19-52 yields 0.783 g/t Au Eq over 601.5m
- Includes 1.062 g/t Au Eq over 336.0m (NR dated March 3rd, 2020)
- GS-19-52 yields 0.783 g/t Au Eq over 601.5m

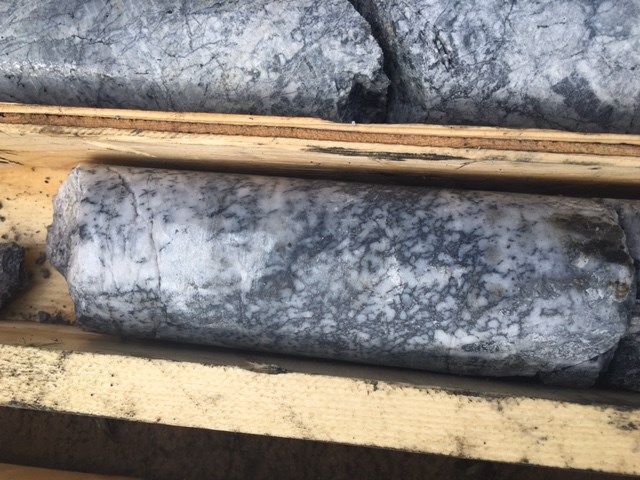
The Sulphurets Hydrothermal System
More Information About The Treaty Creek Project Can Be Found Here
Treaty Creek JV Partnership
The Treaty Creek Project is a Joint Venture with Tudor Gold owning 3/5th and acting as operator. American Creek and Teuton Resources each have a 1/5th interest in the project. American Creek and Teuton are both fully carried until such time as a Production Notice is issued, at which time they are required to contribute their respective 20% share of development costs. Until such time, Tudor is required to fund all exploration and development costs while both American Creek and Teuton have “free ridesâ€.
Treaty Creek Background
The Treaty Creek Project lies in the same hydrothermal system as Pretium’s Brucejack mine and Seabridge’s KSM deposits with far better logistics.
American Creeek Responds to Shareholder Questions Re: COVID-19:
American Creek has received numerous messages from our investor base asking similar questions. We’ve compiled the most common questions with their answers for you below:
Q: Has Covid 19 affected the ability of the office to keep running and will it affect the company’s ability to run programs this year?
- The Canadian Minister of Public Safety and Emergency Preparedness has deemed exploration and mining essential services during the current COVID-19 outbreak. This specifically includes mineral exploration and development. At the same time, explorers, miners and those in related businesses need to be in compliance with local regulations with regard to health and safety practices in order to protect workers and others from the COVID-19 virus.
Both American Creek and its JV Partner Tudor Gold are following these guidelines and fully expect to carry on operations in the office and in the field.
Q: Does American Creek have enough money to carry on operations or will it have to raise money this year?
- The company raised sufficient money in 2019 to carry on operations through 2020. This currently includes an exploration / drill program on the Dunwell Mine property and may include work on Gold Hill and other properties as well.
Q: How will Covid 19 and the resulting drop in the stock market and economy affect the precious metals industry?
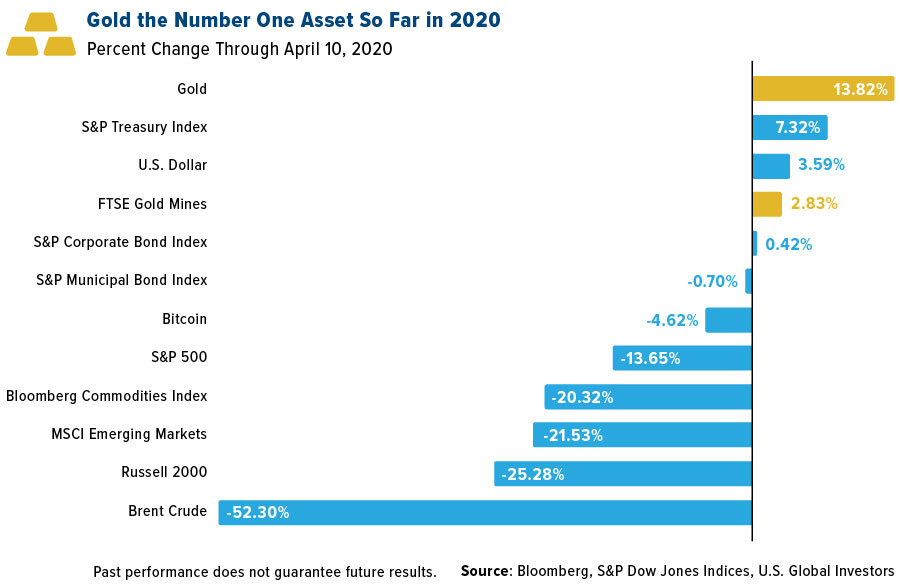
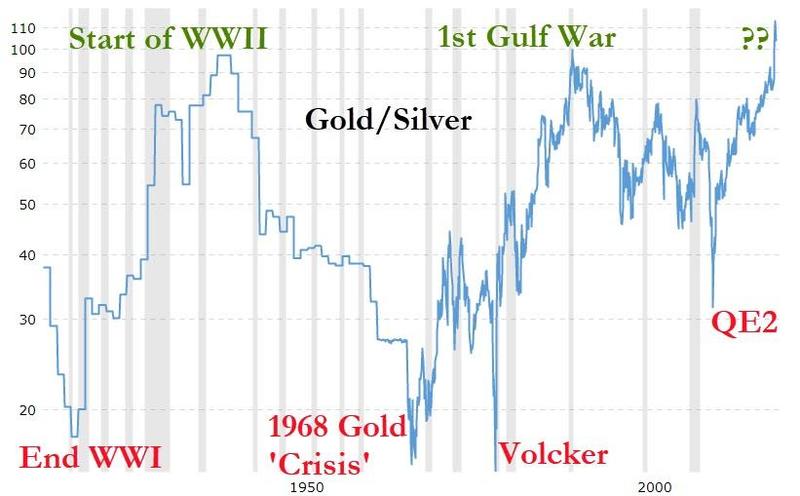
- As the stock market and the economy drop there are institutions, brokerage houses, and individuals who will sell everything right across the board to cover themselves. Precious metals or stocks in precious metal companies are no exception. We’ve already seen this taking place. However, gold served its purpose in retaining value as its drop was very minimal compared to the stock markets.
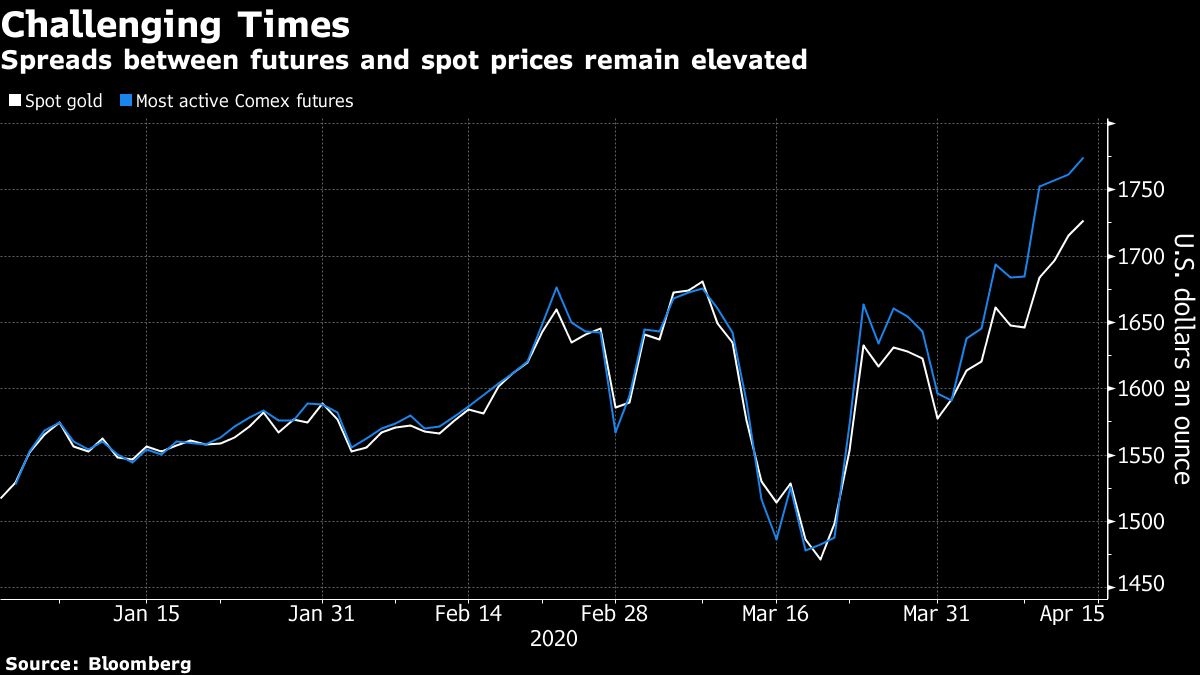
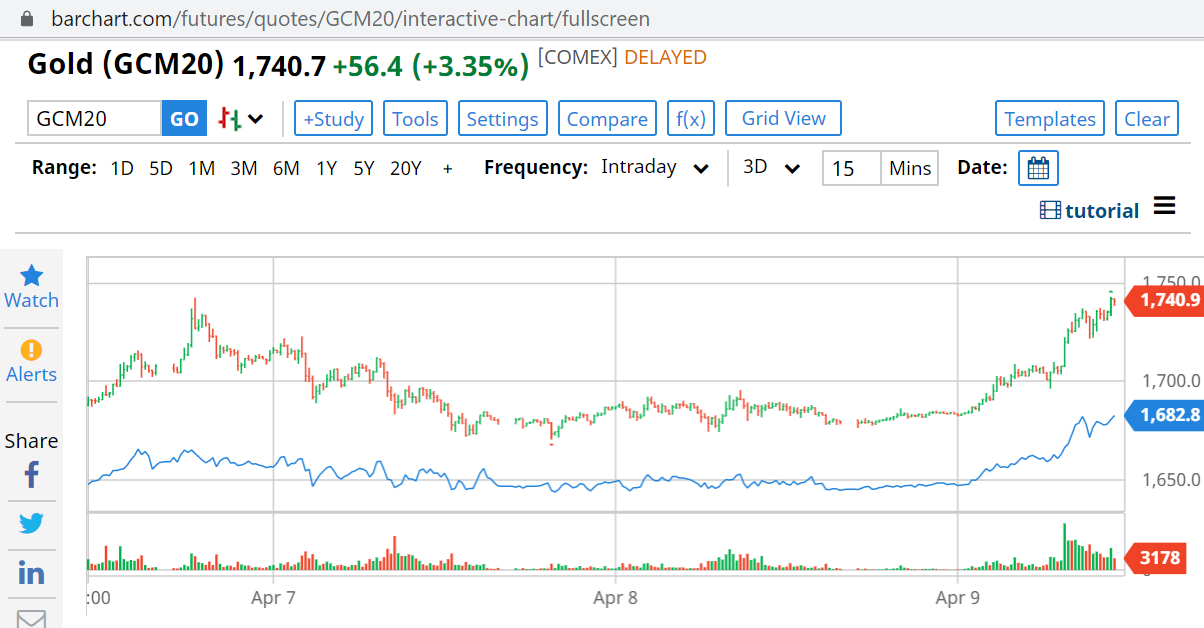
It’s governments reactions to the falling stock markets and economy that will have a profound effect on Gold. We are reading that more money has been created out of thin air in the last few weeks than in any time in history. All the gold in the world is worth approximately $9.5 trillion dollars and just the United States alone is creating $2 trillion, plus $4 trillion from the Fed, plus another $2 trillion plus in infrastructure spending (and that’s not counting the $2.5 trillion put into the repo markets). The rest of the world is acting similarly. Inflation (an increase of the monetary supply) does have a direct effect on gold (especially once money velocity increases). We are already seeing the very early stages of this upward pressure as gold futures spiked to a 7.5-year high of $1,742.60 an ounce in overnight trading (April 6-7, 2020). Gold will continue to be volatile but will have greater upward pressure the more governments try to help the economy.
Q: Why should people invest in American Creek when there are so many gold plays out there?
- While there are a number of excellent projects out there, even within the Golden Triangle, I’m not aware of one with as much potential poised to be realized over the next two years. Since he’s the expert I’ll refer to Eric Sprott’s comments concerning the Goldstorm on Treaty Creek: “They have a good shot at having 20 million ounces of gold.â€â€œSo that’s the sort of play that I like where man, if the price of gold goes to $1,700 or $2,000 these plays will look so economically viable and the stock will go up so much, and the analogy I use is Seabridge back in 2000. I remember buying it at a dollar…and Seabridge went from $1 to $35 dollars! That is what we are looking for – a dollar to $35 dollars, set you up for life!†American Creek investors benefit through the development of Goldstorm while having no associated costs and while retaining a 1:3 ownership ratio with Tudor Gold. The timing couldn’t be better for a project of this scale and quality. Add to that the development of the Dunwell Mine along with the possibility of programs on our other high potential projects and we feel that we offer people the best possible investment. American Creek is in a position of strength as it has the ability to continue developing core assets and bring value to its shareholders amidst a world of economic uncertainty. We will continue to do all we can to help our shareholders prosper.
Q: What opportunity do you see for the company moving forward?
- While this pandemic, and our governments responses to it, will do irreparable damage to each of our finances and liberties, we are extremely optimistic about precious metals, the precious metals production and exploration industry, and specifically American Creek Resources.
Rick Rule, CEO of Sprott US Global, was recently quoted saying:
Get ready for a “rip your face off†gold market.
Industry Experts Have Already Pointed Out That:
- The drop in oil will lower the costs for producers at the same time that gold is going up.
- As gold goes higher and producers start producing tremendous amounts of cash…they are going to want to deploy it back in their own sector…there will be a competing FEEDING FRENZY amongst the producers to go buy the best assets and eventually the worst assets of the gold sector
We believe that the Goldstorm deposit at Treaty Creek is quickly becoming one of most significant assets in the gold industry and will be highly sought after.
About American Creek
American Creek is a Canadian junior mineral exploration company with a strong portfolio of gold and silver properties in British Columbia. Three of those properties are located in the prolific “Golden Triangleâ€; the Treaty Creek and Electrum joint venture projects with Tudor Gold/Walter Storm as well as the 100% owned past producing Dunwell Mine.
- For further information please contact Kelvin Burton at: Phone: 403 752-4040 or Email: [email protected]. Information relating to the Corporation is available on its website at: www.americancreek.com


