Agoracom Blog Home

Posts Tagged ‘EV’

Lithium One Exploration Update $NAM.ca, Winnipeg River Pegmatite Field, Manitoba $GLEN $LIC.ca $LIX.ca

Posted by AGORACOM-JC at 9:12 AM on Thursday, September 27th, 2018

New age large

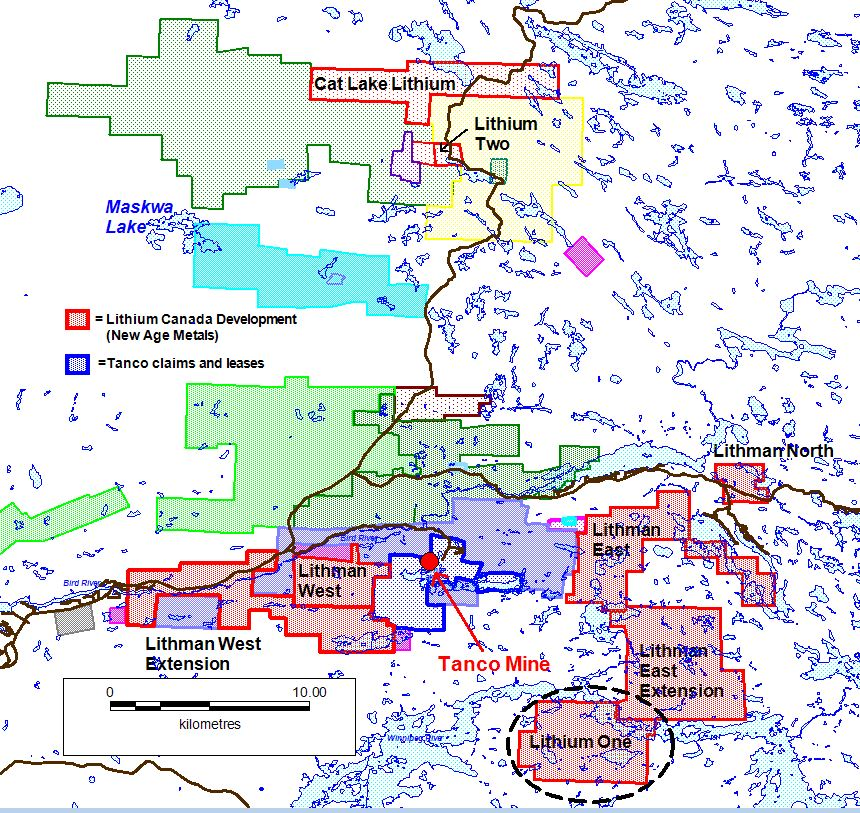
  • – The NAM/AAZ Option/Joint Venture has eight pegmatite hosted Lithium Projects in the Winnipeg River Pegmatite Field, located in SE Manitoba- The mineral claims are 100% owned by NAM’s Lithium Division, Lithium Canada Development- The eight projects are strategically situated within the Winnipeg River Pegmatite Field, which hosts the world class Tanco Pegmatite that has been mined for Tantalum, Cesium and Spodumene (one of the primary Lithium bearing minerals) in varying capacities, since 1969.

    – 2018 surface exploration has been completed on the Lithium Two, and Lithman East Projects and is underway on Lithium One.

    – Drill permits have been applied for on the Lithium Two and Lithium One Projects and the company is awaiting approval from the Manitoba government.

    – NAMs flagship project is the 100% owned River Valley Project, North America’s largest undeveloped primary Platinum Group Metals (PGM) Project in Sudbury, Ontario. See the most recent press releases and our Chairman’s message for the River Valley Project PEA dated July 25, 2018 and August 1, 2018 at our website (www.newagemetals.com) .

September, 27th 2018 / Rockport, Canada – New Age Metals Inc. (NAM) (TSX.V: NAM; OTCQB: NMTLF; FSE: P7J.F) New Age Metals is pleased to provide an update on the present exploration program with regards to the company’s Manitoba Lithium Projects. Currently surface exploration is focusing on the Lithium One Project (see Figure 1). The company’s Lithium Division, Lithium Canada Developments, has an aggressive exploration and development plan for 2018/2019. NAM’s Manitoba projects are financed via an Option/Joint Venture agreement with Azincourt Energy (AAZ) (see News Release Jan 18th, 2018).

Lithium One Exploration Update

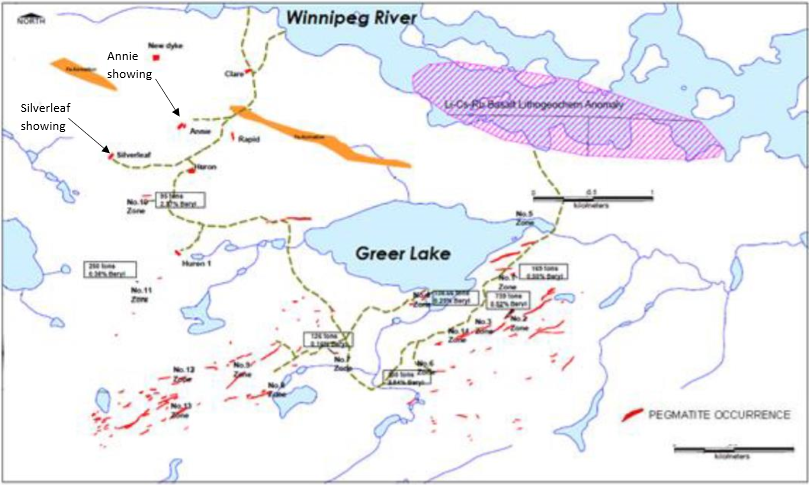
Reconnaissance field exploration by the company in 2016 returned assays from surface exposed pegmatites up to 4.33% Li2O (see News Release – Dec 8th, 2016) from the Silverleaf Pegmatite. There are several clusters of pegmatites that are being explored during the 2018 field exploration season.


Click Image To View Full Size

Figure 1: NAM/AAZ Joint Venture Project Location Map – Winnipeg River Pegmatite Field. Lithium One Project is highlighted.

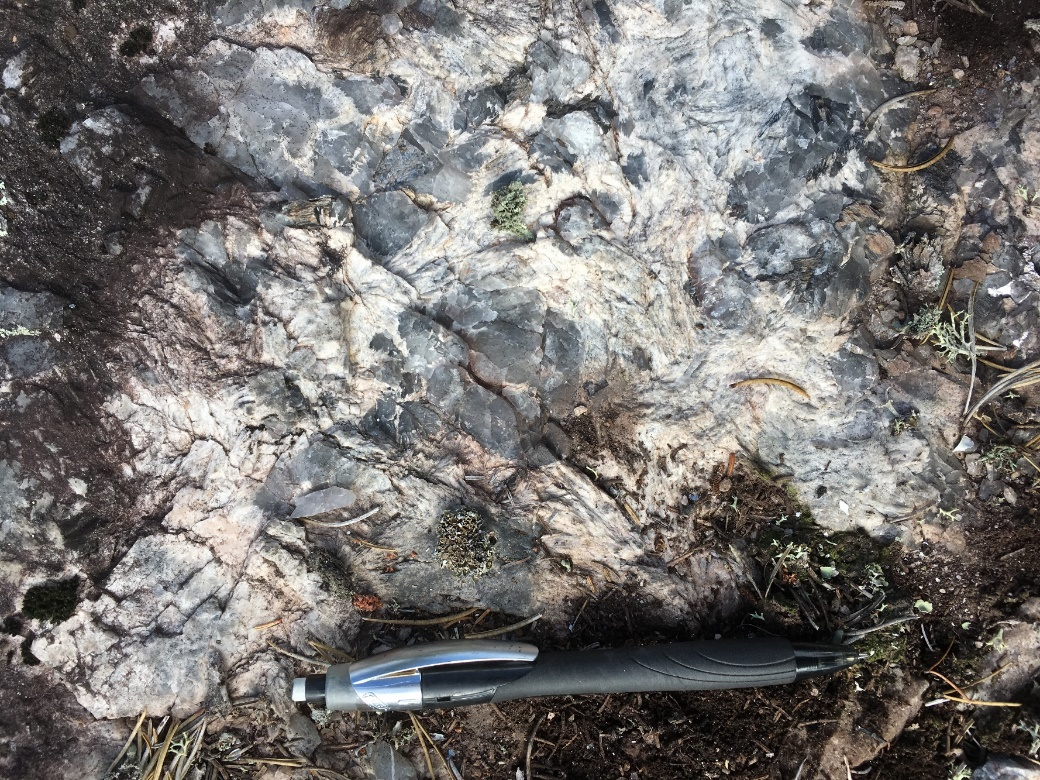
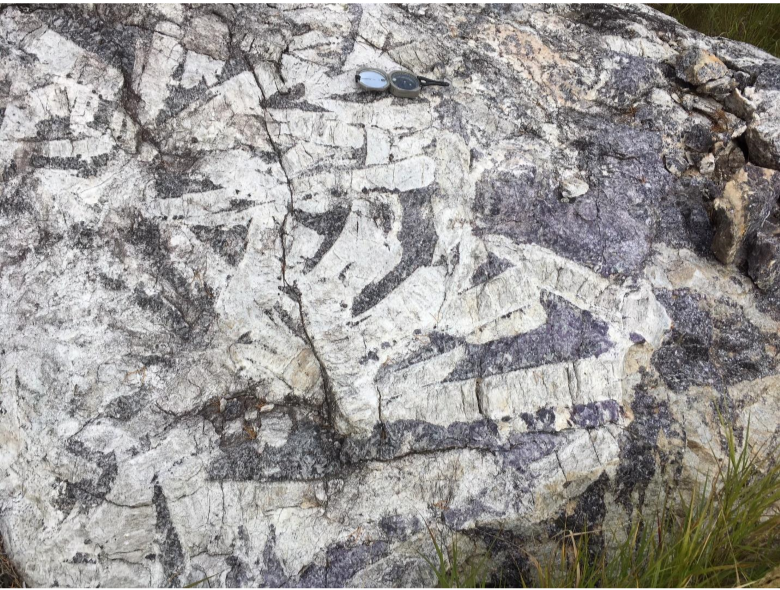
The Annie Pegmatite area (see Figure 2) is generally underlain by a broad continuous multiphase unit of pegmatitic granite. Detailed mapping has revealed at least 2 distinct structurally orientations of evolved pegmatite units that may be strataform or oblique along fault structures that offset established stratigraphy. Lithium bearing mineralogy has been discovered in these strataform and oblique evolved pegmatitic structures. Pending assay analysis for Lithium and other mineralogical content at observed sites within the Annie Pegmatite, an exploration targeting recommendation will be prepared. These targeting recommendations will hopefully help define potential structural connection implications between the Annie and Silverleaf showings, should they exist.


Click Image To View Full Size

Figure 2: Annie Pegmatite showing in outcrop with abundant SQUI (Spodumene Quartz Intergrowths) mineralization – The pen in the photo is 8 cm in length.

Sampling and mapping are ongoing. Several batches of samples have been sent to the lab for analysis. Numerous pegmatites are being explored on the Lithium One Project (see Figure 3).


Click Image To View Full Size

Figure 3: Pegmatite Location Map. Lithium One Project – Manitoba. The circle in the top left of the map is around the two pegmatite showings – Silverleaf and Annie on the Lithium One Project.

The Silverleaf Pegmatite (see Figure 4) is one of the most spectacular and mineralogically complex pegmatites known on the property. Figure 4 is a photo of the spectacular spodumene-lepidolite mineralization seen on surface. Numerous other interesting pegmatites have been mapped with the focus being to understand and increase the potential of the project.


Click Image To View Full Size

Figure 4: White spodumene blades in a matrix of lepidolite (Lithium Mica) from the Silverleaf showing.

Joint Venture Agreement

In January of 2018, NAM announced a signed final agreement with Azincourt Energy Corp. (TSX.V: AAZ) for the Manitoba Lithium Projects, (News Release: January 15, 2018). This Pegmatite Field hosts the world class Tanco Pegmatite that has been mined for Tantalum, Cesium and Spodumene (one of the primary Lithium ore minerals) in varying capacities, since 1969. NAM’s Lithium Projects are strategically situated in this prolific Pegmatite Field. Presently, NAM, under its subsidiary Lithium Canada Developments, is one of the largest mineral claim holders in the Winnipeg River Pegmatite Field for Lithium. Azincourt Energy Corp. as our option/joint venture is financed for and has committed to a minimum of $600,000 to be expended on exploration in Manitoba for 2018.

OPT-IN LIST

If you have not done so already, we encourage you to sign up on our website (www.newagemetals.com) to receive our updated news.

ABOUT NAM’S PGM DIVISION

NAM’s flagship project is its 100% owned River Valley PGM Project (NAM Website – River Valley Project) in the Sudbury Mining District of Northern Ontario (100 km east of Sudbury, Ontario). See results from the most recent NI 43-101 resource update below in Table 1. NAM management and consultants are currently designing a complete drill program to be executed in 2019 for the River Valley Project. This plan will consider previously proposed drill parameters and will be based on the most recent geophysical assessment and consultant expertise. The projects first economic study, a Preliminary Economic Assessment (PEA) is underway and is being overseen by Mr. Michael Neumann, P.Eng., a veteran mining engineer and one of NAM’s directors. See the most recent press releases for the River Valley Project PEA which detail the appointment of P&E Mining Consultants and DRA Americas to jointly conduct the study, dated July 25, 2018 and August 1, 2018 respectively. Our new Fall Chairman’s message can be accessed at our website (www.newagemetals.com) .

On April 4th, 2018, NAM signed an agreement with one of Alaska’s top geological consulting companies. The companies stated objective is to acquire additional PGM and Rare Metal projects in Alaska. On April 18th, 2018, NAM announced the right to purchase 100% of the Genesis PGM Project, NAM’s first Alaskan PGM acquisition related to the April 4th agreement. The Genesis PGM Project is a road accessible, under explored, highly prospective, multi-prospect drill ready Palladium (Pd)- Platinum (Pt)- Nickel (Ni)- Copper (Cu) property. A comprehensive report on previous exploration and future phases of work was completed by Avalon Development of Fairbanks Alaska in August 2018 on Genesis. A full sampling program will be conducted to continue to outline additional mineralization along the 800-meter by 40-meter mineralized zone

On August 29, the Avalon report was submitted to NAM, management is actively seeking an option/joint-venture partner for this road accessible PGM and Multiple Element Project using the Prospector Generator business model.

The results of the updated Mineral Resource Estimate for NAM’s flagship River Valley PGM Project are tabulated in Table 1 below (0.4 g/t PdEq cut-off).

Class Tonnes

‘,000

Pd (g/t) Pt (g/t) Rh (g/t) Au (g/t) Cu (%) Ni (%) Co (%) PdEq (g/t)
Measured 62,877.5 0.49 0.19 0.02 0.03 0.05 0.01 0.002 0.99
Indicated 97,855.2 0.40 0.16 0.02 0.03 0.05 0.01 0.002 0.83
Meas +Ind 160,732.7 0.44 0.17 0.02 0.03 0.05 0.01 0.002 0.90
Inferred 127,662.0 0.27 0.12 0.01 0.02 0.05 0.02 0.002 0.66
Class PGM + Au (oz) PdEq (oz) PtEq (oz) AuEq (oz)
Measured 1,440,200 1,999,600 1,999,600 1,136,900
Indicated 1,856,900 2,626,700 2,626,700 1,463,800
Meas +Ind 3,297,200 4,626,300 4,626,300 2,600,700
Inferred 1,578,400 2,713,900 2,713,900 1,323,800

Notes:

  1. A.CIM definition standards were followed for the resource estimation.
  2. B.The 2018 Mineral Resource models used Ordinary Kriging grade estimation within a three-dimensional block model with mineralized zones defined by wireframed solids.
  3. C.A base cut-off grade of 0.4 g/t PdEq was used for reporting Mineral Resources.
  4. D.Palladium Equivalent (PdEq) calculated using (US$): $1,000/oz Pd, $1,000/oz Pt, $1,350/oz Au, $1750/oz Rh, $3.20/lb Cu, $5.50/lb Ni, $36/lb Co.
  5. E.Numbers may not add exactly due to rounding.
  6. F.Mineral Resources that are not Mineral Reserves do not have economic viability.
  7. G. The Inferred Mineral Resource in this estimate has a lower level of confidence that that applied to an Indicated Mineral Resource and must not be converted to a Mineral Reserve. It is reasonably expected that the majority of the Inferred Mineral Resource could be upgraded to an Indicated Mineral Resource with continued exploration.

QUALIFIED PERSON

The contents contained herein that relate to Exploration Results or Mineral Resources is based on information compiled, reviewed or prepared by Carey Galeschuk, a consulting geoscientist for New Age Metals. Mr. Galeschuk is the Qualified Person as defined by National Instrument 43-101 and has reviewed and approved the technical content of this news release with regard to technical aspects of the Lithium Division.

On behalf of the Board of Directors

“Harry Barr”

Harry G. Barr

Chairman and CEO

Neither the TSX Venture Exchange nor its Regulation Services Provider (as that term is defined in the policies of the TSX Venture Exchange) accepts responsibility for the adequacy or accuracy of this release.

Cautionary Note Regarding Forward Looking Statements: This release contains forward-looking statements that involve risks and uncertainties. These statements may differ materially from actual future events or results and are based on current expectations or beliefs. For this purpose, statements of historical fact may be deemed to be forward-looking statements. In addition, forward-looking statements include statements in which the Company uses words such as “continue”, “efforts”, “expect”, “believe”, “anticipate”, “confident”, “intend”, “strategy”, “plan”, “will”, “estimate”, “project”, “goal”, “target”, “prospects”, “optimistic” or similar expressions. These statements by their nature involve risks and uncertainties, and actual results may differ materially depending on a variety of important factors, including, among others, the Company’s ability and continuation of efforts to timely and completely make available adequate current public information, additional or different regulatory and legal requirements and restrictions that may be imposed, and other factors as may be discussed in the documents filed by the Company on SEDAR (www.sedar.com), including the most recent reports that identify important risk factors that could cause actual results to differ from those contained in the forward-looking statements. The Company does not undertake any obligation to review or confirm analysts’ expectations or estimates or to release publicly any revisions to any forward-looking statements to reflect events or circumstances after the date hereof or to reflect the occurrence of unanticipated events. Investors should not place undue reliance on forward-looking statements.


#Lithium Demand Flourishes on Global #EV Popularity $NAM.ca $TSLA $LIC.ca $LIX.ca

Posted by AGORACOM-JC at 3:14 PM on Tuesday, August 28th, 2018
  • According to a research report published by Zion Market Research, the global lithium-ion battery market was valued at approximately USD 31.17 Billion in 2016
  • Market is expected to generate USD 67.70 Billion of revenue by the end of 2022 while growing at a CAGR of 13.7% between 2017 and 2022

NEW YORK, August 28, 2018 — According to a research report published by Zion Market Research, the global lithium-ion battery market was valued at approximately USD 31.17 Billion in 2016. The market is expected to generate USD 67.70 Billion of revenue by the end of 2022 while growing at a CAGR of 13.7% between 2017 and 2022. These rechargeable batteries are highly popular because of their small compact size and the ability to deliver high energy density, which makes lithium-ion batteries popular in the consumer electronics sector and for electric vehicles (EVs). Currently, the consumer electronics segment, which includes products such as laptops, phones and tablets, has the largest share of the total lithium-ion battery market revenue. In the near future, the market is expected to shift to electric vehicles as demand in the automotive industry grows. Blue Eagle Lithium Inc. (OTC: BEAG), First Cobalt Corp (OTC: FTSSF), Millennial Lithium Corp. (OTC: MLNLF), NRG Metals Inc. (OTC: NRGMF), Nemaska Lithium Inc. (OTC: NMKEF)

Electric vehicles which are powered by lithium-ion batteries help eliminate diesel emissions and this has encouraged governments to push for accelerated deployment of these vehicles, as well as a push to establish new regulations. The shift towards electric vehicles is slow, yet it is causing battery components such as lithium and cobalt to skyrocket in price, as demand begins to outweigh supply. According to a report by CNBC, Simon Moores, Managing Director of Research at Benchmark Mineral Intelligence, said, “Lithium is coming of age in a big way. It’s the core ingredient to 99% of electric vehicles and as a result, demand is going through the roof.”

Source:https://www.prnewswire.com/news-releases/lithium-demand-flourishes-on-global-ev-popularity-829612616.html

#Lithium Demand Continues To Soar $NAM.ca $LIC.ca $LIX.ca $TSLA

Posted by AGORACOM-JC at 10:38 AM on Wednesday, July 4th, 2018
  • A steady roll-out of wireless products, such as power tools, vacuums, phones and computers over the past decade has driven increased demand for the metals that go into lithium batteries
  • Franklin Equity Group’s Steve Land explains why the growing adoption of electric vehicles (EVs) is one particular development that is arousing investor interest in those resources

A Bit of Background

For decades, lithium and its compounds have been used in a variety of ways, including in pharmaceuticals and chemical manufacturing. However, lithium’s popularity in recent years can be tied to the demand for lithium-ion batteries that power EVs, as well as smartphones, laptops and other products.

Although they are called lithium-ion batteries, they also contain significant amounts of cobalt, copper, nickel and sometimes manganese or aluminum. Battery technology continues to evolve, as companies look to reduce their reliance on harder to source materials. However, a need to produce a safe battery capable of delivering the high-performance characteristic needed for an EV makes this a slow process. Given the potentially rapid growth in EVs, battery suppliers are worried about shortages of critical elements in the years ahead.

The World Embraces Electric Vehicles

According to the International Energy Agency (IEA), by the end of 2017, there were more than three million EVs globally.1 As the chart below shows, China has the largest stock of these vehicles, with more than 1.2 million EVs.

China has the longest-running national program to build up its EV volumes, including financial incentives to manufacture and buy the vehicles, as well as build out the country’s EV-charging station infrastructure. However, major world economies, including France, India, the United Kingdom and Norway, have set strict target dates by which they want to have specific percentages of EVs on the road.

Based on these new policies, the IEA projects there could be as many as 125 million EVs on the world’s roads by 2030.2 Under its high-adoption scenario, where EVs comprise 30% of the global auto market by 2030, the agency projects up to 220 million electric cars could be on the road by then.3

Demand for EV Batteries Rises

In our view, the demand for lithium-ion batteries from technology firms and vehicle manufacturers is likely to grow exponentially, with automakers already scrambling to secure supplies as more customers switch their gas-guzzling vehicles for an electric alternative with significantly lower maintenance and operating costs. As the chart below shows, Bloomberg projects demand for both lithium and cobalt from the EV industry to increase at a compound annual growth rate of about 20% through 2040.4

The growing adoption of EVs has already led lithium and cobalt prices to rise dramatically over the past two years. In 2017 alone, the prices for lithium and cobalt rose 29% and 129% respectively, and many producers’ share prices also increased sharply.5

The Road Ahead for Lithium Battery Production

Lithium is a relatively common element, so many market observers believe there should be enough lithium in the ground to meet the needs of an electric-car future. However, we’ve already seen periods of market disruption amid concerns that heightened demand for lithium-ion batteries for EVs, laptops, drones and smartphones could prompt shortages.

Although common, developing naturally occurring lithium into a form and purity level suitable for modern battery usage can be a challenging process. Producers are building new, more efficient processing centers in response to the expected demand spike but it can still take several years for a new plant to reach the required specifications for EV battery-grade lithium.

With cobalt, virtually all (99%) of the world’s supply comes as by-products, where a small amount of cobalt is recovered from certain large copper and nickel mines around the world, making it difficult to grow supply. Although the nickel and copper markets are already much larger with diverse areas of demand, EV growth can still be a significant demand driver, especially when combined with the limited current investment in new mines.

Investment Implications

Despite the IEA’s rosy outlook for EV adoption, its trajectory is likely to remain a hotly debated topic for the next decade. On the one hand, it seems clear that with tightening government emission standards and a growing consumer desire for low-pollution vehicles, EVs are going to be a critical part of the transportation mix going forward.

On the other hand, we do see some possible production issues for the metals that comprise EV batteries in the near term. The mining industry is still recovering from explosive Chinese-led demand growth in the early 2000s, a boom that resulted in the development of many of the world’s known ore bodies. What is left either requires higher-than-average costs or exists in more challenging mining jurisdictions such as central Africa.

Also, it typically takes about 15 years from first discovery to production for new mines. Mining companies need this lead time for exploration, engineering studies and proper environmental work before they can even consider beginning construction on new mines.

At this time, there are relatively few new copper and nickel projects in the development pipeline. Instead, major mining companies are focused on repairing balance sheets and returning cash to shareholders, coming off of a period of rapid expansion and cost blowouts.

The Democratic Republic of Congo (DRC) accounts for about 63% of the world’s cobalt production,6 and many of the world’s undeveloped, low-cost copper and cobalt deposits are located in the DRC. That presents many unique operating and regulatory challenges as well as a concentration of supply risk to the EV industry.

Battery manufacturers are looking for ways to reduce the amount of cobalt in lithium batteries. However, it remains a critical safety and performance component for several of the leading battery chemistries.

The market for lithium outside of the battery industry is limited, so EV adoption will require the market to grow multiple times its current size. There are a number of lithium projects moving forward, but there are relatively few examples in recent history where raw materials companies have tried to deliver such a large increase in production in such a relatively short timeframe. Based on our experience, the only thing for certain is that all of the projects won’t be on time and under budget.

On paper, the amount of mined lithium seems to be tracking ahead of current demand scenarios, leading to a number of bearish forecasts from several analysts. The real challenge with lithium is less with the mining and more with the industry’s ability to process and upgrade the material to a high-quality, battery-grade product. As a result, we believe the companies that are best positioned to benefit from EV demand growth are those with existing lithium capacity capable of delivering reliable, high-quality, battery-grade supply.

Mass adoption of EVs also has significant implications beyond the battery. Major infrastructure improvements will be required to create charging networks capable of high-speed charging. New power sources will have to be developed to provide the energy, and significant power distribution upgrades will have to take place to accommodate high voltage at-home charging in many parts of the world. These improvements are favorable for the copper and aluminum demand outlook.

Overall, we see a positive backdrop developing over the next decade for metals tied to the global roll-out of EVs, and thus we see opportunity in natural resource companies with exposure to the key building blocks of an electrified future.

The comments, opinions and analyses expressed herein are for informational purposes only and should not be considered individual investment advice or recommendations to invest in any security or to adopt any investment strategy. Because market and economic conditions are subject to rapid change, comments, opinions and analyses are rendered as of the date of the posting and may change without notice. The material is not intended as a complete analysis of every material fact regarding any industry, security or investment.

This information is intended for US residents only.

CFA® and Chartered Financial Analyst® are trademarks owned by CFA Institute.

To get insights from Franklin Templeton Investments delivered to your inbox, subscribe to the Beyond Bulls & Bears blog.

For timely investing tidbits, follow us on Twitter @FTI_US and on LinkedIn.

What are the Risks?

Franklin Natural Resources Fund

All investments involve risks, including possible loss of principal. Stock prices fluctuate, sometimes rapidly and dramatically, due to factors affecting individual companies, particular industries or sectors or general market conditions. Investing in a fund concentrating in the natural resources sector involves special risks, including increased susceptibility to adverse economic and regulatory developments affecting the sector. Growth stock prices may fall dramatically if the company fails to meet projections of earnings or revenue; their prices may be more volatile than other securities, particularly over the short term. Smaller companies can be particularly sensitive to changes in economic conditions and have less certain growth prospects than larger, more established companies and can be volatile, especially over the short term. The fund may also invest in foreign companies, which involve special risks, including currency fluctuations and political uncertainty. These and other risks are described more fully in the fund’s prospectus.

Investors should carefully consider a fund’s investment goals, risks, sales charges and expenses before investing. Download a prospectus, which contains this and other information. Please carefully read a prospectus before you invest or send money.

__________________________________

1. Source: International Energy Agency, “Global EV Outlook 2018: Towards cross-modal electrification,” May 30, 2018. The report refers to an electric car as either a battery electric vehicle (BEV) or a plug-in hybrid electric vehicle (PHEV) in the passenger light-duty vehicle (PLDV) segment. It does not include hybrid electric vehicles (HEVs) without a plug.

2. Source: International Energy Agency, “Global EV Outlook 2018: Towards cross-modal electrification,” May 30, 2018.

3. Ibid.

4. Sources: Bloomberg, U.S. Geological Survey, estimates as of June 23, 2017. Important data provider notices and terms available at www.franklintempletondatasources.com.

5. Source: Bloomberg New Energy Finance, “The Force Is With Clean Energy: 10 Predictions for 2018,” January 16, 2018. Important data provider notices and terms available at www.franklintempletondatasources.com.

6. Source: Bloomberg, “We’ll All Be Relying on Congo to Power Our Electric Cars,” October 27, 2017. Important data provider notices and terms available at www.franklintempletondatasources.com.

The Global X Lithium ETF (LIT) closed at $32.43 on Tuesday, up $0.07 (+0.22%). Year-to-date, LIT has declined -16.33%, versus a 1.92% rise in the benchmark S&P 500 index during the same period.

Source: https://etfdailynews.com/2018/07/04/lithium-demand-continues-to-soar-lit/