
The drilling success at American Creek’s Treaty Creek property in BC’s Golden Triangle is showing the potential to give shareholders the type of return experienced by investors in the neighbouring Seabridge KSM a decade ago. Treaty Creek’s Goldstorm deposit is producing world class results including 563m of 0.98 g/t gold and the most recent hole; a 780 meter intercept of 0.683 g/t gold including a high grade upper portion of 1.095 g/t over 370.5 meters. There are some distinct advantages that the Goldstorm has over the KSM which puts American Creek in a uniquely undervalued position within the area.
3 Critical Factors Highlight Treaty Creek Advantage Over KSM:
- Treaty Creek Similarities to KSM:
- Part of the same Sulphurets Hydrothermal System that contains a mind boggling 188M oz gold, 1.2B oz silver and 55B lbs of copper (all categories) to date (P&P reserves of 47M oz Au, 214M oz Ag, and 10B lbs Cu)
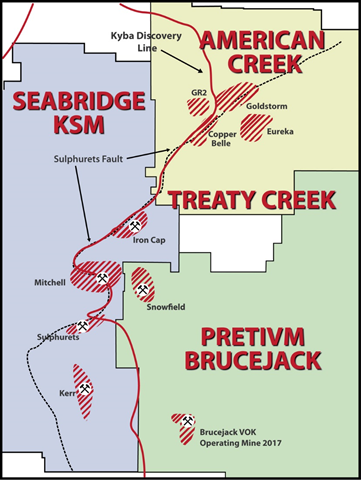
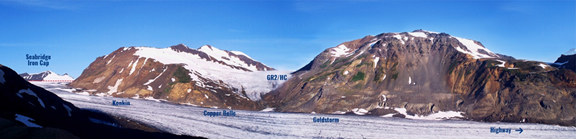
- Same trend – deposits occur about every 2-3 km going north with gold grades increasing as the system extends northward – The Goldstorm zone on Treaty Creek is the most northerly deposit
- Same Sulphurets thrust fault which Seabridge states was responsible for the KSM deposits – same type of mineral formation beneath the fault
- Same types of world-scale deposits (Porphyry and intrusion related) on both properties
2. Treaty Creek Advantages over KSM:
- Better logistics – Treaty Creek is located on “the right side of the mountain†with direct access to power and highway leading to the shipping port
- Potentially better grades with initial estimates of 1.25 g/t Au at the Goldstorm / Copper Belle Deposit
- Potential open pit design requiring a fraction of the capital cost of KSM with a shorter pay back period
- Unlike the KSM which consists of copper deposits with low-grade gold, Goldstorm is a gold deposit and does not rely on the value other metals
- At the discovery stage of the mining life-cycle where biggest gains are typically made. AMK offers considerable more shareholder upside with each ounce added compared to KSM.
3. KSM dependence on Treaty Creek:
- KSM is dependent on twin 22.8km tunnels (MTT), of which 12.2km lies within the Treaty Creek mineral tenures, to get KSM ore to a proposed processing facility and tailings pond
- The proposed route for the MTT runs through Treaty Creek in the same general location as the following:
- The Kyba Discovery Line – a major geological marker for large deposits
- The Sulphurets thrust fault – a major geological marker for large deposits
- Geoclastic sequencing – a major geological marker for large deposits
- Magnetotelluric anomalies indicating potential large mineral deposits
- Magnetic anomalies indicating potential large mineral deposits
- Electromagnetic anomalies indicating potential deposits
- Mineralized zones on surface including the SW, AW, and Konkin zones
- Mineralized zones to depth including Copper Belle, GR2, and Goldstorm zones
- Seabridge requires consent from Treaty Creek owners for tunnels that would intersect potential deposits
- The proposed route for the MTT runs directly through the mineralized zones on the Goldstorm currently being developed for an open pit mining operation
Treaty Creek Project Summary Click Here: Treaty Creek Summary
American Creek has already increased close to 300% since spring and yet only the initial results from the Goldstorm have come out. Based on the geology, geophysics, and results so far it looks as though things have just started for the company. A major drill program is presently being conducted at Treaty Creek by JV partner and operator Tudor Gold. There are now two drills working on the Goldstorm zone with the objective of defining a significant maiden gold resource. The last hole reported included a 780 meter intercept of 0.683 g/t gold including a higher grade upper portion of 1.095 g/t over 370.5 meters. The Treaty Creek Project is a Joint Venture with Tudor Gold owning 60% and acting as operator, with American Creek holding a 20% interest in the project. American Creek is fully carried until such time as a Production Notice is issued. Until such time, Tudor is required to fund all exploration and development costs while American Creek has a “free rideâ€.
For further information please contact Kelvin Burton at: Phone: 403 752-4040 or Email: [email protected]. Information relating to the Corporation is available on its website at www.americancreek.com
Hub on Agoracom
FULL DISCLOSURE: American Creek is an advertising client of AGORA Internet Relations Corp.


