Agoracom Blog Home

Posts Tagged ‘gold’

American Creek Resources $AMK.ca Reports 90.5m of 1.21 g/t #Gold at Treaty Creek, Including 70.5m of 1.47 g/t Gold $SEA $SA $SKE.ca $TUD.ca $PVG

Posted by AGORACOM-JC at 7:21 AM on Wednesday, January 10th, 2018

Hublogolarge2 copy

  • Mineralization grading 1.21 g/tonne gold from 24 to 114.5m depth,
  • Including a higher-grade intercept of 70.5m grading 1.47 g/t gold from 31.5 to 102m

Cardston, AB – American Creek Resources Ltd. (TSX.V: AMK) (the “Corporation”) is pleased to report on results from its 2017 drill program on the Copper Belle zone of the Company’s Treaty Creek property located in B.C.’s Golden Triangle adjacent to Seabridge’s KSM project and Pretivm’s Brucejack mine.

CB-17-12, a step-out hole drilled on the Copper Belle zone, intersected various mineralized zones where the most significant was 90.5m of continuous mineralization grading 1.21 g/tonne gold from 24 to 114.5m depth, including a higher-grade intercept of 70.5m grading 1.47 g/t gold from 31.5 to 102m. Hole CB-17-12 was a 564m hole that was collared adjacent to the west side of Treaty glacier where ice ablation (glacier melt-back) has exposed new opportunities for exploration access. Hole CB 17-12 is 110m south of CB-16-03 that graded 58m from 88 to 146m of 1.11 g/t Au; and 122m from 304 to 426m of 0.97 g/t Au. Hole CB 16-03 was drilled uphill at a higher elevation (see map link).

Drill results for hole CB-17-12 are summarized in the table below:

Darren Blaney, President and CEO, stated: “CB-17-12 shows a continuance of significant mineralization found in the numerous holes released so far.  The fact that holes on Copper Belle have excellent results, extend over a one-kilometer range, have continuity between, and are open to the north and south, makes this a very significant system.  This is emphasized by the fact that it, along with the high grade GR2/HC zone, are located within the same hydrothermal system as the world class KSM deposits and the Brucejack mine.  We look forward to the remaining assays and planned resource calculation(s) on the Treaty Creek project”.     

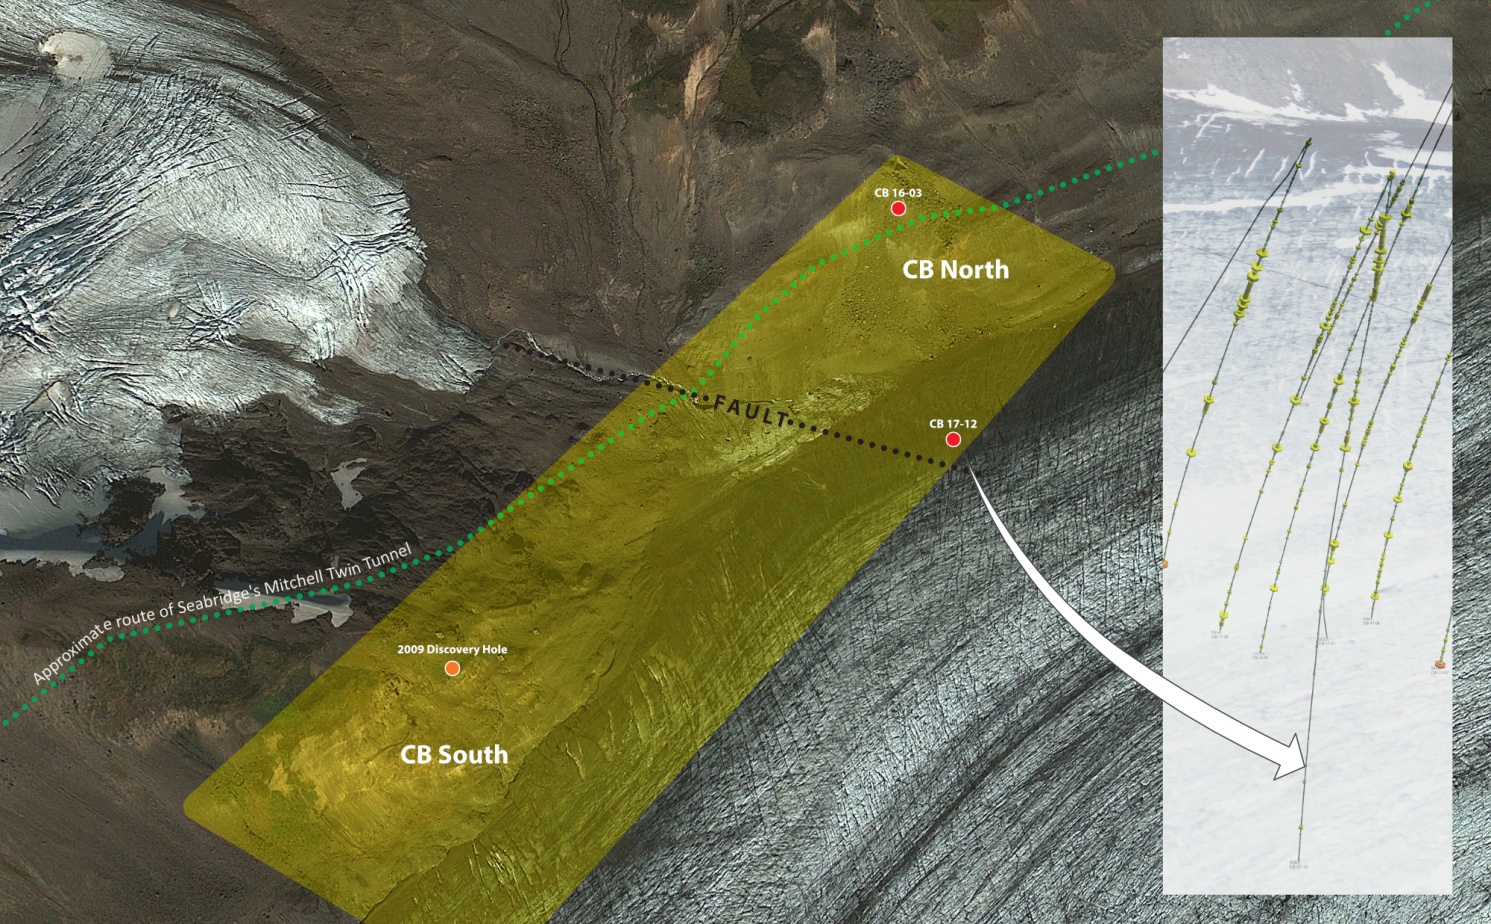
The Copper Belle 2017 resource delineation program comprised 27 drill holes to depths below 700m (an estimated 13,722m) and step-outs of 50m where topography permitted. Results from additional drill holes of the 2017 drill program at Copper Belle are still pending. Drill holes were targeted oblique to the northwesterly plunge of the main mineralized zone. A block of delineated mineralization will form the basis for a preliminary resource estimate. All drill holes were down hole surveyed at 25m stations using a Reflex Multi-shot device.

The Magnetotelluric Geophysical Survey program (MT Survey) completed on the property in 2016 was effectively utilized as a guide for the drill program. The MT Survey suggests that the mineralization continues to the southwest toward the Iron Cap deposit of Seabridge Gold Inc. The MT Survey also suggests that the mineralized zone is open along strike and at depth. Tudor Gold’s 2017 drill program was located just five kilometers north of the Iron Cap deposit and the Company intends to step out to the south in its 2018 program to see if it confirms a relationship between the two areas.

Location map of the drill holes on the Copper Belle

https://orders.newsfilecorp.com/files/4494/31840_a1515513337318_39.jpg

Drill hole samples were assayed by Activation Laboratories Ltd. in Kamloops, BC. Analytical accuracy and precision are monitored by the submission of blanks, certified standards and duplicate samples inserted at regular intervals into the sample stream by Tudor Gold personnel. Activation Laboratories quality system complies with the requirements for the International Standards ISO 17025: 2005.

The Qualified Person for the Treaty Creek results in this new release is James A. McCrea, P.Geo. for the purposes of National Instrument 43-101. He has read and approved the scientific and technical information that forms the basis for the disclosure contained in this news release.

Background on the Treaty Creek Project

The Treaty Creek Project is situated immediately north of Seabridge Gold’s KSM property and near Pretium’s Valley of the Kings Mine, both of which are situated in BC’s Golden Triangle along the Sulphurets and Brucejack fault systems that continue northward into the Treaty Creek property.

In 2017 Tudor conducted a major drill program (approximately 20,000 metres) on the Treaty Creek property. The objective of the drill program was to define a gold resource on the Copper Belle zone and to determine the future potential of the high-grade gold/silver/zinc GR2 zone located in a separate area adjacent to the Copper Belle.

Seabridge Gold’s proposed development plan for their KSM Project includes an access tunnel system through the Treaty Creek property as a key component.  The approximate trajectory of the tunnels can be found on the drill map link above.

The Treaty Creek Project is a joint venture between Tudor, Teuton Resources Corp., and American Creek. Tudor is the operator and holds a 60% interest with both American Creek and Teuton each holding respective 20% carried interests in the property (American Creek and Teuton are not required to contribute to their proportionate costs until a production notice is given).

A summary of the Treaty Creek Project can be viewed here:

http://www.americancreek.com/images/pdf/Treaty_Creek_Joint_Venture_Project.pdf

About American Creek

American Creek holds a strong portfolio of gold and silver properties in British Columbia. The portfolio includes three gold/silver properties in the heart of the Golden Triangle; the Treaty Creek and Electrum joint ventures with Walter Storm/Tudor, as well as the recently acquired 100% owned past producing Dunwell Mine. Other properties held throughout BC include the Gold Hill, Austruck-Bonanza, Ample Goldmax, Silver Side, and Glitter King.

For further information please contact Kelvin Burton at: Phone: 403 752-4040 or Email: [email protected]. Information relating to the Corporation is available on its website at www.americancreek.com

Cautionary Statements regarding Forward-Looking Information

Certain statements contained in this press release constitute forward-looking information. These statements relate to future events or future performance. The use of any of the words “could”, “intend”, “expect”, “believe”, “will”, “projected”, “estimated” and similar expressions and statements relating to matters that are not historical facts are intended to identify forward-looking information and are based on the Corporation’s current belief or assumptions as to the outcome and timing of such future events. Actual future results may differ materially.

All statements other than statements of historical fact included in this release, including, without limitation, statements regarding potential mineralization and geological merits of the Treaty Creek Project and other future plans, objectives or expectations of the Corporation are forward-looking statements that involve various risks and uncertainties. There can be no assurance that such statements will prove to be accurate and actual results and future events could differ materially from those anticipated in such statements. Forward-looking statements are based on a number of material factors and assumptions. Important factors that could cause actual results to differ materially from the Corporation’s expectations include actual exploration results, changes in project parameters as plans continue to be refined, results of future resource estimates, future metal prices, availability of capital and financing on acceptable terms, general economic, market or business conditions, uninsured risks, regulatory changes, defects in title, availability of personnel, materials and equipment on a timely basis, accidents or equipment breakdowns, delays in receiving government approvals, unanticipated environmental impacts on operations and costs to remedy same, and other exploration or other risks detailed herein and from time to time in the filings made by the Corporation with securities regulators. Although the Corporation has attempted to identify important factors that could cause actual actions, events or results to differ from those described in forward-looking statements, there may be other factors that cause such actions, events or results to differ materially from those anticipated. There can be no assurance that forward-looking statements will prove to be accurate and accordingly readers are cautioned not to place undue reliance on forward-looking statements.

Neither the TSX Venture Exchange nor its Regulation Services Provider (as that term is defined in the policies of the TSX Venture Exchange) accepts responsibility for the adequacy or accuracy of this release.

GGX Gold Extends Drilling Targets 600 Meters

Posted by AGORACOM at 6:26 AM on Wednesday, January 10th, 2018


https://s3.amazonaws.com/s3.agoracom.com/public/companies/logos/564602/hub/ggx_large.png

    • Soil sample analytical results from the 2017 fall program on the Gold Drop Property
    • Conducted in the  Southwest Zone between the COD gold showing and the COD North gold showing and north of the gold bearing Everest vein
    • A total of 334 soil samples were collected along 31 soil lines. These lines were spaced 25m apart


Gold Drop Property, Greenwood British Columbia

Vancouver, British Columbia (FSCwire)GGX Gold Corp. (TSXV: GGX) (the “Company” or “GGX”) is pleased to announce the receipt of soil sample analytical results from the 2017 fall program on the Gold Drop Property, located in southern British Columbia. The soil sampling geochemical program was conducted in the Gold Drop Southwest Zone between the COD gold showing and the COD North gold showing and north of the gold bearing Everest vein. The program identified gold soil anomalies including high values of 0.061, 0.073 and 0.088 ppm gold.


To view the graphic in its original size, please click here


A total of 334 soil samples were collected during the program and submitted to ALS Minerals in North Vancouver for gold and multi-element analysis. The samples were screened to 180 micron. Gold analysis was by aqua regia extraction with ICP-MS finish. Multi-element analysis was by aqua regia extraction and ICP-MS and ICP-AES. Soil samples were collected along 31 soil lines. These lines were spaced 25m apart with a 25m sample interval. The soil lines were of varying lengths but on average 250m long.


The soil sampling program identified several soil gold anomalies in the Southwest Zone, including numerous samples exceeding 0.01 ppm Au (including high values of 0.061, 0.073 and 0.088 ppm Au). The most distinct anomaly or anomalies is in the COD North area, where anomalous values are concentrated between two historical workings. The soil sampling program extended the target area for at least 600 meters northeast of the area of 2017 drilling and trenching. The Company is planning follow up work in this area in 2018 including a trenching program. The program also identified other gold anomalies near the new COD adit and northeast of the COD trenches.


The soil sampling program in the Gold Drop Southwest Zone helped identify a new vein exposure in a small, 2 meter deep historic adit 175 meters north of the C.O.D. trench. The adit is driven on a North-south striking quartz vein that is on strike with the C.O.D. Vein, and appears to be of the same style as the Detonia/Jewel quartz vein. Another vein exposure north of the trench was also located by hand pitting on local quartz float. Bedrock quartz samples from the small hand pit material returned values of 4.97 g/t Au and 30.7 g/t Ag. Samples of boulder material found outside of the small adit returned values of 1.28 g/t Au and 6.97 g/t Ag. (News Release of Nov 8, 2017).


To view the graphic in its original size, please click here


To view the graphic in its original size, please click here


David Martin, P.Geo., a Qualified Person as defined by NI 43-101 and consultant for GGX, is responsible for the technical information contained in this News Release.


On Behalf of the Board of Directors,

Barry Brown, Director

604-488-3900


Investor Relations:

Mr.  Jack Singh: 604-720-6598     E-mail: [email protected]


“ We don’t have to do this, we get to do this ” 

The Crew

#Gold Has Best Year Since 2010 With Near 14% Gain In 2017 #Mining $AMK.ca $EXS.ca $MQR.ca $GGX.ca $GR.ca $GZD.ca

Posted by AGORACOM-JC at 2:00 PM on Wednesday, January 3rd, 2018
  • Gold posted second straight annual gain in USD in 2017
  • Gold in 2017: up 13.6% USD, up 2.7% GBP, down 1.4% EUR
  • 2017 is gold’s best year since 29.5% gain in 2010
  • Strong performance despite rate hikes and stock bubble
  • India’s gold imports surged 67% in 2017, Turkish, Chinese demand strong
  • Gold finished 2017 with longest rally since June 2016
  • 2018: Currency War and The Year of the Phoenix?

Gold waved a very positive goodbye to 2017 and was delighted to shout ‘Happy New Year!’ to all investors. In doing so, gold bullion prices advanced for an eighth session yesterday, extending its longest stretch of gains since mid-2011.

This was the perfect start to a new year which followed an annual surge of nearly 14%. 2017 is the second year of gains for gold. In 2016 it posted 14% gains, its best gains since the 29.5% gain in 2010.

Gold bullion’s stellar advance is even more impressive when one considers the extremely mixed year that was 2017. It ranged from Federal Reserve rate hikes to rapidly advancing stock markets. The year’s events were like a tug-of-war on the drivers of the gold price.

Gold: bad or good?

2017 on paper perhaps should not have seen a 14% gain in the gold price.

There was an acceleration in global economic growth as countries began to keep pace with one another. Much to Trump’s delight official figures showed the U.S. economy performed well. Not only did the the unemployment rate touch a record low, but inflation also remained subdued.

Meanwhile the Fed hiked interest rates three times, something many believed would be the kryptonite to gold’s superhuman strength.

Investments that are often seen to as alternatives to gold performed exceedingly well. The U.S. stock market continued its record-breaking rally, while bitcoin and other cryptocurrencies experienced what can only be described as a bubblicious and parabolic rise in the last few weeks of 2017.

And, right at the last minute the Republicans managed to pass a very dodgy looking tax bill, prompting Trump to peacock around even more.

Following Trump’s election there had been high hopes for the price of gold. After all, here was a man who had been elected without political experience and on the back of creating social and economic divisions. However, following Trump’s inauguration there was a post-election sell-off at the start of the year. Many were clearly feeling positive about Trump’s impact on both the domestic and international stage.

As various unexpected scenarios played out, from failure to get much done in the White House to sober-rattling with North Korea, the precious metal began to climb. Towards the end of summer, in early-September the gold price hit a year-high of $1346/oz. It then quickly sold off.

Whilst the yellow metal finished the year with a respectable run of gains, the final figures did not match those of say, the S&P 500 which climbed by over 19% in the same year.

Does this mean that relatively speaking the gold price is something we shouldn’t be delighted with? Not at all. The year of 2017 was one of arguably bearish events for the price of gold yet it still made near 14% gains, better than money in a savings account.

This second year of climbing by gold should serve as a timely reminder that the precious metal is not something that will be poked and prodded thanks to short-term, unsustainable economic and political events. Gold investment is for the long-term and there is little benefit thinking that one event will affect the reasons to hold gold.

All of the ‘positives’ of 2017 such as low inflation, Fed hikes and tax bills being passed arguably came about because of farcical economic readings and political manoeuvring. None of the statistics or decisions made as a result are sustainable, particularly against a background of increasing geopolitical risk. The gold price reflected this, particularly in its reactions to what should have been bearish Fed-rate hikes.

It is safe to say that in 2018 gold will be sent significantly higher thanks to ongoing US dollar weakness, higher debt and deficits,  stronger growth combined with potential wage inflation, coming together in a perfect storm with geopolitical risks.

One of the key reasons for gold’s 14% climb in USD terms is thanks to the weakness in the US Dollar itself. There was a strong correlation between the gold price and the greenback in 2017. It’s also worth mentioning that the level of yield of the inflation-protected 10-year Treasuries at the end of the year was similar to the level at the beginning of the year (about 0.5 percent). People do not want the global reserve currency anymore.

2018: The year of the Phoenix?

Nearly 30 years ago The Economist predicted that 2018 would be the year of a new currency uprising. You have to give the magazine some kudos for this prediction. Given what we saw in 2017 with both the rise in bitcoin, cryptocurrencies generally and, of course, efforts by Russia and China to build financial allegiances away from the US dollar, a new world currency in 2018 is more likely than not.

That’s right, whilst the financial media can talk as much as they like about how great 2017 turned out to be, there were plenty of events behind the mainstream wall that were clearly preparing for a financial world where decisions of the last decade come back to bite us.

Moves by Russia and China to step away from US dollar hegemony continued and rapidly progressed in 2017. This forthcoming year does not suggest any sign of let up. Much of the moves away from the US dollar involve the use of gold as the intermediary currency. Exchanges and trade agreements are in full swing.

We also cannot mention 2017 without bitcoin. This was the year that the lead cryptocurrency truly arrived and established itself in the minds of the establishment.

As we have explained several times, bitcoin is not a substitute for gold. It has attracted a lot of hot money in the last year, but long-term this is not to the detriment of gold.

The upward trajectory of bitcoin places it firmly in bubble territory. This is good for gold, as Walter Otstott, a senior broker at Dallas Commodity Co. explained to Bloomberg. ‘If 2017’s hottest asset comes crashing back to Earth, speculative money may be drawn back into gold…He sees gold peaking at $1,600 an ounce next year, compared with the price on Friday of about $1,297.’

Our own experts also see great things for gold this year, particularly thanks to geopolitical threats by those truly looking to end US-power : North Korea.

GoldCore’s Mark O’Byrne told Bloomberg:

‘Gold could end the year at $1,500 if geopolitics heats up in North Korea or the Middle East.’ This is despite gold’s lack of reaction at the various threats from both Trump and Kim Jong-Un. However, gold loves uncertainty and this is certainty a situation which is dripping in volatile uncertainty.

2018: Will it hold its own against the last two years?

2017 showed us that there is still a show to be played out by governments and central banks. There is still a farce to be seen when it comes to reassuring us about the state of the global economy.

Gold’s price rise and the dollar’s weakness shows that there are question marks over this recovery. Gold may be indicating  the reality that very little has changed since the financial crisis. Any ‘fixes’ have been done with a bit of sellotape and little else. We build over the cracks rather than repair them.

Gold investors were rewarded this year for their patience. This is particularly the case given there is seemingly little difference to where we find ourselves today compared to the last two years. Arguably the world is much more uncertain.

2018 is a year not to take chances and to own physical, allocated an segregated gold. The risks in the system are bigger than ever and investors would be wise to take all measures to protect their wealth.

News and Commentary

Gold hits 3-1/2-month highs before dipping on dollar recovery (Reuters.com)

Asian Stocks Extend Advance After U.S. Tech Surge (Bloomberg.com)

Global Manufacturers Strain to Keep Up With Faster Economy (Bloomberg.com)

Gold hits three-month peak after late December rally (Reuters.com)

Silver will fare better than gold in 2018: Goldman Sachs (Rediff.com)

By itself gold could solve Sudan’s economic problems, mining minister says (DabangaSudan.org)

The criminal underwold is dropping bitcoin for another cryptocurrency (Bloomberg.com)

India gold imports surge 67 percent in 2017 on restocking, retail demand – GFMS (Reuters.com)

Turkey’s gold-backed bonds: Government in quest for hidden treasures (Nikkei.com)

Nomi Prins: The Next Financial Crisis Will Be Worse Than the Last One (ZeroHedge.com)

Gold Prices (LBMA AM)

03 Jan: USD 1,314.60, GBP 968.20 & EUR 1,092.96 per ounce
02 Jan: USD 1,312.80, GBP 968.85 & EUR 1,087.52 per ounce
29 Dec: USD 1,296.50, GBP 960.84 & EUR 1,082.45 per ounce
28 Dec: USD 1,291.60, GBP 960.43 & EUR 1,082.75 per ounce
27 Dec: USD 1,285.40, GBP 958.78 & EUR 1,081.54 per ounce
22 Dec: USD 1,268.05, GBP 947.74 & EUR 1,069.85 per ounce
21 Dec: USD 1,265.85, GBP 945.97 & EUR 1,065.09 per ounce

Silver Prices (LBMA)

03 Jan: USD 17.12, GBP 12.63 & EUR 14.25 per ounce
02 Jan: USD 17.06, GBP 12.59 & EUR 14.15 per ounce
29 Dec: USD 16.87, GBP 12.48 & EUR 14.07 per ounce
28 Dec: USD 16.74, GBP 12.46 & EUR 14.02 per ounce
27 Dec: USD 16.50, GBP 12.30 & EUR 13.87 per ounce
22 Dec: USD 16.18, GBP 12.08 & EUR 13.65 per ounce
21 Dec: USD 16.15, GBP 12.08 & EUR 13.61 per ounce

Source: http://news.goldseek.com/GoldSeek/1514986020.php

AMERICAN CREEK REPORTS ON TREATY CREEK – COPPER BELLE HOLE CB-17-24 WHICH INTERSECTED 115.5 M OF 1.31 G/T GOLD INCLUDING 39 M OF 2.38 G/T GOLD $SEA $SA $SKE.ca $TUD.ca $PVG

Posted by AGORACOM at 9:01 AM on Thursday, December 14th, 2017

Hublogolarge2 copy

  • Final results for the 2017 exploration season from the GR2/HC zone of the Treaty Creek project.
  • HC extension of the GR2 zone was discovered during the 2017 exploration program and carries high-grade gold, silver and base metal mineralization
  • 115.5m of 1.31 G/T Gold Including 39m of 2.38 G/T Gold


American Creek Resources Ltd. has provided information on Tudor Gold’s final results for the 2017 exploration season from the GR2/HC zone of the Treaty Creek project. The Treaty Creek project is situated immediately north of Seabridge Gold’s KSM property and near Pretium’s Valley of the Kings mine, both of which are situated in British Columbia’s Golden Triangle along the Sulphurets and Brucejack fault systems that continue northward into the Treaty Creek property.

The HC extension of the GR2 zone was discovered during the 2017 exploration program and carries high-grade gold, silver and base metal mineralization. The HC drill program augmented the previous drill holes in the zone and consisted of 17 drill holes totalling 5,401 metres in 2017. The program was designed with a maximum of 50-metre stepouts in the mineralized zone to prepare for a preliminary resource estimate.

The GR2/HC zone appears to be a gold-rich volcanic-hosted massive sulphide deposit in which the feeder vein system and the stratabound lenses have been intersected. A later silver (lead-zinc-antimony-copper) vein system was also found reactivating some of the previous structures in the same area where the HC extension is located. These veins are late in the formation and are hosted in the volcaniclastic sequence or in the younger Jurassic Hazelton sequence, crosscutting (and reactivating) previous HC related feeder vein system and HC stratabound lenses. The RR Ag-base metal vein holes are collared 800 metres north of the HC zone, following the same structure.

Thirty-six drill holes have been drilled to date in the GR2/HC, covering an area approximately 400 m along strike and 450 m down dip at 50 m space increments that show consistent geology and which demonstrate the distribution and continuity of the feeder vein system, the stratabound zone and the late silver-base metal vein system. Historical surface sampling carried out by previous operators to both the north and south of the GR2/HC zone indicates that the main mineralized structure potentially extends 3,000 m along strike. The mineralized structure remains open to the north and south beyond the existing drill holes, and down dip.

Significant drill results are summarized in the attached tables (all distance measurements reported in metres).

    
                    HC ZONE                       

Hole         From      To   Interval* Au g/t  Ag g/t

HC-17-09    79.05   81.05          2   12.21        
including   79.05   79.95        0.9    10.5     8.3
including   79.95    80.6       0.65    11.7    15.2
including    80.6   81.05       0.45    16.4    68.5
and         81.05    81.6       0.55   0.399     8.6
and          81.6    82.4        0.8    1.71     5.2
HC-17-11   221.15     230        9.7    4.89        
including   222.7   224.5        1.8   10.27        
including   221.1  222.15       1.05    3.17      11
           222.15   222.7       0.55    0.24     3.7
            222.7   223.1        0.4    9.48     6.3
            223.1   223.5        0.4    9.14     7.2
            223.5     224        0.5    3.48     9.8
              224   224.5        0.5    18.6      11
            224.5     225        0.5    2.96     7.9
              225   225.5        0.5    1.12     6.3
            225.5  226.25       0.75    4.16    19.3
           226.25  227.15        0.9     8.9     9.4
           227.15  227.75        0.6    3.42     5.9
           227.75  229.15        1.4    2.23     6.9
           229.15     230       0.85     1.6     6.2
              230   230.8        0.8    7.27     9.3
            230.8   231.9        1.1   0.518     3.9
            231.9     233        1.1    2.93     8.9
              233   233.9        0.9    1.71     4.7
HC-17-13    306.7   316.1        9.4    4.25        
including   306.7  311.35       4.65    5.81        
including   306.7   307.5        0.8    4.84    12.9
            307.5   308.5          1    6.42    10.9
            308.5   309.5          1    1.34     9.6
            309.5   310.5          1    11.9    19.4
            310.5  311.35       0.85    4.08    10.9
           311.35  312.35          1    1.06    10.8
           312.35  312.95        0.6    1.55    12.3
           312.95  313.45        0.5     3.6       9
           313.45   313.8       0.35    4.58     5.2
            313.8  314.15       0.35   0.882     4.8
           314.15  314.75        0.6    7.65    20.8
           314.75   315.2       0.45    1.59     8.4
            315.2  315.45       0.25   0.184     5.1
           315.45   316.1       0.65    2.91     2.5
HC-17-15    290.7   291.4        0.7    7.86    21.1
and         298.6   300.1        1.5    4.03        
including   298.6   299.1        0.5       3        
            299.1   299.4        0.3    6.58        
            299.4   300.1        0.7    3.68        
HC-17-16    306.9   307.4        0.5    1.28        
and         307.4   308.3        0.9    6.77        
                                                    
                       HC FEEDER VEINS                          

Hole         From      To   Interval* Au g/t  Ag g/t    AuEq** (g/t)

HC-17-10    274.8   275.6        0.8    6.42   5.136               
and         275.6   276.3        0.7    4.05   2.835               
HC-17-11   181.35  182.75        1.4   10.44                  15.96
including  181.35  182.25        0.9    11.8    31.2               
and        182.25  182.75        0.5    7.99     433               
HC-17-17    94.95   95.85        0.9     5.7                       
and         380.6  381.75       1.15    8.17                       
                                                                   
                    HC AG (BASE METAL) VEINS                      

Hole         From      To   Interval* Au g/t   Ag g/t   AuEq** (g/t)

HC-17-08     38.2    38.5        0.3    10.7      151         12.62
and         91.55    91.8       0.25    14.5      530         21.25
and          98.2    98.6        0.4    5.18      6.2              
and         100.1   100.5        0.4   0.529     4730         60.81
HC-17-09     87.8    88.4        0.6    1.14     1190         16.31
and         143.4  146.25       2.85    1.01 1,118.35         15.26
including   143.4  144.05       0.65   0.552     1730         14.69
and        144.05  144.65        0.6   0.082       78          0.65
and        144.65  146.25        1.6    1.54     1260         28.16
HC-17-13      206     207          1    1.27    647.8          9.53
including     206   206.6        0.6     1.2      731         10.52
including   206.6     207        0.4    1.38      523          8.05
and           207  207.55       0.55   0.486     75.8              
and        207.55   208.2       0.65   0.381      247          3.53
and         208.2  208.95       0.75   0.182       79              
and        208.95   209.5       0.55    0.43      314          4.43
and        216.65  218.85       1.65     5.4   123.56          9.42
including  216.65   217.1       0.45    3.33      132          5.01
including   217.1   217.8        0.7    10.5      298         14.30
including   217.8   218.3        0.5   0.746      7.7          0.84
including   218.3  218.85       0.55    4.84     28.1          5.20
HC-17-16      100  100.95       0.95    1.39      157          3.39
and         205.1   205.5        0.4   0.785      425          6.20
and         221.3   221.5        0.2   0.042      300          3.87
and         275.3     276        0.7   0.492      105          1.83
and           276     277          1   0.498      176          2.74
HC-17-17    222.9  223.85       0.95    2.38      122          3.93
and        228.35     229       0.65   0.672     68.3          1.54
and           299   233.6        4.6    1.09   417.51          6.41
including     229  229.45       0.45    0.58      314          4.58
including  229.45   230.3       0.85    1.12      864         12.13
including   230.3  230.85       0.55   0.602      107          1.97
including  230.85   231.2       0.35   0.637      234          3.62
including   231.2  231.65       0.45   0.891     14.8          1.08
including  231.65   232.4       0.75    3.11        3          3.15
including   232.4   233.6        1.2   0.422      746          9.93
                                                                   
          RR AG-BASE METAL VEINS         

Hole      From   To Interval*  Ag g/t

RR-17-03  41.3   42      0.7      119  
and         48 48.8      0.8      544  
and         57 57.6      0.6      206  
and         62   63        1      166  
RR-17-04     6    7        1      399  
and          7    8        1      339  
                                       
* True thickness of all above mineralized 
  intervals still to be determined.


** AuEq calculated assuming Au $1,275 (U.S.)
   per ounce and Ag $16 (U.S.) per oz.

Note that only precious metals were reported on.
    

Darren Blaney, chief executive officer of American Creek, stated: “The discovery of the new HC extension is a very welcome bonus to this year’s Treaty Creek drill program. The GR2/HC system appears to have potential to be very extensive, which would add significant value to the adjoining Copper Belle bulk tonnage gold zone, which was the main focus of this year’s drill program. A large polymetallic zone with high-grade gold and silver would be a most welcome addition to the project.”

Two thousand seventeen drill results from the Copper Belle gold zone at Treaty Creek are still pending and will be reported on once received.

Background on the Treaty Creek project

Tudor conducted a major drill program (approximately 20,000 metres) on the Treaty Creek property this summer with the objective of defining a gold resource on the Copper Belle zone.

The Treaty Creek project is a joint venture between Tudor, Teuton Resources Corp. and American Creek. Tudor is the operator and holds a 60-per-cent interest with both American Creek and Teuton each holding respective 20-per-cent carried interests in the property (fully carried until a production notice is given).

Electrum project road completion

The corporation also reports that Tudor Gold recently completed construction of an access road extension on the Electrum project connecting the existing Granduc haul road to the New Blast/Shiny Cliff high-grade gold and silver zones which are the focus of a planned 10,000-ton bulk sample.

In Tudor’s recent news release, Walter Storm, president and chief executive officer, stated: “We are very pleased to have completed this access road, which will now allow us to proceed with a 10,000-ton bulk sample of this high-grade gold/silver mineralized zone, subject to receipt of permits. A bulk sample in combination with past drill results will further our geological understanding and unlock value of this high-grade mineralized system.”

Background on the Electrum property

The Electrum property is a 60:40 joint venture between Tudor Gold (as operator) and American Creek. It is located between the past-producing Silbak-Premier gold mine and British Columbia’s newest gold mine, Pretium’s Valley of the Kings — recently commissioned at a cost of $1-billion and hosting proven and probable reserves of 8.1 million ounces of gold (see Pretium’s website). Within this rich portion of B.C.’s Golden Triangle are several other past-producing mines as well as numerous new projects undergoing exploration.

About American Creek Resources Ltd.

American Creek holds a strong portfolio of gold and silver properties in British Columbia. The portfolio includes three Golden Triangle gold/silver properties: the Treaty Creek and Electrum joint ventures with Walter Storm/Tudor as well as the recently acquired 100-per-cent-owned past-producing Dunwell mine. Other properties held throughout B.C. include the Gold Hill, Austruck-Bonanza, Ample Goldmax, Silver Side and Glitter King.


American Creek $AMK.ca Reports High-Grade #Gold and #Silver on GR2/HC Zone – up to 4.89 G/T Gold for 9.7 M and 1,118 G/T Silver for 2.85 M – at Treaty Creek Project $SEA $SA $SKE.ca $TUD.ca $PVG

Posted by AGORACOM-JC at 9:58 AM on Monday, December 11th, 2017

Hublogolarge2 copy

  • Reports High-Grade Gold and Silver on GR2/HC Zone
  • Up to 4.89 G/T Gold for 9.7 M and 1,118 G/T Silver for 2.85 M
  • Treaty Creek Project is situated immediately north of Seabridge Gold’s KSM property and near Pretium’s Valley of the Kings Mine

American Creek Resources Ltd. (TSX.V: AMK) (the “Corporation”) is pleased to report on Tudor Gold’s (“Tudor”) final results for the 2017 exploration season from the GR2/HC Zone of the Treaty Creek Project. The Treaty Creek Project is situated immediately north of Seabridge Gold’s KSM property and near Pretium’s Valley of the Kings Mine, both of which are situated in BC’s Golden Triangle along the Sulphurets and Brucejack fault systems that continue northward into the Treaty Creek property.

The HC extension of the GR2 Zone was discovered during the 2017 exploration program and carries high-grade gold, silver and base metal mineralization. The HC drill program augmented the previous drill holes in the zone and consisted of 17 drill holes totaling 5,401 meters in 2017. The program was designed with a maximum of 50 metre step-outs in the mineralized zone to prepare for a preliminary resource estimate.

The GR2/HC zone appears to be a gold-rich VHMS deposit in which the feeder vein system and the stratabound lenses have been intersected. A later Ag-(Pb-Zn-Sb-Cu) vein system was also found reactivating some of the previous structures in the same area where the HC extension is located. These veins are late in the formation and are hosted in the volcaniclastic sequence or in the younger Jurassic Hazelton sequence, crosscutting (and reactivating) previous HC related feeder vein system and HC stratabound lenses. The RR Ag-base metal vein holes are collared 800m north of the HC zone, following the same structure.

Thirty-six drill holes have been drilled to date in the GR2/HC, covering an area approximately 400m along strike and 450m down dip at 50m space increments that show consistent geology and which demonstrate the distribution and continuity of the feeder vein system, the strata-bound zone, and the late silver-base metal vein system. Historical surface sampling carried out by previous operators to both the north and south of the GR2/HC zone indicates that the main mineralized structure potentially extends 3,000m along strike. The mineralized structure remains open to the north and south beyond the existing drill holes, and down dip.

Significant drill results are summarized in the tables below (all distance measurements reported in meters).

*True thickness of all above mineralized intervals still to be determined.
**AuEq calculated assuming Au USD$1,275/oz and Ag USD$16/oz.
Note that only precious metals were reported on.

Darren Blaney, CEO of American Creek stated: “The discovery of the new HC extension is a very welcome bonus to this year’s Treaty Creek drill program. The GR2/HC system appears to have potential to be very extensive, which would add significant value to the adjoining Copper Belle bulk tonnage gold zone, which was the main focus of this year’s drill program. A large polymetallic zone with high grade gold and silver would be a most welcome addition to the project.”

2017 drill results from the Copper Belle gold zone at Treaty Creek are still pending and will be reported on once received.

Background on the Treaty Creek Project

Tudor conducted a major drill program (approximately 20,000 metres) on the Treaty Creek property this summer with the objective of defining a gold resource on the Copper Belle zone.

The Treaty Creek Project is a joint venture between Tudor, Teuton Resources Corp., and American Creek. Tudor is the operator and holds a 60% interest with both American Creek and Teuton each holding respective 20% carried interests in the property (fully carried until a production notice is given).

A summary of the Treaty Creek Project can be viewed here:

http://www.americancreek.com/images/pdf/Treaty_Creek_Joint_Venture_Project.pdf

Electrum Project Road Completion

The Corporation also reports that Tudor Gold recently completed construction of an access road extension on the Electrum Project connecting the existing Granduc Haul Road to the New Blast/Shiny Cliff high grade gold and silver zones which are the focus of a planned 10,000 ton bulk sample.

In Tudor’s recent news release, Walter Storm, President and CEO stated, “We are very pleased to have completed this access road, which will now allow us to proceed with a 10,000 ton bulk sample of this high grade gold/silver mineralized zone, subject to receipt of permits. A bulk sample in combination with past drill results will further our geological understanding and unlock value of this high grade mineralized system.”

Background on the Electrum Property

The Electrum property is a 60:40 joint venture between Tudor Gold (as operator) and American Creek. It is located between the past producing Silbak-Premier gold mine and British Columbia’s newest gold mine, Pretium’s Valley of the Kings – recently commissioned at a cost of $1 Billion dollars and hosting proven and probable reserves of 8.1 million ounces of gold (see www.pretivm.com). Within this rich portion of BC’s Golden Triangle are several other past producing mines as well as numerous new projects undergoing exploration.

About American Creek

American Creek holds a strong portfolio of gold and silver properties in British Columbia. The portfolio includes three Golden Triangle gold/silver properties; the Treaty Creek and Electrum joint ventures with Walter Storm/Tudor as well as the recently acquired 100% owned past producing Dunwell Mine. Other properties held throughout BC include the Gold Hill, Austruck-Bonanza, Ample Goldmax, Silver Side, and Glitter King.

For further information please contact Kelvin Burton at: Phone: 403 752-4040 or Email: [email protected]. Information relating to the Corporation is available on its website at www.americancreek.com

Neither the TSX Venture Exchange nor its Regulation Services Provider (as that term is defined in the policies of the TSX Venture Exchange) accepts responsibility for the adequacy or accuracy of this release.

View source version on businesswire.com: http://www.businesswire.com/news/home/20171211005362/en/

American Creek Resources Ltd.
Kelvin Burton, 403-752-4040
[email protected]

FEATURE: American Creek $AMK.ca encounters high grade Au/Ag at Treaty Creek north of, and in the same system as #Seabridge Gold $SA $SEA.ca KSM project

Posted by AGORACOM-JC at 2:27 PM on Monday, December 4th, 2017

AMK: TSX-V, OTCBB: ACKRF

RECENT HIGHLIGHTS

  • Encountered numerous high grade gold/silver intercepts in preliminary drilling at the new HC zone at the Treaty Creek Project Read More
  • Additional gold discovery of 5.1m of 9.57 g/t gold from 249.35m to 254.45m Read More
  • Tudor Has Discovered a New Gold Zone at Treaty Creek: 110 M of 0.909 g/t Gold, Upper 316 M of Hole Yet to Be Assayed
  • Specimens from the Electrum property average 27,092 gm/tonne silver and 248 gm/tonne gold. Read More
  • Tudor has now completed the previously announced Magnetotelluric survey and has commenced drilling Read More
  • Hole CB-16-03 returned 0.526 g/t gold over 629.7 meters
  • Included within this wide 629.7 meter interval is 338 meters of 0.70 g/t gold
  • Also included 54 meters (from 88 to 142 meters) of 1.117 g/t gold and 122 meters of 0.965 g/t gold
  • Reports That JV Drill Program is Well on Its Way to Defining a Gold Resource

View Presentation

FEATURE: Explor Resources $EXS.ca Flagship Hosts NI 43-101 Resource – 609K Oz Indicated , 470K Oz Inferred $EXN.ca $HBE.ca $OSK.ca

Posted by AGORACOM-JC at 4:03 PM on Tuesday, November 28th, 2017

Why Explor Resources?

  • Flagship Property Offers The Following:
  • NI 43-101 Resource – 609,000 oz Indicated / 470,000 Inferred
  • Property Is 13 KM From Downtown Timmins
  • 2nd Project 43-101 Open Pit Resource
  • 1.4 MILLION T Indicated @ 1.38% Copper
  • 2.09 MILLION T Inferred @ 1.26% Copper

Explor $EXS.ca Increases Ogden Property $EXN.ca $HBE.ca $OSK.ca

Posted by AGORACOM-JC at 3:21 PM on Thursday, November 23rd, 2017

Exs logo

  • Announced the acquisition of seven (7) patented mining claims situated in the Ogden Township, in the Porcupine Mining Division, District of Cochrane, Province of Ontario for a total of 115.34 hectares

ROUYN-NORANDA, QUEBEC–(Nov. 23, 2017) – Explor Resources Inc. (“Explor” or “the Corporation”) (TSX VENTURE:EXS)(OTCQB:EXSFF)(FRANKFURT:E1H1)(BERLIN:E1H1) is pleased to announce the acquisition of seven (7) patented mining claims situated in the Ogden Township, in the Porcupine Mining Division, District of Cochrane, Province of Ontario for a total of 115.34 hectares. These claims are located in Ogden Township contiguous and to the east of the Timmins Porcupine West Gold Property. Highway 101 West is north of the property and provided excellent access to the city of Timmins. The claims were acquired because of encouraging results obtained in Explor’s past exploration on this property.

Explor Resources Inc. will pay CDN $45,000 and issue 2,000,000 common shares to acquire a 100% interest in the additional Ogden patented mining claims. The Optionors have retained a 2% NSR in the property. This acquisition is subject to the approval of the TSX Venture Exchange.

With this acquisition, the Ogden property now consists of 21 mining claims (115 mineral claim units) and 7 patented mining claims covering 1,958 hectares situated in the Porcupine mining division, district of Cochrane, in the Ogden and Price Townships, Ontario. The Ogden property has been previously explored by Hollinger Mines, Tex-Sol Exploration, Inmet Mining Corporation, Amax Mineral Exploration, Noranda Exploration and Knick Exploration. The majority of the holes drilled by previous operators were less than 100 meters in length. Historically on the Ogden Property, the only hole that hit significant mineralization was a diamond drill hole by Tex-Sol Exploration in 1965 which returned 6.0 g/t Au over 9.1 m at a shallow depth. On the TPW Gold Property significant mineralization was intersected below 300 meters of vertical depth requiring drill holes of 500 to 600 m in length.

The most significant deposits in Timmins are spatially associated with porphyry units that are in proximity to the Porcupine Destor Fault. The deposits appear to be also associated with splay faults that trend off and to the North of the Porcupine Destor fault inside an interpreted splay fault corridor.

Chris Dupont P.Eng is the qualified person responsible for the information contained in this release.

Explor Resources Inc. is a publicly listed company trading on the TSX Venture (EXS), on the OTCQB (EXSFF) and on the Frankfurt and Berlin Stock Exchanges (E1H1).

This Press Release was prepared by Explor. Neither the TSX Venture Exchange nor its Regulation Services Provider (as that term is defined in the Policies of the TSX Venture Exchange) has reviewed or accepts responsibility for the adequacy or accuracy of this release.

About Explor Resources Inc.

Explor Resources Inc. is a Canadian-based natural resources company with mineral holdings in Ontario, Québec, Saskatchewan and New Brunswick. Explor is currently focused on exploration in the Abitibi Greenstone Belt. The belt is found in both provinces of Ontario and Québec with approximately 33% in Ontario and 67% in Québec. The Belt has produced in excess of 180,000,000 ounces of gold and 450,000,000 tonnes of cu-zn ore over the last 100 years. The Corporation was continued under the laws of Alberta in 1986 and has had its main office in Québec since 2006.

Explor Resources Flagship project is the Timmins Porcupine West (TPW) Project located in the Porcupine mining camp, in the Province of Ontario. The TPW mineral resource (Press Release dated August 27, 2013) includes the following:

Open Pit Mineral Resources at a 0.30 g/t Au cut-off grade are as follows:           Indicated: 213,000 oz (4,283,000 tonnes at 1.55 g/t Au)   Inferred: 77,000 oz (1,140,000 tonnes at 2.09 g/t Au)       Underground Mineral Resources at a 1.70 g/t Au cut-off grade are as follows:           Indicated: 396,000 oz (4,420,000 tonnes at 2.79 g/t Au)   Inferred: 393,000 oz (5,185,000 tonnes at 2.36 g/t Au)This document may contain forward-looking statements relating to Explor’s operations or to the environment in which it operates. Such statements are based on operations, estimates, forecasts and projections. They are not guarantees of future performance and involve risks and uncertainties that are difficult to predict and may be beyond Explor’s control. A number of important factors could cause actual outcomes and results to differ materially from those expressed in forward-looking statements, including those set forth in other public filling. In addition, such statements relate to the date on which they are made. Consequently, undue reliance should not be placed on such forward-looking statements. Explor disclaims any intention or obligation to update or revise any forward-looking statements, whether as a result of new information, future events or otherwise, save and except as may be required by applicable securities laws.

Explor Resources Inc.
Christian Dupont
President
819-797-1870
888-997-4630 or 819-797-4630
[email protected]
www.explorresources.com

‘New normal’ of geopolitical risk likely to boost #gold prices in coming years, Citi $C forecasts $AMK.ca $EXS.ca $GGX.ca $GR.ca $MQR.ca

Posted by AGORACOM-JC at 12:09 PM on Monday, November 20th, 2017
  • The geopolitical case for gold investment has been emboldened in recent months and it seems as strong today than at any point over the last four decades, Citi analysts said
  • Investors tend to move into safe-haven assets such as gold, the Swiss franc and the Japanese yen in times of geopolitical turmoil
  • Elections and political votes, military attacks and macroeconomic crises were recognized by Citi as some of the key geopolitical events likely to influence investment into gold

Jeffrey Coolidge | Getty Images

Gold prices are likely to be buoyed by the “new normal” of elevated geopolitical tensions over the coming years, Citi analysts said Monday.

The geopolitical case for gold investment has been emboldened in recent months and it seems as strong today than at any point over the last four decades, Citi analysts said. As a result, gold prices were forecast to “push north of $1,400 per ounce for sustained periods” through to 2020.

Elections and political votes, military attacks and macroeconomic crises were recognized by Citi as some of the key geopolitical events likely to influence investment into gold. And while analysts said there was not a consistent pattern for gold price performance amid such times of global uncertainty, prices were seen to have rallied more frequently during these periods.

Investors tend to move into safe-haven assets such as gold, the Swiss franc and the Japanese yen in times of geopolitical turmoil as traditional assets such as stocks and bonds are often perceived as a more volatile investment.

‘Huge downside risk’

“Event-driven bids for gold seem to be occurring more frequently and may be the new normal… In short, even as the rates and forex channel dominate the outlook for gold pricing, the yellow metal is increasingly being used by investors as a policy and tail risk hedge,” Citi said.

Citi projected gold prices are on track to notch levels of $1,270 per ounce by the end of 2018, before climbing to around $1,350 per ounce and $1,370 per ounce over the next two calendar years.

“Philosophically everyone wants gold, it should always be safe but there is huge downside risk,” Nandini Ramakrishnan, global markets strategist at JPMorgan, told CNBC Monday.

Ramakrishnan said gold prices had witnessed “massive moves akin to the equity market,” before adding that investors should treat the commodity with caution.

Gold is highly sensitive to U.S. interest rate hikes, as such moves increase the opportunity cost of holding non-yielding bullion, while supporting the dollar — in which the commodity is priced.

Spot gold edged 0.2 percent lower to $1,290 per ounce on Monday morning. The yellow metal is up 12 percent since the start of the year.

Sam MeredithDigital Reporter, CNBC.com
Source: https://www.cnbc.com/2017/11/20/new-normal-of-geopolitical-risk-likely-to-boost-gold-prices-in-coming-years-citi-forecasts.html

#NSM.ca Northern Sphere Drills an Impressive 13.3 Grams Gold over 10.5 Metres $Wm.ca $FNI.ca

Posted by AGORACOM at 2:24 PM on Tuesday, November 14th, 2017


  • Northern Sphere received 1st set of assays for its initial drill program at Scadding in Sudbury
  • Hole 17-03 Intercepted 13.3 Grams Gold over 10.5 Metres in a Chlorite Breccia with visible gold
  • Hole 17-06 encountered approximately 100 metres of mineralized chlorite breccia, intersecting a significant fault structure at 158m, mineralized quartz veining along with apparent mineralized felsics.
  • Eric Sprott holds an Insider Position in the Company
  • Helmed by Legendary Financier Sheldon Inwentash, CPA, CA., LL.D. (Hon)


Link to Nov 8th Press Release