Posted by AGORACOM
at 10:55 AM on Thursday, March 12th, 2020
SPONSOR: American Creek owns a 20% Carried Interest to Production at the Treaty Creek Project in the Golden Triangle. 2019’s first hole averaged of 0.683 g/t Au over 780m in a vertical intercept. The Treaty Creek property is located in the same hydrothermal system as the Pretivm and Seabridge’s KSM deposits. Click Here For More Info
Tudor Gold said it had discovered a significant new copper-silver horizon within the Goldstorm system.
The newly discovered copper-rich CS 600 Horizon is a very important feature of the Goldstorm System.
Presence of copper and silver mineralization gives this discovery a true polymetallic nature yet it remains a gold-dominant project.
Tudor Gold Corp. [TUD-TSXV, TUC-Frankfurt] has released the results
of gold-equivalent calculations for all drilling completed at the
company’s Treaty Creek project, which is located in British Columbia’s
Golden Triangle region.
These calculations are posted on the company’s website and include
credit for previously analyzed values for copper and silver. Geological
analysis and reinterpretation of all the drill holes to date exposed a
new copper horizon (CS 600 horizon) as well as significant silver and
copper mineralization through the Goldstorm system, the company said in a
press release, which was issued just after the close of trading on
March 3, 2020.
On Wednesday, Tudor shares eased 4.0% or $0.02 to 48 cents on volume
of 309,585. The shares are currently trading in a 52-week range of 26
cents and $1.08.
Tudor Gold holds a 60% stake in the Treaty Creek joint venture and is
the project operator. The other partners are American Creek Resources
Ltd. [AMK-TSXV] and Teuton Resources Corp. [TUO-TSXV, TUC-Frankfurt],
each of which hold a 20% stake in the project. American Creek and Teuton
are both fully carried to a production notice. At that point, each of
the two is required to contribute their respective 20% share of
development costs.
Until that happens, Tudor is required to fund all exploration and
development costs. The property is also subject to 3% net smelter return
royalties.
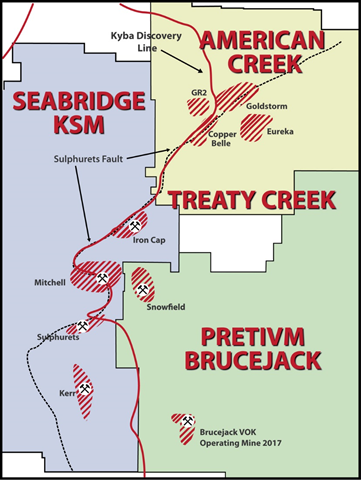
The 17,913-hectare Treaty Creek Project borders Seabridge Gold Inc.’s
[SEA-TSX, SA-NYSE] KSM property to the southwest and borders Pretium
Resources Inc.’s [PVG-TSX] Brucejack property to the southeast. The
past-producing Eskay Creek mine lies 12 kilometres to the west.
Exploration of the Treaty Creek area over the past 30 years by
various junior companies has resulted in the discovery of a number of
surface mineral showings, some with very high gold and silver values.
There have been over 150 diamond drill holes completed on the
property from 1987 to date, in eight different mineral zones. However,
it is only recently that drilling revealed the potential for a
large-scale porphyry-style gold deposit at the Copper Belle and
Goldstorm zones, which are located on trend and just five kilometres
northeast of the KSM deposits.
In a press release on December 16, 2019, Tudor Gold said it had
discovered a significant new copper-silver horizon within the Goldstorm
system.
The newly discovered copper-rich CS 600 Horizon is a very important
feature of the Goldstorm System, the company has said. It said presence
of copper and silver mineralization gives this discovery a true
polymetallic nature yet it remains a gold-dominant project.
“We are very encouraged to see that the silver copper mineralization
has made an important impact to the gold equivalent results from our
recent drilling as well as the historical drilling,’’ said Ken Konkin,
vice-president of project development at Tudor Gold.
“The next step is to plan the drill hole program for the 2020
exploration season,†he said. The company’s goal is to design a diamond
drill program that will fast-track the exploration program for 2020 with
the objective to begin mineral resource estimate work as soon as
possible.
Bay Street billionaire Eric Sprott recently increased his stake the company to 14.1% by investing in a non-brokered private placement of 4.2 million shares that raised $2.93 million. The shares are priced at 70 cents each.
About American Creek
American Creek holds a strong portfolio of gold and silver properties
in British Columbia. The portfolio includes three gold/silver
properties in the heart of the Golden Triangle; the Treaty Creek and
Electrum joint ventures with Walter Storm/Tudor, as well as the recently
acquired 100% owned past producing Dunwell Mine. Other properties held
throughout BC include the Gold Hill, Austruck-Bonanza, Ample Goldmax,
Silver Side, and Glitter King.
For further information please contact Kelvin Burton at: Phone: 403 752-4040 or Email: [email protected]. Information relating to the Company is available on its website at www.americancreek.com
Posted by AGORACOM
at 9:38 AM on Wednesday, March 4th, 2020
P&E Mining Consultants Inc. Provides Drill Hole Spacing Recommendation for the 2020 Drill Plan
Calculations include credit for previously analyzed values for Cu and Ag
Newly discovered NE Extension within the 300 Horizon. The gold-only result of 1.27 gpt Au over a 252 metre (m) interval increased to 1.51 gpt AuEq, an increase of 18.9%.
Cardston, Alberta–(Newsfile Corp. – March 4, 2020) – American Creek Resources Ltd. (TSXV: AMK) (the “Company”)
is pleased to announce the results of gold-equivalent (AuEq)
calculations for all drilling completed at JV partner Tudor Gold’s
(“Tudor”) flagship project Treaty Creek. These calculations include
credit for previously analyzed values for Cu and Ag. Geological analysis
and reinterpretation of all the drill holes to date exposed a new
copper horizon (CS 600 horizon) as well as significant silver and copper
mineralization throughout the Goldstorm system.
The strongest AuEq increase was seen in the newly discovered NE Extension within the 300 Horizon. The
gold-only result of 1.27 gpt Au over a 252 metre (m) interval increased
to 1.51 gpt AuEq (with 13.8 gpt Ag and 504 ppm Cu), an increase of
18.9%.
All drill holes at Goldstorm Zone had
significant increases to the composite results when the AuEq values for
the copper and silver mineralization were included however when the
drill holes intersected the CS-600 Horizon, the copper values within
this mineralized body had the greatest impact to an individual horizon
with up to 79.8% increase to the AuEq value from a gold-only 0.39 gpt Au over 150m to 0.70 gpt AuEq over the same 150m interval.
P&E Mining Consultants Inc. were
retained to assess all Goldstorm drill hole results and historical data
in order to render an opinion as to the consistency of the gold
mineralization as well to ascertain the recommended drill hole spacing
that would be required to potentially derive an Indicated Mineral
Resource and a Measured Mineral Resource. P&E Mining Consultants
Inc. concluded the following:
“Three dimensional continuity analyses
of the Treaty Creek drill hole assay results were carried out for the
Goldstorm Zone. The regional geological trend was used to guide the
selection of horizontal, across-strike, and dip-plane directions during
variogram fan analysis. Variogram fans were generated separately for Ag,
Au, Cu, Pb, and Zn uncapped composite samples in each zone.
All modeled semi-variograms display a
very low nugget effect, and display long range continuity down the
plunge of the mineralization and along the regional strike of the
deposits.
For the Goldstorm Zone, a drill spacing
of 200 m is recommended for Indicated Mineral Resources, and 100 m for
Measured Mineral Resources.”
Tudor’s goal is to design a diamond drill
hole program that will fast-track the exploration program for 2020 with
the objective to begin the Mineral Resource Estimate work as soon as
possible.
Vice President of Project Development Ken Konkin P.Geo. comments:
“We are very encouraged to see that the silver and copper
mineralization has made an important impact to the AuEq results from our
recent drilling as well as the historical drilling. The next step is to
plan the drill hole program for the 2020 exploration season. We
continue to work with our Mineral Resource Estimate geologists and
engineers from P&E Mining Consultants to plan the drill hole program
in order to optimize the drilling and to attempt to fast-track the
exploration program for this coming drill season
Table l provides gold equivalent composites from the 2019 drilling
and all historical drilling within the Goldstorm Zone. Table ll contains
the drill data including collar location, depth of drill holes as well
as the dip and azimuth for all drill hole.
TABLE l: Au Eq COMPOSITES GOLDSTORM ZONE
Section
HOLE ID
From
To
Interval (m)
AuEq g/t
Au g/t
Ag g/t
Cu ppm
% increase
Horizon
107+00 NE
CB-17-29
1.20
575.00
573.80
0.321
0.278
0.9
224
15.5%
300
107+00 NE
CB-17-29
60.50
333.50
273.00
0.435
0.392
1.1
197
11.0%
300
107+00 NE
CB-17-29
60.50
176.00
115.50
0.728
0.685
1.9
142
6.3%
300
107+00 NE
CB-18-32
196.50
783.50
587.00
0.542
0.497
1.6
177
9.1%
300 + CS600
107+00 NE
CB-18-32
196.50
316.50
120.00
1.082
1.045
1.7
106
3.5%
300
107+00 NE
CB-18-34
419.00
711.50
292.50
0.499
0.461
2.4
63
8.2%
300
107+00 NE
CB-18-34
831.50
897.50
66.00
0.290
0.221
1.3
361
31.2%
CS600
108+00 NE
CB-17-09
41.00
545.00
504.00
0.549
0.488
2.3
225
12.5%
300
108+00 NE
CB-17-09
41.00
200.00
159.00
0.782
0.708
2.9
261
10.5%
300
108+00 NE
CB-17-12
3.00
243.50
240.50
0.848
0.797
2.6
139
6.4%
300
108+00 NE
CB-17-12
33.00
224.00
191.00
0.979
0.923
3.0
134
6.1%
300
108+00 NE
CB-17-24
3.50
563.00
559.50
0.618
0.576
2.0
121
7.3%
300
108+00 NE
CB-17-24
62.00
275.00
213.00
1.018
0.945
3.9
180
7.7%
300
108+00 NE
CB-17-24
3.50
686.00
682.50
0.563
0.498
1.8
288
13.1%
300
108+00 NE
CB-18-36
659.50
772.00
112.50
0.487
0.454
1.8
74
7.3%
300
108+00 NE
CB-18-36
659.50
704.50
45.00
0.733
0.688
2.7
88
6.5%
300
108+00 NE
CB-18-36
682.00
703.00
21.00
1.101
1.035
4.6
79
6.4%
300
108+00 NE
CB-18-38
20.50
638.00
617.50
0.465
0.429
1.3
137
8.4%
300
108+00 NE
CB-18-38
248.50
353.00
104.50
0.733
0.639
3.4
360
14.7%
300
108+00 NE
CB-18-38
468.50
638.00
169.50
0.683
0.659
1.1
76
3.6%
300
108+00 NE
GS-19-40
23.00
350.00
327.00
0.501
0.443
1.72
251
13.1%
300
108+00 NE
GS-19-40
81.50
127.00
45.50
1.060
0.907
4.92
634
16.9%
300
108+00 NE
GS-19-41
27.50
353.00
325.50
0.724
0.589
5.25
480
22.9%
300
108+00 NE
GS-19-41
47.00
146.00
99.00
1.252
1.015
9.83
800
23.3%
300
109+00 NE
CB-16-03
88.00
708.00
620.00
0.582
0.534
1.5
202
9.0%
300
109+00 NE
CB-16-03
112.00
426.00
314.00
0.792
0.733
2.2
220
8.0%
300
109+00 NE
CB-17-04
152.10
327.00
174.90
0.827
0.803
1.0
76
3.0%
300
109+00 NE
CB-17-27
12.50
536.00
523.50
0.688
0.640
1.6
197
7.5%
300
109+00 NE
CB-17-27
12.50
350.00
337.50
0.807
0.758
2.0
169
6.5%
300
109+00 NE
CB-18-31
404.00
680.50
276.50
0.526
0.494
1.4
100
6.5%
300
109+00 NE
CB-18-31
481.00
597.00
116.00
0.773
0.732
1.8
124
5.6%
300
109+00 NE
CB-18-33B
599.00
623.00
24.00
0.435
0.367
5.4
22
18.5%
300
109+00 NE
GS-19-43
68.00
561.50
493.50
0.608
0.566
1.36
174
7.4%
300 + CS600
109+00 NE
GS-19-43
141.50
197.00
55.50
1.068
1.005
2.62
211
6.3%
300
109+00 NE
GS-19-43
405.50
561.50
156.00
0.785
0.718
1.50
325
9.3%
CS600
109+00 NE
GS-19-44
101.00
368.00
267.00
0.867
0.807
3.30
134
7.4%
300
109+00 NE
GS-19-44
125.00
275.00
150.00
1.143
1.065
4.62
151
7.3%
300
109+00 NE
GS-19-45
44.00
369.50
325.50
0.765
0.719
1.91
154
6.4%
300
109+00 NE
GS-19-45
62.00
278.00
216.00
0.947
0.901
2.27
122
5.1%
300
109+00 NE
GS-19-45
105.00
278.00
173.00
1.054
1.000
2.63
144
5.4%
300
109+00 NE
GS-19-46
34.50
628.50
594.00
0.550
0.510
1.31
165
7.8%
300 + CS600
109+00 NE
GS-19-46
175.50
337.50
162.00
0.778
0.734
1.93
135
6.0%
300
109+00 NE
GS-19-46
564.00
600.00
36.00
1.425
1.328
1.12
560
7.3%
CS600
110+00 NE
CB-17-06
182.50
589.50
407.00
0.767
0.675
3.1
369
13.6%
300
110+00 NE
CB-17-06
222.00
393.50
171.50
0.914
0.814
3.7
379
12.3%
300
110+00 NE
CB-17-07
99.50
530.00
430.50
0.697
0.625
2.4
293
11.5%
300
110+00 NE
CB-17-07
162.50
309.50
147.00
1.155
1.028
4.9
457
12.4%
300
110+00 NE
CB-18-37B
125.00
819.50
694.50
0.502
0.459
1.2
196
9.4%
300
110+00 NE
CB-18-37B
300.50
423.50
123.00
1.002
0.944
2.0
234
6.1%
300
110+00 NE
CB-18-37B
125.00
912.00
787.00
0.473
0.427
1.2
212
10.8%
300 + CS600
110+00 NE
GS-19-50
148.00
725.50
577.50
0.681
0.602
1.99
372
13.1%
300 + CS600
110+00 NE
GS-19-50
160.00
427.00
267.00
0.878
0.811
2.67
300
8.3%
300
110+00 NE
GS-19-50
652.00
736.00
84.00
0.816
0.571
2.53
1444
42.9%
CS600
110+00 NE
GS-19-51
119.00
365.00
246.00
0.777
0.722
2.31
187
7.6%
300
110+00 NE
GS-19-51
578.00
618.50
40.50
1.304
1.019
2.94
1693
28.0%
CS600
110+00 NE
GS-19-53
108.00
255.00
147.00
1.036
0.984
3.07
98
5.3%
300
111+00 NE
CB-18-39
141.50
705.30
563.80
1.086
0.981
4.4
352
10.7%
300
111+00 NE
CB-18-39
141.50
422.00
280.50
1.274
1.141
5.5
449
11.7%
300
111+00 NE
CB-18-39
539.00
695.00
156.00
1.247
1.154
4.6
257
8.1%
300
111+00 NE
GS-19-48
97.50
1024.50
927.00
0.793
0.677
3.00
543
17.1%
300 + CS600
111+00 NE
GS-19-48
97.50
426.00
328.50
1.152
1.048
4.30
354
9.9%
300
111+00 NE
GS-19-48
871.50
940.50
69.00
1.483
0.937
3.90
3364
58.3%
CS600
111+00 NE
GS-19-49
81.00
907.50
826.50
0.800
0.696
3.40
429
14.9%
300 + CS600
111+00 NE
GS-19-49
81.00
330.00
249.00
1.080
0.998
5.10
137
8.2%
300
111+00 NE
GS-19-49
483.00
606.00
123.00
1.042
0.941
1.80
538
10.7%
300
111+00 NE
GS-19-49
747.00
832.50
85.50
1.494
1.067
10.50
2035
40.0%
CS600
111+00 NE
GS-19-52
62.00
663.50
601.50
0.783
0.668
3.25
513
17.2%
300 + CS600
111+00 NE
GS-19-52
62.00
398.00
336.00
1.062
1.004
2.65
182
5.8%
300
111+00 NE
GS-19-52
513.50
663.50
150.00
0.703
0.391
6.49
1583
79.8%
CS600
112+50 NE
GS-19-42
63.50
843.50
780.00
0.849
0.683
5.80
650
24.3%
300 + CS600
112+50 NE
GS-19-42
63.50
434.00
370.50
1.275
1.097
10.00
393
16.2%
300
112+50 NE
GS-19-42
63.50
315.50
252.00
1.508
1.268
13.80
504
18.9%
300
112+50 NE
GS-19-42
717.70
843.50
125.80
0.902
0.522
3.80
2253
72.8%
CS600
114+00 NE
GS-19-47
117.50
1199.00
1081.50
0.697
0.589
3.40
450
18.3%
300 + CS600 + DS
114+00 NE
GS-19-47
200.00
501.50
301.50
0.867
0.828
2.10
96
4.7%
300
114+00 NE
GS-19-47
665.00
816.50
151.50
1.009
0.572
8.90
2228
76.4%
CS600
114+00 NE
GS-19-47
933.50
1176.50
243.00
0.996
0.908
4.80
207
9.7%
DS
* All assay grades are uncut and intervals reflect drilled intercept
lengths. True widths have not been determined as the mineralized body
remains open in all directions. Further drilling is required to
determine the mineralized body orientation and true widths.
HQ and NQ2 diameter core samples were sawn in half and typically sampled at standard 1.5m intervals.
**Metal prices used to calculate the AuEq metal content are: Gold
$1322/oz, Ag: $15.91/oz, Cu: $2.86/lb. All metals are reported in USD
and calculations do not consider metal recoveries
The goal is to design a diamond drill hole program for the 2020
exploration program with the objective to begin the Mineral Resource
Estimate work at the end of the 2020 field season. Tudor hopes to
accomplish as much drilling needed to bring a Measured and Indicated
Mineral Resource Estimate forward as quickly as possible.
Walter Storm, President and CEO, stated: “These
new gold equivalents are extremely encouraging as our technical team
continues to take positive steps advancing Tudor Gold’s flagship Treaty
Creek Au-Ag-Cu project. Furthermore we received good news from P&E
Mining Consultants Inc. that the drill hole spacing required to derive a
Measured Resource is 100 meters due to the homogenous nature of the
AuEq composites obtained to-date. During the new few weeks, our
geologist and engineers will continue to work with the geological model
and begin to prepare the diamond drill hole proposal for 2020.”
The Treaty Creek Project is a Joint Venture with Tudor Gold owning
3/5th and acting as operator. American Creek and Teuton Resources each
have a 1/5th interest in the project. American Creek and Teuton are both
fully carried until such time as a Production Notice is issued, at
which time they are required to contribute their respective 20% share of
development costs. Until such time, Tudor is required to fund all
exploration and development costs while both American Creek and Teuton
have “free rides”.
QA/QC
Drill core samples were prepared at MSA Labs’ Preparation Laboratory
in Terrace, BC and assayed at MSA Labs’ Geochemical Laboratory in
Langley, BC. Analytical accuracy and precision are monitored by the
submission of blanks, certified standards and duplicate samples inserted
at regular intervals into the sample stream by Tudor Gold personnel.
MSA Laboratories quality system complies with the requirements for the
International Standards ISO 17025 and ISO 9001. MSA Labs is independent
of the Company.
Qualified Person
The Qualified Person for this news release for the purposes of
National Instrument 43-101 is the Company’s Vice President of Project
Development, Ken Konkin, P.Geo. He has read and approved the scientific
and technical information that forms the basis for the disclosure
contained in this news release.
About American Creek
American Creek holds a strong portfolio of gold and silver properties
in British Columbia. The portfolio includes three gold/silver
properties in the heart of the Golden Triangle; the Treaty Creek and
Electrum joint ventures with Walter Storm/Tudor, as well as the recently
acquired 100% owned past producing Dunwell Mine. Other properties held
throughout BC include the Gold Hill, Austruck-Bonanza, Ample Goldmax,
Silver Side, and Glitter King.
For further information please contact Kelvin Burton at: Phone: 403 752-4040 or Email: [email protected]. Information relating to the Company is available on its website at www.americancreek.com
Posted by AGORACOM
at 9:21 AM on Thursday, February 27th, 2020
Cardston, Alberta–(February 27, 2020) – American Creek Resources
Ltd. (TSXV: AMK) (“the Corporation”) is pleased to report the assays
from phase 1 drilling from the 2019 fall drill program that was
conducted at the company’s 100% owned Dunwell Mine property located in
the Golden Triangle of British Columbia.
The Dunwell Mine is a high-grade past producing polymetallic mine
located just 8km by road from the shipping town of Stewart. This
property boasts exceptional logistics and a rich mining history with
significant potential for future development. A significant geological
feature running through the property is the Portland Canal Fissure Zone.
With the recent acquisition of the Glacier Creek claims American Creek
now controls 5km of the 6.5km Portland Canal Fissure Zone which contains
numerous high-grade polymetallic mineral occurrences including two past
producing mines (the Dunwell and Portland Canal). Very little modern
exploration has been done on the property. While there is huge potential
exploring along the extended reaches of the fissure zone, the initial
drill program was designed to test areas near the workings of the
Dunwell mine itself.
The initial objective for the drill program was to test the down dip
extension of the Dunwell main vein below sub-level 4. The second
objective was to test geophysical anomalies from an Induced Polarization
(IP) survey conducted later in the fall of 2019. Both of these
objectives were successfully accomplished with this drill program.
A total of 20 holes totaling 3,245.9m were completed on the property.
The first 14 holes were based on geological and historical data and
were successful in encountering veins of high-grade polymetallic
mineralization including 20.3 g/t AuEq over 2.7m, 18.4 g/t AuEq over 1.5m, 28.6 g/t AuEq over 0.5m and 24.4 g/t AuEq over 0.5m.
Holes DW19-04 to DW19-08 were drilled to test the down dip of the Dunwell zone below sub-level 4.
Results show high-grade hits, including 13.2 g/t AuEq,
in this series of holes that traversed from the east southeast to the
east. The holes consistently hit two zones, both at the base of dikes at
22 – 26 meters and 83 – 87 meters. These two zones, seen in the five
holes, run sub-parallel to the fault the drill pad was located on and
trend for some distance to the north.
Hole DW19-09 was drilled to test the north extension of the main zone
below level 4. The first breccia below the dike shows up in this hole
with a 28.5 g/t AuEq assay and the second with a 18.4 g/t AuEq assay.
HOLE
FROM (m)
TO (m)
INTERVAL (m)
AU g/t
AG g/t
CU %
PB %
ZN %
AuEq g/t
DW19-09
27.60
28.05
0.45
13.870
258.0
0.438
15.530
11.040
28.509
DW19-09
143.02
144.52
1.50
7.898
84.9
0.359
0.791
20.250
18.440
Hole DW19-10 was drilled to test below sub-level 4 but further to the southeast from hole DW19-04.
HOLE
FROM (m)
TO (m)
INTERVAL (m)
AU g/t
AG g/t
CU %
PB %
ZN %
AuEq g/t
DW19-10
29.00
29.57
0.57
2.785
42.5
0.055
0.713
3.020
4.956
DW19-10
88.71
89.61
0.90
3.535
43.2
0.060
1.480
2.860
5.959
DW19-10
99.13
99.79
0.66
1.707
33.7
0.031
0.285
0.529
2.491
The two breccias below the dikes, seen in holes 7 and 8 are present.
Holes 11 to 13 were drilled to follow up on the results from hole 9.
The holes were drilled in a fan where holes 11 and 12 were drilled at a
steeper angle to test below hole 9 and hole 13 was drilled at a flatter
angle to test above hole 9. Hole 14 was drilled at a 5° rotation to the
north of hole 9 to test the width of the structure.
HOLE
FROM (m)
TO (m)
INTERVAL (m)
AU g/t
AG g/t
CU %
PB %
ZN %
AuEq g/t
DW19-11
26.82
27.82
1.00
5.601
66.0
0.213
1.700
7.850
10.729
DW19-11
95.63
96.27
0.64
4.408
34.5
0.026
0.363
0.757
5.326
DW19-11
138.45
138.95
0.50
4.026
66.0
0.166
1.070
6.220
8.139
DW19-11
142.24
144.93
2.69
11.346
142.5
0.220
3.197
13.069
20.269
DW19-12
22.17
23.47
1.30
2.851
60.8
0.147
1.844
4.946
6.638
DW19-12
27.05
27.81
0.76
1.562
30.4
0.104
0.647
2.660
3.461
DW19-12
97.49
99.15
1.66
1.546
54.4
0.041
1.060
5.356
4.998
DW19-13
27.55
28.15
0.60
8.110
113.0
0.171
4.630
8.270
15.116
DW19-13
142.87
143.57
0.70
4.486
66.6
0.068
0.710
1.009
6.087
DW19-14
27.43
28.23
0.80
8.924
161.0
0.309
5.120
6.800
16.222
DW19-14
98.32
99.86
1.54
7.692
32.8
0.009
0.207
0.111
8.227
DW19-14
142.75
144.70
1.95
3.720
43.2
0.103
0.755
9.240
8.673
DW19-14
146.88
147.38
0.50
9.403
264.0
0.528
5.210
20.900
24.347
All the holes intersected the breccia below the dike at about 27
meters. Holes 11, 13 and 14 appear to intersect a similar structure to
that seen in hole 9. Multiple high-grade intercepts assayed as high as 24.3 g/t AuEq, 20.3 g/t AuEq, 16.3 AuEq, and 15.1 g/t AuEq while the remaining intercepts were still strong.
No modern exploration techniques or technologies have been used on
the Dunwell until a cutting edge Induced Polarization (IP) survey took
place in late fall of 2019. Only two of the dozens of geophysical
anomalies identified in the survey in close proximity to the Dunwell
Mine were drill tested in this first phase of drilling.
The last 6 holes (DW19-15 to DW19-19) were drilled to test the extent
of a large IP anomaly and were successful in encountering veins of
high-grade polymetallic mineralization including 19.4 g/t AuEq over 3.6m, 38.1 g/t AuEq over 0.5m and 28.4 AuEq over 0.4m with the remaining intercepts also containing significant mineralization.
Hole 15 was drilled south into the anomaly and Hole 16 was drilled
west into the anomaly with both intersecting a massive sulphide zone.
Holes 17 – 19 were drilled in a fan to follow up hole 16. Hole 18 also
hit a massive sulphide zone.
HOLE
FROM (m)
TO (m)
INTERVAL (m)
AU g/t
AG g/t
CU %
PB %
ZN %
AuEq g/t
DW19-15
100.90
102.08
1.18
8.445
869.0
0.034
0.186
1.265
19.536
DW19-15
152.09
152.59
0.50
32.230
472.0
0.008
0.134
0.372
38.119
DW19-16
45.11
45.81
0.70
11.260
144.0
0.208
6.550
6.010
18.471
DW19-16
75.07
78.68
3.61
8.850
88.8
0.221
1.768
19.514
19.354
DW19-17
no significant results
DW19-18
38.79
39.22
0.43
15.300
185.0
2.874
2.870
14.470
28.243
DW19-19
34.87
36.04
1.17
3.332
27.9
0.048
0.986
2.580
5.239
DW19-19
75.71
77.13
1.42
5.255
225.9
0.159
9.298
3.315
13.328
Hole 16 hit a massive sulphide interval at 75 – 78 meters. Hole 20
was drilled to test an IP anomaly along the access road below the second
drill pad. One small breccia was intercepted.
HOLE
FROM (m)
TO (m)
INTERVAL (m)
AU g/t
AG g/t
CU %
PB %
ZN %
AuEq g/t
DW19-20
121.01
121.45
0.44
1.669
27.5
0.007
0.034
0.082
2.056
CEO and President, Darren Blaney stated: “Our very
first drill program has intersected a significant number of high-grade
veins in the vicinity of the mine workings confirming our belief in the
potential of this project.
The Dunwell is an incredibly prospective property located in the
heart of the Golden Triangle. It has everything going for it from
amazing logistics to past high-grade production, with all indications
being that there is substantive additional ore yet to be mined.
With the recent acquisition of the Glacier Creek Crown Grants we now
cover 5km of the heavily mineralized Portland Canal Fissure Zone which
runs for 6.5km and is associated with over a dozen high-grade gold and
silver showings including two past producing mines. The potential of the
property extends far beyond the old workings of the Dunwell Mine.
Future exploration will be using the latest technologies to aid us in
unlocking that potential.”
Through a series of strategic acquisitions American Creek was able to
purchase the past-producing Dunwell Mine as well as several adjoining
very prospective properties, combining them into one large land package
that encompasses the best gold and silver mineral occurrences and
historic workings in the Bear River valley. The amalgamated property
spans 2,222 hectares covering the majority of the Portland Canal Fissure
Zone, an area first prospected in the late 1800’s and hosting some of
the earliest producing gold and silver mines in the Stewart area.
The Dunwell project is located 8km northeast of Stewart and is road
accessible with the Dunwell Mine adit itself located only 2km from
Highway 37A and a major power line. Stewart hosts a deep sea port
including ore loading and shipping facilities. Unlike the majority of
mineral properties located near Stewart, the Dunwell is located in low
mountainous terrain (700 m and lower elevation) with moderate relief.
These features allow for year-round work which typically isn’t the case
for exploration programs conducted in the Stewart region where projects
are typically at higher altitude, are accessible only by helicopter, and
lack critical infrastructure such as roads and power. The Dunwell
project may just have the best logistics of any project in the Golden
Triangle.
The Dunwell Mine is the most significant mineral occurrence within
the Portland Canal Fissure Zone. Production at the Dunwell occurred
between 1926 and 1937. From historic reports, it appears that a total of
45,657 tonnes averaging 6.63 g/t gold, 223.91 g/t silver, 1.83% lead,
2.43% zinc and 0.056% copper were produced.
In addition to the Dunwell mine itself, the property package also
contains over a dozen other high-grade gold and silver occurrences and
historic small-scale gold/silver high-grading operations along a
north/south trend that correlates to the fissure zone and major
faulting. Some examples of the nine areas that actually produced ore
are:
Ben Ali: 4,500 tons at 21.6 g/t gold
Lakeview 60 tons at 4.7 g/t gold, 2,734 g/t silver, and 11.5% lead
Victoria 11 tons at 20.15 g/t gold, 775 g/t silver, 25% lead
Tyee 8.2 tons at 124.4 g/t gold and 4,478.8 g/t silver
George E 12 tons at 13 g/t gold and 3,250 g/t silver, 23.3% lead
Each of these areas were producing during the 1930’s when exploration
techniques and technology was very primitive. American Creek has
already started to use the latest in exploration technology on the
property and will continue to do so to unlock the great potential that
exists here.
The Qualified Person for the Dunwell results in this new release is
James A. McCrea, P. Geo., for the purposes of National Instrument
43-101. He has read and approved the scientific and technical
information that forms the basis for the disclosure contained in this
news release.
About American Creek
American Creek holds a strong portfolio of gold and silver properties
in British Columbia. The portfolio includes three Golden Triangle
gold/silver properties; the Treaty Creek and Electrum joint ventures
with Walter Storm/Tudor as well as the 100% owned past-producing Dunwell
Mine. Other properties held throughout BC include the Gold Hill,
Austruck-Bonanza, Ample Goldmax, Silver Side, and Glitter King.
For further information please contact Kelvin Burton at: Phone: 403 752-4040 or Email: [email protected]. Information relating to the Corporation is available on its website at www.americancreek.com
Posted by AGORACOM
at 1:13 PM on Wednesday, February 26th, 2020
SPONSOR: American Creek owns a 20% Carried Interest to Production at the Treaty Creek Project in the Golden Triangle. 2019’s first hole averaged of 0.683 g/t Au over 780m in a vertical intercept. The Treaty Creek property is located in the same hydrothermal system as the Pretivm and Seabridge’s KSM deposits. Click Here For More Info
Exchange-traded fund holdings expand for 25 days to most ever
Moody’s Analytics says recession possible if pandemic occurs
Global investors are stashing more and more assets into gold as the
coronavirus outbreak spreads and appetite for risk takes a hit.
The global tally of bullion in exchange-traded funds swelled by the
most in more than a month on Tuesday as equities sank. That was the 25th
consecutive day of inflows, a record. At 2,624.7 tons, the holdings are
the largest ever.
After surging 18% last year, gold has extended its rally in 2020,
with prices hitting the highest since 2013. The haven has been favored
as the virus outbreak has spread beyond China, threatening a pandemic
and slower growth.
Goldman Sachs Group Inc. has said that should the disruption from the disease stretch into the second quarter, prices may rally toward $1,850 an ounce. Spot bullion was last at $1,644.67, up 0.6%. It touched $1,689.31 on Monday.
A global recession
is likely if the coronavirus becomes a pandemic, according to Moody’s
Analytics Chief Economist Mark Zandi. The odds of that outcome now stand
at 40%, up from 20%, he said in a note.
The threat of a prolonged downturn in growth due to the impact of the virus may keep gold elevated, according to Morgan Stanley. Further ETF inflows are likely as long as real interest rates remain negative, it said in a note.
Posted by AGORACOM
at 2:03 PM on Thursday, February 6th, 2020
American Creek Resources Ltd. (TSXV: AMK) is positioned to take full
advantage of the precious metals bull run that many experts believe we
are only in the early stages of.
Image of the Goldstorm Zone found along the base of this hill at Treaty Creek.
With approximately one billion tonnes of gold enriched rock identified (potential for a resource calculation in 2020), the Goldstorm has potential to become a world class gold deposit.
The 2020 drilling is designed to significantly expand the deposit as the system is open to the north, the east and at depth.
The company raised over $3.3 million to strengthen existing
alliances and create a number of new strategic relationships, bringing
strength, credibility and future increased exposure.
Eric Sprott made two separate investments of $1,000,000 into
American Creek. Mr. Sprott is the largest external investor in Treaty
Creek. He recently stated that he is “very excited about the opportunity there as the project has a great shot at having 20 million ounces.”
If you have not yet read the 2019 REPORT ON TREATY CREEK (potential world-class deposit in B.C.’s GOLDEN TRIANGE) click on the image for the fullreport.
The Treaty Creek Project is a joint venture with Tudor Gold owning
3/5th and acting as project operator. American Creek and Teuton
Resources each have a 1/5th interest in the project. American Creek and
Teuton are both fully carried until such time as a Production Notice is
issued, at which time they are required to contribute their respective
20% share of development costs. Until such time, Tudor is required to
fund all exploration and development costs while both American Creek and
Teuton have “free rides”.
About American Creek
American Creek is a Canadian mineral exploration company with a
strong portfolio of gold and silver properties in British Columbia.
Three of those properties are located in the prolific “Golden Triangle”;
the Treaty Creek and Electrum joint venture projects with Tudor
Gold/Walter Storm as well as the 100% owned past producing Dunwell Mine.
The Corporation also holds the Gold Hill, Austruck-Bonanza, Ample
Goldmax, Silver Side, and Glitter King properties located in other
prospective areas of the province.
For further information please contact Kelvin Burton at: Phone: 403 752-4040 or Email: [email protected]. Information relating to the Corporation is available on its website at www.americancreek.com
Posted by AGORACOM
at 2:10 PM on Monday, February 3rd, 2020
SPONSOR: American Creek owns a 20% Carried Interest to Production at the Treaty Creek Project in the Golden Triangle. 2019’s first hole averaged of 0.683 g/t Au over 780m in a vertical intercept. The Treaty Creek property is located in the same hydrothermal system as the Pretivm and Seabridge’s KSM deposits. Click Here For More Info
Gold is reporting its biggest monthly gain since August 2019.
January’s price rise has confirmed a resumption of the rally from lows seen in May 2019.
Safe haven flows and dovish Fed expectations could continue to push the yellow metal higher.
Gold has printed its biggest monthly gain in five months,
signaling a resumption of the rally from lows near $1,266 seen in May
2019.
The yellow metal is currently trading at a 4.00% gain from the
opening price of $1,517.70 observed on Jan. 2. That is the biggest
monthly price rise since August 2019. Back then, gold had rallied by
7.65%.
Haven flows
The US-Iran tensions escalated on Jan. 3, putting a strong
haven bid under gold. The yellow metal rose from $1,550 to a six-year
high of $1,611 in the five days to Jan. 8.
The break above $1,600 seen during the Asian trading hours on
Jan. 8 was short-lived, as tensions quickly eased after media outlets reported zero US casualties in Iran’s retaliatory attack on US bases in Iraq.
Gold fell back sharply to $1,550 on the same day and extended
losses to $1,536 by Jan. 14, before regaining poise on coronavirus
scare.
The mysterious Wuhan coronavirus spread quickly within China
during the second half of the month. Cases were also registered in Japan
and other Asian currencies and in the US and Europe. As a result, fear
gripped markets that China is struggling to contain the virus and it
could turn into a pandemic, derailing the global growth story.
Risk assets, therefore, took a beating and safe havens like gold, US treasuries, and yen found love.
Additionally, markets ramped up expectations for a Federal
Reserve rate cut by December and the central bank reinforced the dovish
expectations by reiterating its commitment to high inflation.
As a result, gold moved higher to $1,589 earlier Friday and is about to end the week with nearly 1 percent gain.
Looking forward, the coronavirus fears and the dovish Fed expectations could continue to push the yellow metal higher.
Many observers have revised lower their forecast for China’s first-quarter GDP
growth. For instance, Citigroup on Friday said it expects China’s GDP
growth to slow to 4.8% this quarter from 6.0% in the fourth quarter. It
cut its full-year forecast for 2020 to 5.5% from 5.8, according to
Bloomberg.
Further, analysts think the slowdown will force the Chinese
government and the People’s Bank of China to take action. Yields on
government bonds and currency usually drop with monetary easing, making the zero-yielding yellow metal look attractive.
As for next week, the focus will be on Caixin PMIs for China
and key US data releases – ISM Manufacturing and Non-Manufacturing data,
ADP report and the monthly Nonfarm Payrolls report.
Fed
rate cut expectations would strengthen, possibly yielding a stronger
rally in gold if the payrolls and wage growth figures disappoint
expectations.
Technical outlook
The metal traded in a sideways manner for four months, starting
from September to December. The range play has ended with a bullish
breakout with January’s 4% gain.
The range breakout indicates the rally from the low of $1,266 seen in May 2019 has resumed.
The next major resistance as per the monthly chart is $1,733. That level marks the 78.6% Fibonacci retracement of the sell-off from $1,920.94 to $1,046.54.
The daily chart is also biased bullish. Notably, the RSI is again looking north, having established support at 62.00.
The odds appear stacked in favor of a re-test of the high of $1,611 registered on Jan. 8.
The outlook would turn bearish if and when the daily chart RSI violates the support at 62.
Posted by AGORACOM
at 2:07 PM on Tuesday, January 28th, 2020
SPONSOR: American Creek owns a 20% Carried Interest to Production at the Treaty Creek Project in the Golden Triangle. 2019’s first hole averaged of 0.683 g/t Au over 780m in a vertical intercept. The Treaty Creek property is located in the same hydrothermal system as the Pretivm and Seabridge’s KSM deposits. Click Here For More Info
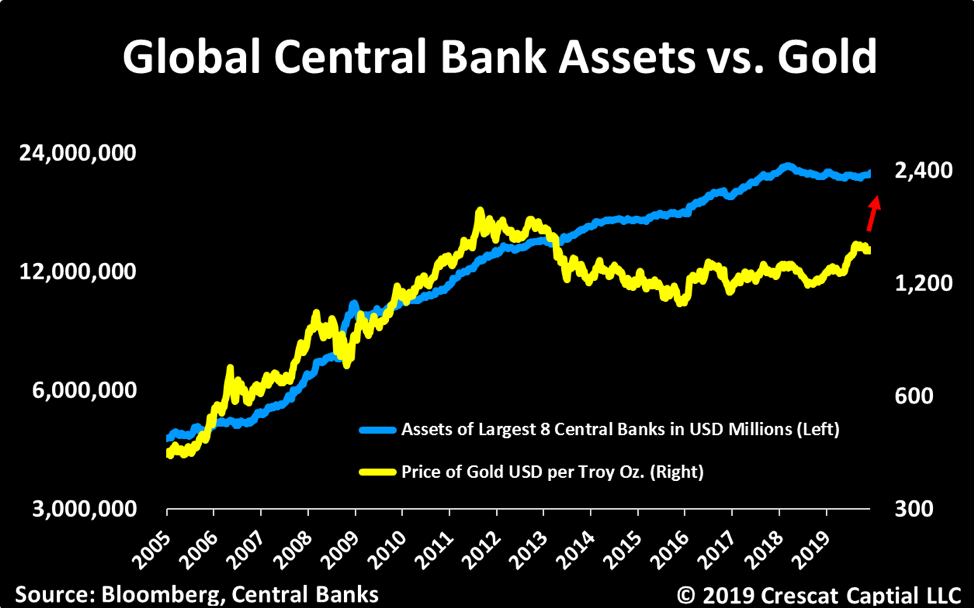
Excerpts from Crescat Capital November Newsletter:
Precious Metals
Precious metals are poised to benefit from what we consider to be the
best macro set up we’ve seen in our careers. The stars are all
aligning. We believe strongly that this time monetary policy will come
at a cost. Look in the chart below at how the new wave of global money
printing just initiated by the Fed in response to the Treasury market
funding crisis is highly likely to pull depressed gold prices up with
it.
The imbalance between historically depressed commodity prices
relative to record overvalued US stocks remains at the core of our macro
views. On the long side, we believe strongly commodities offer
tremendous upside potential on many fronts. Precious metals remain our
favorite. We view gold as the ultimate haven asset to likely outperform
in an environment of either a downturn in the business cycle, rising
global currency wars, implosion of fiat currencies backed by record
indebted government, or even a full-blown inflationary set up. These
scenarios are all possible. Our base case is that governments and
central banks will keep their pedals to the metal to attempt to fend off
credit implosion or to mop up after one has already occurred until
inflation becomes a persistent problem.
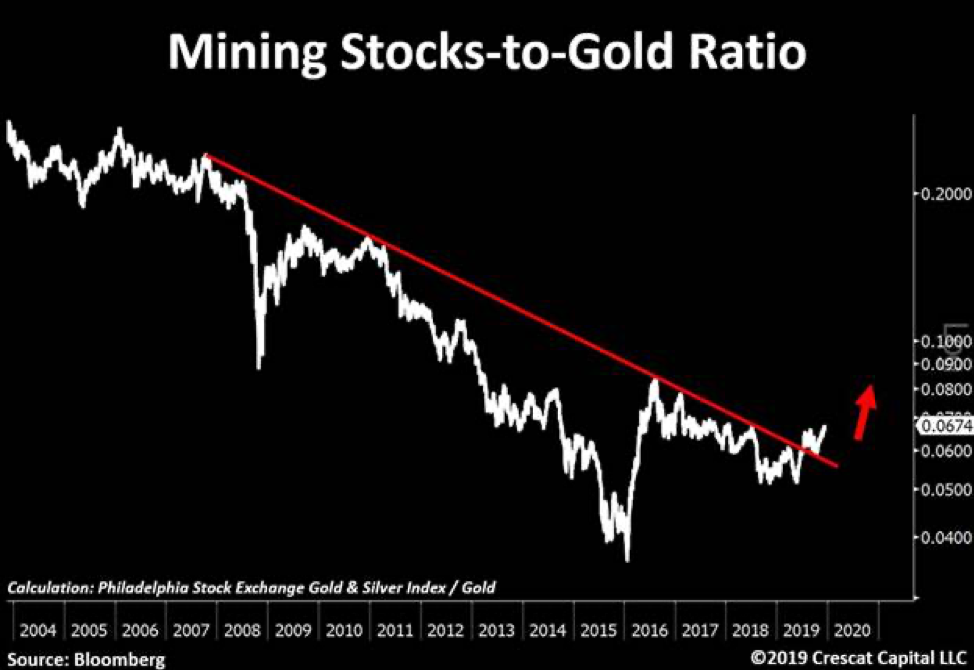
The gold and silver mining industry is precisely where we see one of
the greatest ways to express this investment thesis. These stocks have
been in a severe bear market from 2011 to 2015 and have been formed a
strong base over the last four years. They are offer and incredibly
attractive deep-value opportunity and appear to be just starting to
break out this year. We have done a deep dive in this sector and met
with over 40 different management teams this year. Combining that work
with our proprietary equity models, we are finding some of the greatest
free-cash-flow growth and value opportunities in the market today
unrivaled by any other industry. We have also found undervalued
high-quality exploration assets that will make excellent buyout
candidates.
We recently point out this 12-year breakout in mining stocks relative
to gold now looks as solid as a rock. In our view, this is just the
beginning of a major bull market for this entire industry. We encourage
investors to consider our new Crescat Precious Metals SMA strategy which
is performing extremely well this year.
Zero Discounting for Inflation Risk Today
With historic Federal debt relative to GDP and large deficits into
the future as far as the eye can see, if the global financial markets
cannot absorb the increase in Treasury debt, the Fed will be forced to
monetize it even more. The problem is that the Fed’s panic money
printing at this point in the economic cycle may hasten the unwinding of
the imbalances it is so desperate to maintain because it has perversely
fed the last-gasp melt up of speculation in already record over-valued
and extended equity and corporate credit markets. It is reminiscent of
when the Fed injected emergency cash into the repo market at the peak of
the tech bubble at the end of 1999 to fend off a potential Y2K computer
glitch that led to that market and business cycle top. After 40
years of declining inflation expectations in the US, there is a major
disconnect today between portfolio positioning, valuation, and economic
reality. Too much of the investment world is long the “risk parityâ€
trade to one degree or another, long stocks paired with leveraged long
bonds, a strategy that has back-tested great over the last 40 years, but
one that would be a disaster in a secular rising inflation environment.
With historic Federal debt relative to GDP and large deficits into
the future as far as the eye can see, rising long-term inflation, and
the hidden tax thereon, is the default, bi-partisan plan for the US
government’s future funding regardless of who is in the White House and
Congress after the 2020 elections. The market could start discounting
this sooner rather than later. The Fed’s excessive money printing
may only reinforce the unraveling of financial asset imbalances today as
it leads to rising inflation expectations and thereby a sell-off in
today’s highly over-valued long duration assets including Treasury bonds
and US equities, particularly insanely overvalued growth stocks. We
believe we are in the vicinity of a major US stock market and business
cycle peak.
Posted by AGORACOM
at 12:39 PM on Tuesday, January 28th, 2020
SPONSOR: Gratomic Inc. (TSX-V: GRAT) Advanced materials company focused on mine to market commercialization of graphite products, most notably high value graphene based components for a range of mass market products. Collaborating with Perpetuus, Gratomic will use Aukam graphite to manufacture graphene products for commercialization on an industrial scale. For More Info Click Here
In the weeks since the Physics World team kicked off the new year by testing a pair of graphene headphones, we’ve received a steady stream of comments about our review and a related segment on our weekly podcast. A few people have asked our opinion of other graphene headphones, and one man went so far as to question whether the “graphene†label he found on an inexpensive pair of headphones was anything more than “misleading click-baitâ€.
I can’t judge any product I haven’t tried, and I also can’t judge a product’s graphene content without taking it apart and getting experts to analyse it. However, with those two caveats firmly in place, here are two facts to consider should you happen to be in the market for graphene headphones (and, by extension, graphene anything).
First, a lot of things contribute to how a pair of headphones will sound. The physical composition of the headphone drivers (graphene, PET, cellulose, or whatever) is only one factor. Others include the method by which those drivers create sound (this blog post explains a few of the possibilities, and their trade-offs); the quality of the other electronics; and simple things like how well the headphones fit over/in your ears. Some of these things are more expensive to optimize than others. The graphene headphones I tested are a high-end product with, it appears, a high-end price, so I suspect they are pretty good at the non-graphene-related aspects of headphone design – and that much of their cost comes from that, not from the graphene.
Second, graphene exists in many forms, with many price points. A lot of physicists are interested in ultra-pure, single-layer graphene, which has amazing electronic properties. This “physicists’ graphene†is difficult (and expensive) to make in macroscopic quantities. However, others are more interested in graphene’s mechanical properties, such as strength and rigidity. To get these properties, you don’t need ultra-pure single-layer graphene. You can get by with a cheaper type, which for argument’s sake I will term “materials scientists’ graphene†(this is an oversimplification, but it conveys the right feel). The proprietary graphene-based material in the headphones I tested was most likely in this category.
But even this type of graphene is expensive relative to a third type
of graphene, which is cheap enough to be added in bulk to substances
like paint
or resin to improve their heat transport and/or electrical
conductivity. As I understand it, this “engineers’ graphene†functions
like a superior version of graphite, and manufacturers are selling it by
the kilo (and maybe, soon, by the tonne).
I’m not trying to start a three-way brawl between physicists,
materials scientists and engineers about which type of graphene is
better. They all have their uses,
and they all qualify as graphene. But here’s the problem: a product can
advertise itself, accurately, as containing graphene even if the
graphene it contains is not of a type or quantity that’s going to make a
difference to its performance. What’s more, if an unscrupulous
manufacturer wants to put graphite in its product and call it
“grapheneâ€, it’s hard for ordinary consumers to know the difference. To
the naked eye, graphene and graphite both look like gritty black
powders. You need more sophisticated testing equipment to distinguish
between them, and between the various grades of graphene.
Certification is a huge issue
for the graphene industry, and a lot of people are working on it.
However, until there’s a strong framework for regulation, the next best
thing is probably to look for independent endorsements by people and
organizations who know what they’re talking about. The headphones I
tried were endorsed by the co-discoverer of graphene, Kostya Novoselov,
as making good use of the material. Since then, I’ve learned of a different make of graphene headphones that has been endorsed by an industry body called the Graphene Council. However, until someone gives Physics World
its own product-testing lab and qualified technicians to run it, that’s
about all I can say – except to add that there are some graphene
products I definitely won’t be testing with my colleagues.
Posted by AGORACOM
at 5:17 PM on Monday, January 27th, 2020
SPONSOR: Gratomic Inc. (TSX-V: GRAT) Advanced materials company focused on mine to market commercialization of graphite products, most notably high value graphene based components for a range of mass market products. Collaborating with Perpetuus, Gratomic will use Aukam graphite to manufacture graphene products for commercialization on an industrial scale. For More Info Click Here
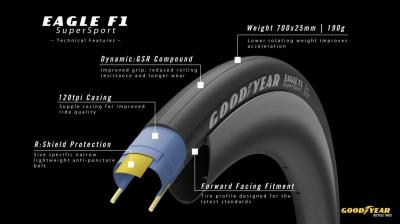
Goodyear developed a proprietary compound enhanced with graphene
The rubber is able to deliver low rolling resistance, improved grip in the dry and wet and long-term durability.
Famous tire and rubber company Goodyear has launched two new bicycle tyres, Eagle F1 and Eagle F1 Supersport utilizing graphene technology and weighing just 180g for a 23mm model.
The
new Eagle F1 is an “ultra-high-performance all-round road tire†and the
Eagle F1 Supersport, which is even lighter, is aimed at the upper
echelons of competition and will be suited to road racing, time trial
and triathlon where speed trumps all other requirements.
Goodyear has developed a proprietary compound enhanced with graphene and “next-generation amorphous (non-crystalline) spherical Silica†to create what it labels Dynamic:GSR. The result of this is said to be a rubber that is able to deliver low rolling resistance, improved grip in the dry and wet and long-term durability.
he Eagle F1 comes in five width options from 23 to 32mm, while the Eagle F1 Supersport comes in three widths from 23 to 28mm.
To
produce the new tire Goodyear has invested in its own factory in Taiwan
and has developed a process that allows much greater control over the
construction of the tire. It didn’t share too many details, but it
believes this enhanced precision contributes to significant weight
savings.
Currently the new Eagle F1 and F1 Supersport are only
available as clincher tube-type tires, but a tubeless tire is reportedly
in the pipeline for a launch later this year.
The new tires will cost from £45 and be in shops in February.
Posted by AGORACOM
at 2:04 PM on Wednesday, January 22nd, 2020
SPONSOR: American Creek owns a 20% Carried Interest to Production at the Treaty Creek Project in the Golden Triangle. 2019’s first hole averaged of 0.683 g/t Au over 780m in a vertical intercept. The Treaty Creek property is located in the same hydrothermal system as the Pretivm and Seabridge’s KSM deposits. Click Here for More Info
For the second time in as many weeks, the world’s largest hedge fund is once again talking up gold as an important diversifier for investors.
Speaking to CNBC’s Squawk Box on the sideline of the World Economic
Forum in Davos, Switzerland, Ray Dalio, founder of Bridgewater
Associates, said that in the current environment, investors should hold a
global diversified portfolio that includes some gold.
“Cash is trash,†he declared in the interview. He warned that investors should get out of cash as central banks continue to print money.
However, Dalio tempered his comments on the precious metal, saying that “a bit of gold is a diversifier.â€
But it is not only cash that Dalio railed against. He also didn’t
have anything nice to say about bitcoin, which is neither a medium of
exchange nor a store of value.
He said that investors shouldn’t go anywhere near bitcoin because of
its volatility. When it comes to a store of value, central banks will
continue to prefer to hold hard assets.
“What are [central banks] going to hold as reserves? What has been
tried and true? They are going to hold gold. That is a reserve
currency, and it has been a reserve currency for a thousand years,†he
said.
Although Dalio said that he sees a low chance of a recession in
2020, he warned investors to look further out. The risks are that
because of where monetary policy is right now, it will be less
effective when the downturn does come.
“At a point in the future, we still are going to think about what’s a
storeholder of wealth. Because when you get negative-yielding bonds or
something, we are approaching a limit that will be a paradigm shift,â€
he said.
Dalio has been fairly bullish on gold and for nearly three years has
advocated that investors hold at least 5% to 10% of their portfolio in
gold.
Dalio’s latest comments come less than a week after Greg Jensen,
co-chief investment officer at Bridgewater Associates, said in an
interview with the Financial Times that he sees gold pushing to $2,000
an ounce.
Jensen said that he sees higher gold prices through 2020 as
inflation picks up but central banks, in particular the Federal Reserve,
step away from the fight.
“The Fed won’t be pre-emptive,†he said.
Jensen said that he is also bullish on gold as geopolitical uncertainty dominates financial markets and investor sentiment.
“When you look at the geopolitical strife, how many foreign entities
really want to hold dollars? And what are they going to hold? Gold
stands out,†he said.


-637160977007144981.png)
-637160977627630029.png)