|

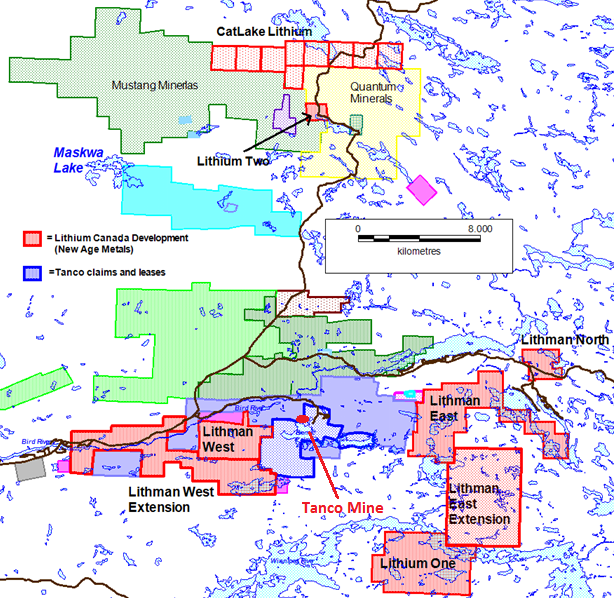
-The New Age Metal/Azincourt Option – Joint Venture is the largest claim holder of Lithium Projects in the Winnipeg River Pegmatite Field with over 14,000 hectares (34,800 acres). The Option/Joint Venture has eight projects in this large pegmatite field and are exploring for lithium-bearing pegmatites and Rare Metals.
– Field exploration is underway which includes further ground proofing to better outline drill targets on the Lithium Two Project. Past historical drilling has outlined the Eagle Pegmatite (one of several pegmatites on the project). In 1947 a previous operator reported, 545,000 tonnes of 1.4% Li2O drilled to 60 meters and which was reported as open along strike and to depth. The Eagle Pegmatite is not 43-101 compliant.
– Management feels based on the geological history of the Lithium Two Project, and more specifically the Eagle Pegmatite target, that it is drill ready but management also believes a more in depth field review and geological mapping and sampling program on this large pegmatite would help our technical team to better understand how to pinpoint the summer 2018 drill holes.
– The overall objective for the Lithium Two project is to complete a compliant NI 43-101 report by the end of Q1 2019.
– Field surface exploration will commence on the Lithman West Project as soon as the field team completes the work on Lithium Two. Lithium Two is one of the 3 the drill ready projects and is slated to be drilled later in the year.
– NAM’s Lithium Division has a minimum commitment of $600,000 for exploration and drilling in 2018 which is financed by NAM’s option/joint-venture partner Azincourt Energy Corp. (TSX.V:AAZ).
– NAM’s PGM Division: NAM’s flagship project is its 100% owned River Valley PGM Project (NAM Website – River Valley Project) in the Sudbury Mining District of Northern Ontario (100 km east of Sudbury, Ontario). Presently the River Valley Project is North America’s largest undeveloped primary PGM Project. |
June 14th, 2018 / Rockport, Canada – New Age Metals Inc. (TSX.V: NAM; OTCQB: NMTLF; FSE: P7J.F) is pleased to announce that through its Lithium Division, Lithium Canada Developments (LCD) and joint venture partner, Azincourt Energy, that field exploration is proceeding and underway on the Lithium Two Project in southeast Manitoba.
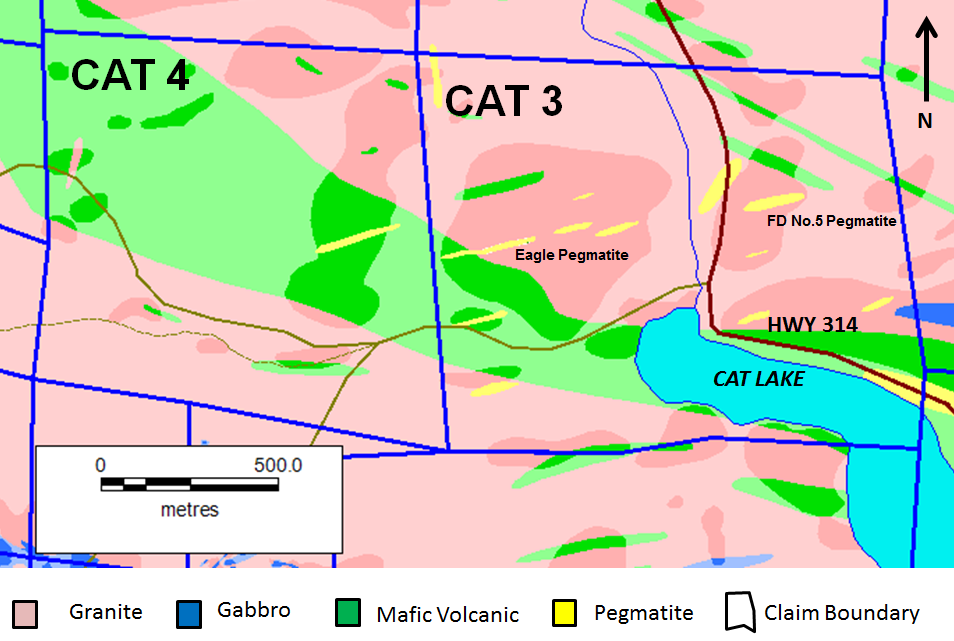
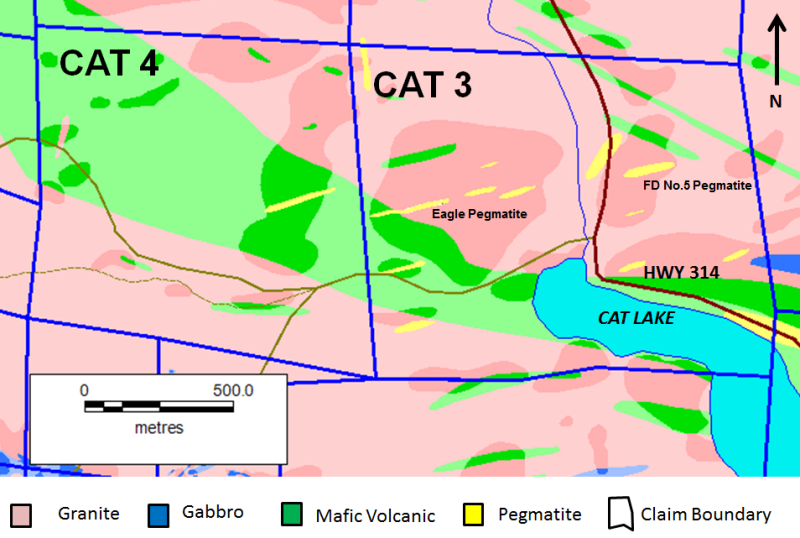
The field crews have nearly completed the first phase of the 2018 surface field exploration on the Lithium Two Project (see figure 1). This project is situated in the active Cat Lake region of southeast Manitoba. The project contains several known lithium-bearing pegmatites (Figure 2) with the Eagle Pegmatite being the largest known to date.
Historical drilling (43-101 non-compliant) of the Eagle Pegmatite in 1947 reported, 545,000 tonnes of 1.4% Li2O drilled to 60 meters and opened along strike and to depth. Management feels based on the geological history of the project that it is drill ready but also felt a field review and geological mapping programs and on this large pegmatite would better help our technical team define the existing summer drill targets.
Given the fact The Eagle Pegmatite is traceable on surface up to approximately 1100 meters and up to 12 meters wide. NAM completed a detailed exploration program of the surface pegmatites in 2016 which returned assays up to 3.04% for LiO2 for the Eagle Pegmatite and 2.08% from the FD5 Pegmatite. The 2018 field program consisted of sampling, prospecting and mapping. Assays will be sent out after the completion of field work on the project. Surface exploration will continue onto other Lithium Projects in the joint venture. Drilling is slated for summer 2018.
All eight Lithium Projects in the option/joint venture are located in the Winnipeg River-Cat Lake Pegmatite Field. This field hosts the world-class Tanco Pegmatite that has been mined for Tantalum, Cesium and Spodumene (one of the primary Lithium ore minerals) in varying capacities, since 1969 at the Tanco Mine. The Tanco Pegmatite is a highly fractionated Lithium-Cesium-Tantalum (LCT Type) pegmatite and numerous other Lithium-bearing pegmatites exist in the Pegmatite Field. The LCT-type pegmatites can contain large amounts of Spodumene (one of the primary ores used in hard rock Lithium extraction) and are a primary geological target in hard rock Lithium exploration. They also can contain economic qualities of Tantalum and Cesium as well as other Lithium bearing minerals such as Mica.

Click Image To View Full Size
Figure 1: Lithium Canada Development Southeast Manitoba Project Claim Outline: The Option/Joint Venture is the largest claim holder of Lithium Projects in the Winnipeg River Pegmatite Field with over 14,000 hectares (34,800 acres). Many of the projects have excellent infrastructure and a good ease of access.
Click Image To View Full Size
Figure 2: Geology Map of the Lithium Two Project
OPT-IN LIST
If you have not done so already, we encourage you to sign up on our website (www.newagemetals.com) to receive our updated news or click here.
ABOUT NAM’S PGM DIVISION
NAM’s flagship project is its 100% owned River Valley PGM Project (NAM Website – River Valley Project) in the Sudbury Mining District of Northern Ontario (100 km east of Sudbury, Ontario). Presently the River Valley Project is North America’s largest undeveloped primary PGM deposit with Measured + Indicated resources of 160 million tones @ 0.44 g/t Palladium, 0.17 g/t Platinum, 0.03 g/t Gold, with a total metal grade of 0.64 g/t at a cut-off grade of 0.4 g/t equating to 3,297,173 ounces PGM plus Gold and 4,626,250 PdEq Ounces (Table 1). This equates to 4,626,250 PdEq ounces M+I and 2,713,933 PdEq ounces in inferred (see May 8th, 2018 press release). Having completed a 2018 NI-43-101 resource update the company is finalizing its 2018 exploration programs which will include geophysics, and extensive drill programs, which are all working towards the completion of a Preliminary Economic Assessment (PEA). Our objective is to develop a series of open pits (bulk mining) over the 16 kilometers of mineralization, concentrate on site, and ship the concentrates to the long-established Sudbury Metallurgical Complex. On May 23rd, 2018, NAM’s board approved a Preliminary Economic Assessment (PEA) on River Valley Platinum Group Metals Project’s. Management is currently finalizing its selection of a 3rd party engineering company to complete this PEA. This will be the first economic study on the project. Alaska: April 4th, 2018, NAM signed an agreement with one of Alaska’s top geological consulting companies. The companies stated objective is to acquire additional PGM and Rare Metal projects in Alaska. On April 18th, 2018, NAM announced the right to purchase 100% of the Genesis PGM Project, NAM’s first Alaskan PGM acquisition related to the April 4th agreement. The Genesis PGM Project is a road accessible, under explored, highly prospective, multi-prospect drill ready Pd-Pt-Ni-Cu property.
The results of the new resource estimation are tabulated in Table 1 below (0.4 PdEq cut-off).
| Class |
Tonnes
‘,000 |
Pd (g/t) |
Pt (g/t) |
Rh (g/t) |
Au (g/t) |
Cu (%) |
Ni (%) |
Co (%) |
PdEq (g/t) |
| Total Measured |
62,877.5 |
0.49 |
0.19 |
0.02 |
0.03 |
0.05 |
0.01 |
0.002 |
0.99 |
| Total Indicated |
97,855.2 |
0.40 |
0.16 |
0.02 |
0.03 |
0.05 |
0.01 |
0.002 |
0.83 |
| Total Meas +Ind |
160,732.7 |
0.44 |
0.17 |
0.02 |
0.03 |
0.05 |
0.01 |
0.002 |
0.90 |
| Inferred |
127,662.0 |
0.27 |
0.12 |
0.01 |
0.02 |
0.05 |
0.02 |
0.002 |
0.66 |
| Class |
PGM + Au (oz) |
PdEq (oz) |
PtEq (oz) |
AuEq (oz) |
| Total Measured |
1,440,248 |
1,999,575 |
1,999,575 |
1,136,930 |
| Total Indicated |
1,856,925 |
2,626,675 |
2,626,675 |
1,463,793 |
| Total Meas +Ind |
3,297,173 |
4,626,250 |
4,626,250 |
2,600,724 |
| Inferred |
1,578,367 |
2,713,933 |
2,713,933 |
1,323,809 |
Notes:
1. CIM definition standards were followed for the resource estimation.
2. The 2018 resource models used Ordinary Krig grade estimation within a three-dimensional block model with mineralized zones defined by wireframed solids.
3. A base cut-off grade of 0.4 % g/t PdEq was used for reporting resources.
4. Palladium Equivalent (PdEq) calculated using (US$): $1,000/oz Pd, $1,000/oz Pt, $1,350/oz Au, $1750/oz Rh, $3.20/lb Cu, $5.50/lb Ni, $36/lb Co.
5. Numbers may not add exactly due to rounding.
6. Mineral Resources that are not mineral reserves do not have economic viability
7. The quantity and grade of reported inferred resources in this estimation are uncertain in nature and there has been insufficient exploration to define these inferred resources as an indicated or measured mineral resource and it is uncertain if further exploration will result in upgrading them to an indicated or measured mineral resource category.
ABOUT NAM’S LITHIUM DIVISION
The summer exploration plan has begun for the company’s Lithium Division. NAM has 100% ownership of eight pegmatite hosted Lithium Projects in the Winnipeg River Pegmatite Field, located in SE Manitoba, with focus on Lithium bearing pegmatites. Three of the projects are drill ready. This Pegmatite Field hosts the world class Tanco Pegmatite that has been mined for Tantalum, Cesium and Spodumene (one of the primary Lithium ore minerals) in varying capacities, since 1969. NAM’s Lithium Projects are strategically situated in this prolific Pegmatite Field. Presently, NAM is the largest mineral claim holder for Lithium and Rare Metal projects in the Winnipeg River Pegmatite Field.
Lithium Canada Development is a 100% owned subsidiary of New Age Metals (NAM) who presently has an agreement with Azincourt Energy Corporation (AAZ) whereby AAZ will now commit on its first year a minimum of $600,000 in 2018. In its initial earn in AAZ may earn up to 50%, of the eight Lithium projects that are 100% owned by NAM. AAZ’s 50% exploration expenditure earn in is approximately $2.850 million and should they continue with their option they must issue up to 1.75 million shares of AAZ to NAM. NAM has a 2% royalty on each of eight Lithium Projects in this large pegmatite field. For additional information on the NAM/AAZ option/joint-venture and recent acquisitions (see the news releases dated Jan 15, 2018, May 2, 2018, May 10, 2018).
QUALIFIED PERSON
The contents contained herein that relate to Exploration Results or Mineral Resources is based on information compiled, reviewed or prepared by Carey Galeschuk, a consulting geoscientist for New Age Metals. Mr. Galeschuk is the Qualified Person as defined by National Instrument 43-101 and has reviewed and approved the technical content of this news release.
On behalf of the Board of Directors
“Harry Barr”
Harry G. Barr
Chairman and CEO
ADDITIONAL INFORMATION
Should you have additional inquiries, please contact Paul Poggione, Corporate Development, Tel: 1-613-659-2773, email: [email protected].
Neither the TSX Venture Exchange nor its Regulation Services Provider (as that term is defined in the policies of the TSX Venture Exchange) accepts responsibility for the adequacy or accuracy of this release.
Cautionary Note Regarding Forward Looking Statements: This release contains forward-looking statements that involve risks and uncertainties. These statements may differ materially from actual future events or results and are based on current expectations or beliefs. For this purpose, statements of historical fact may be deemed to be forward-looking statements. In addition, forward-looking statements include statements in which the Company uses words such as “continue”, “efforts”, “expect”, “believe”, “anticipate”, “confident”, “intend”, “strategy”, “plan”, “will”, “estimate”, “project”, “goal”, “target”, “prospects”, “optimistic” or similar expressions. These statements by their nature involve risks and uncertainties, and actual results may differ materially depending on a variety of important factors, including, among others, the Company’s ability and continuation of efforts to timely and completely make available adequate current public information, additional or different regulatory and legal requirements and restrictions that may be imposed, and other factors as may be discussed in the documents filed by the Company on SEDAR (www.sedar.com), including the most recent reports that identify important risk factors that could cause actual results to differ from those contained in the forward-looking statements. The Company does not undertake any obligation to review or confirm analysts’ expectations or estimates or to release publicly any revisions to any forward-looking statements to reflect events or circumstances after the date hereof or to reflect the occurrence of unanticipated events. Investors should not place undue reliance on forward-looking statements.


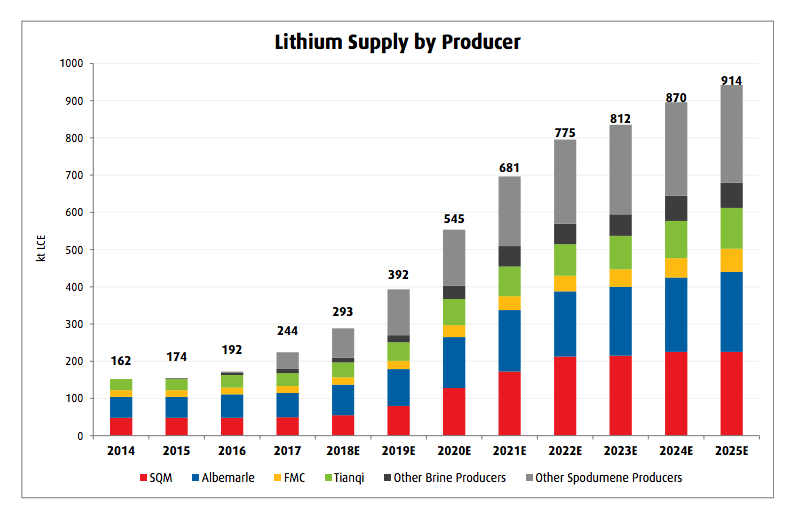 Wave of much-needed spodumene based supply coming online. (Source:
 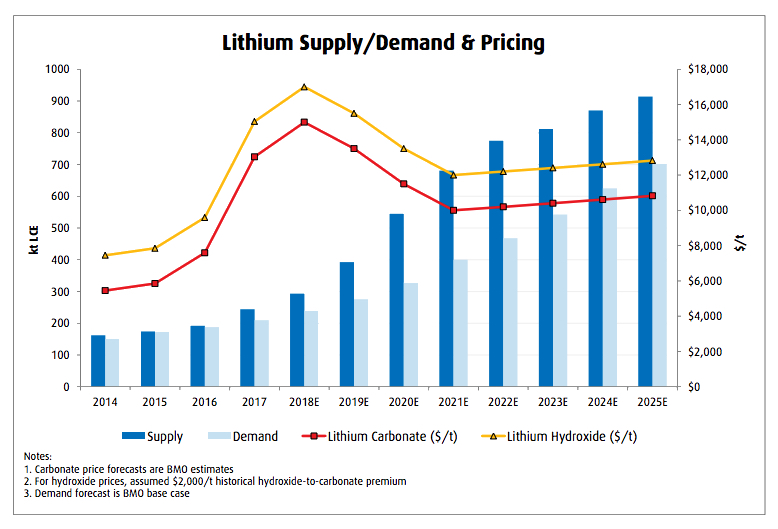 Source:


 View original content with multimedia: http://www.newswire.ca/en/releases/archive/June2018/20/c8059.html