Posted by AGORACOM
at 11:50 AM on Tuesday, February 4th, 2020
Sponsor: Affinity Metals (TSX-V: AFF) a Canadian mineral exploration company building a strong portfolio of mineral projects in North America. The Corporation’s flagship property is the Drill ready Regal Property near Revelstoke, BC. Recent sampling encountered bonanza grade silver, zinc, and lead with many samples reaching assay over-limits. Click Here for More Info
Well Known Big Investors Are Now Buying Gold As central banks continue to go wild, the list of well known investors who are buying and recommending gold continues to grow.
As Ronald-Peter Stöferle, author of the “#InGoldWeTrust†report and a fund manager for #Incrementum
was kind of enough to join me on the show and discuss. Ronni talks
about how while gold has been reaching all time highs in many #currencies around the globe, it’s now even starting to rally in #dollar terms.
And with low or even #negativeinterestrates prevailing around the globe, the appeal of gold is shining brighter than ever.
He also provides updates on the #inflation warning he issued late last year, why #centralbanks continue to buy gold, what #investors
can expect in this year’s version of his highly sought after “In Gold
We Trust Report,†and a few of the gold companies he’s an advisor to.
So to hear a #goldmarket update from one of the most well informed and connected gold investors on the planet, click to watch the interview now! – To get access to Ronni’s “In Gold We Trust
Posted by AGORACOM
at 2:54 PM on Tuesday, January 21st, 2020
Sponsor: Affinity Metals (TSX-V: AFF) a Canadian mineral exploration company building a strong portfolio of mineral projects in North America. The Corporation’s flagship property is the Drill ready Regal Property near Revelstoke, BC. Recent sampling encountered bonanza grade silver, zinc, and lead with many samples reaching assay over-limits. Click Here for More Info
(Kitco News) – The
merger and acquisition activity that swept through the mining sector in
2019 is only going to pick up momentum this year as mine developers and
junior explorers are next on the auction block, according to one
financing company.
In a recent webinar, Derek Macpherson, vice president of research at
Red Cloud, said that with gold in the early inning of a new bull market,
he expects to see more M&A activity in the mining sector.
However, he added that sentiment is a little different than it was in 2019.
“The M&A activity we saw last year focused on production assets,â€
he said. “As we see fewer of those assets become available companies
will have to look further down cap. I think we are getting a lot closer
to seeing junior explorers benefit from M&A activity.â€
The comments come as junior explorers continue to struggle to attract
investor attention. The sector was still largely ignored in 2019 as the
M&A activity focused on creating mega-gold companies and larger
producers.
Macpherson said that although some companies are struggling to
attract attention, investors should focus on the companies that are
activity developing and de-risking their projects.
“In this environment and with the potential for more M&A activity, the drill bit is the key to value,†he said.
Macpherson added because of solid production and higher prices in
2019 many mid-tier mining companies are in good shape to go shopping in
the market again. Further divestitures from the major gold producers
also means more opportunities to buy.
Not only are miners in a hurry to replace dwindling reserves, but
Macpherson noted that a strong gold price will add to growing confidence
in the marketplace. He noted that there are growing calls for $2,000
gold.
“I think gold at $1,600 is in the mix but I also don’t think $2,000 is out of the realm of possibilities,†he said.
Looking at the gold market, the financial firm sees strong investment
demand for the yellow metal as central banks around the world maintain
ultra-loose monetary policy.
“More money printing and negative yielding debt make gold a very attractive asset class,†he said.
Macpherson also noted that with equity markets at record valuations,
it wouldn’t take much for investors jump out off the S&P and into
more safe-haven assets.
Posted by AGORACOM
at 12:49 PM on Sunday, January 19th, 2020
Sponsor: Affinity Metals (TSX-V: AFF) a Canadian mineral exploration
company building a strong portfolio of mineral projects in North
America. The Corporation’s flagship property is the Drill ready Regal
Property near Revelstoke, BC. Recent sampling encountered bonanza grade
silver, zinc, and lead with many samples reaching assay over-limits.
Further assaying of over-limits has been initiated, results will be
reported once received. Click Here for More Info
From the HRA Journal: Issue 314
The fun doesn’t stop. Waves of liquidity continue to wash traders
cares away. Even assassinations and war mongering generate little more
than half day dips on Wall St. It seems nothing can get in the way of
the bull rally that’s carrying all risk assets higher.
It feels like it could go on for a while, though I think the
liquidity will have to keep coming to sustain it. By most readings,
bullishness on Wall St is at levels that are rarely sustained for more
than a few weeks. Some sort of correction on Wall St seems highly
likely, and soon. Whether its substantial or just another blip on the
way higher remains to be seen.
The resource sector, especially gold and silver stocks, have had
their own rally. Our Santa Claus market was as good or better than Wall
St’s for a change. And I don’t think its over yet. I think we’re in for
the best Q1 we’ve seen for a few years. And we could be in for something
better than that even. I increasingly see signs of a major rally
developing in the gold space. It’s already been pretty good but I think a
multi-quarter, or longer, move may be starting to take shape.
I usually spend time on all the metals in the first issue of the
year. But, because the makings of this gold rally are complex and long
in coming I decided to detail my reasoning. That ended up taking several
pages so I’ll save talk on base metals and other markets for the next
issue.
No, I’m not writing about Louis IV, though there might be some
appropriateness to the analogy, now that I think about it. The quote is
famous, even though there’s no agreement on what it was supposed to
mean. Most figure Louis was referring to the biblical flood, that all
would be chaos once his reign ended.
The deluge I’m referring to isn’t water. It’s the flood of money the
US Fed, and other central banks, continue to unleash to keep markets
stable. Markets, especially stock markets, love liquidity. You can see
the impact of the latest deluge, particularly the US Fed’s in the chart
below that traces both the SPX index value and the level of a “Global
Liquidity Proxy†(“GLPâ€) measuring fiscal/monetary tightness and
weakness.
You can see the GLP moved lower in late 2018 as the Fed tightened and
the impact that had on Wall St. Conversely, you can see the SPX running
higher in the past couple of months as the US backed off rate
increases, increased fiscal deficit expansion, and grew the Fed balance
sheet through, mainly, repo market operations.
Wall St, and most other bourses, are loving these money flows. The
Santa Claus rally discussed in the last issue continued to strengthen
all the way to and through year end. As it turned out, the Fed either
provided enough backstop in advance or the yearend repo issues were
overstated. The repo market itself was calm going through year end and a
lot of the short-term money offered by the Fed during that week wasn’t
taken down.
Everything may have changed in the past couple of days with the
dramatic increase in US-Iran tensions. I don’t know how big an issue
that will be, since no one knows what form Iran’s retaliation will be or
how much things will escalate. I DO think it’s potentially a big deal
with very negative connotations, but it may take time to unfold. Someone
at the Fed thought so too, as the past couple of days saw a return to
large scale Fed lending in the repo market.
I’ve no doubt Iran will try and take revenge for the assassination of
its most famous military commander by the US. But I don’t know what
form it will take and if this means the US has drawn itself into the
Mideast quagmire even more. I fear it has though. The US is already
talking about adding 3,000 troops to its Mideast presence and they’re
just warming up. Even larger scale attacks, if they happen, may not
derail Wall St, but they’re certainly not a positive development at any
level.
We know how stretched both market valuations and sentiment were
before the Suleimani drone strike. The chart below shows a three-year
trace of the “fear/greed indexâ€. You can see that its hardly a stable
reading. It flip flops often and extreme readings rarely hold for long.
At last check, the reading was 94% bullish.
Sentiment almost never gets that bullish and, when it does, nothing
good comes of it for bulls. A reading that close to 100% tells you we’re
just about out of buyers. Whatever happens in and around Iran, I think a
near term correction is inevitable. The only question is whether it’s a
large one or not.
A rapid escalation in US-Iran tensions could certainly make a near
term correction larger. If the flood of liquidity continues though, a
correction could just be another waystation on the road to higher highs.
There are a couple of other dangers Wall St still faces that I’ll touch
on briefly at the end of this article. First however, lets move on to
the main event for us-the gold market.
It wasn’t just the SPX enjoying a Santa rally this year. Gold
experienced the rally we were hoping for that gold miner stocks seemed
to be foretelling early last month. Gold’s been doing well since it
bottomed at $1275 in June, but it didn’t feel that way during the long
hiatus between the early September high and the current move. The gold
price currently sits above September’s multi-year high, after breaching
that high in the wake of the Baghdad drone strike. And the first
retaliatory strike by Iran. Volatility will be very high for a while
going forward.
I think we’ll see more multi-year highs going forward. I hate that
the latest move higher is driven by geopolitics. Scary geopolitics and
military confrontations mean people are dying. We don’t want to profit
from misery. And we won’t anyway, if things get ugly enough in the
Mideast to scare traders out of the market.
Geopolitical price moves almost always unwind quickly. I’d much
prefer to see gold moving higher for macro reasons, not as a political
safety trade. I expect more political/military inspired moves. As the
Iran conflict unfolds. Make no mistake, Iran is NOT Iraq. Its army is
far larger, better trained and better equipped than Iraq. This could get
ugly.
The balance of this piece will deal with my macro argument for higher
gold prices over an extended period. The geopolitical stuff will be
layered on top of that for the next while and could strengthen both gold
prices and the $US in risk-off trading. It should be viewed as a
separate event from the argument laid out below.
What else is driving gold higher? In part, it was gold’s inverse
relationship with the US Dollar. As you already know, I’m not a believer
that “its all about the USD, all the time†when it comes to the gold
market. That’s an over-simplification of a more complex relationship. It
also discounts the idea of gold as its own asset class that trades for
its own reasons.
If you look at the gold chart above, and the USD chart below it, its
immediately apparent that there isn’t a constant negative correlation at
play. Gold rallied during the summer at the same time the USD did and
for the same reason; the world-wide explosion of negative real yields.
Gold weakened a bit when yields reversed to the upside and the USD got a
bit of traction, but things changed again at the start of December.
The USD turned lower and lost two percent during December. US bond
yields were generally rising during the month and the market (right or
wrong) was assuming economic growth was accelerating. So, neither of
those items explains the USD weakness.
If gold was a “risk off†trade, you sure couldn’t see it in the way
any other market was trading. So, is there another explanation for
recent strength in the gold price, and what does it tell us about 2020
and, perhaps, beyond?
Well, I’ve got a theory. If I’m right, it could mean a bull run for gold has a long way to go.
Some of this theory will be no surprise to you because it does
partially hinge on further USD weakness. There are long term structural
reasons why the US currency should weaken. But there are also
fluctuating sources of demand for USDs, particularly from offshore
buyers and borrowers that transact in US currency. That can create
enough demand to strengthen the US over long periods. We just went
though one such period, but it looks like that may have come to an end,
with more bearish forces to the USD reasserting themselves.
How did we get here? Let’s start with the big picture, displayed on
the top chart on the next page. It gives a long-term view of US Federal
deficits and the unemployment rate. Normally, these travel in tandem.
Higher unemployment means more social spending and higher deficits.
Government spending expands during recessions and contracts-or should-
(as a percentage of GDP) during expansions. Classic Keynesian stuff.
You rarely see these two measures diverge. The two times they did
significantly before, on the left side of the chart, was due to “wartime
deficits†which acted (along with conscription) to stimulate the
economy and drive down unemployment.
You can see the Korean and Vietnam war periods pointed out on the chart.
The current period stands out for the extreme size of the divergence.
US unemployment rates are at multi decade lows and yet the fiscal
deficit as a percentage of GDP keeps rising. There has never been a
divergence this large and its due to get larger.
We know why this is. Big tax cuts combined with a budget that is
mostly non-discretionary. And the US is 10 years into an economic
expansion, however weak. Just think what this graph will look like the
next time the US goes into recession.
We can assume US government deficits aren’t going to shrink any time
soon (and I think we can, pun intended, take that to the bank). That
leaves trade in goods to act as a counterbalance to the funding demand
created by fiscal deficits.
The chart above makes it clear the US won’t get much help from
international trade. The US trade balance has been getting increasingly
negative for decades. It’s better recently, but unlikely to turn
positive soon, and maybe not ever.
To be clear, this is not a bad thing in itself, notwithstanding the
view from the White House. The relative strength of the US economy and
the US Dollar and cheaper offshore production costs have driven the
trade balance. It’s grown because Americans found they got more value
buying abroad and the world was happy to help finance it. It’s not a bad
thing, but not a US Dollar support either.
The more complete picture of currency/investment flows is given by
changes in the Current Account. In simplified terms, the Current Account
measures the difference between what a country produces and what it
consumes. For example, if a country’s trade deficit increases, so does
its current account deficit. If there are funds flowing in from overseas
investments on the other hand, this decrease the Current Account
deficit or increase the surplus.
The graph below summarizes quarterly changes in the US current
account. You can see how the balance got increasingly negative in the
mid 2000’s as both imports and foreign investment by US companies
increased.
Not coincidentally, this same period leading up to the Financial
Crisis included a sustained downtrend in the US Dollar Index. The USD
index chart on the bottom of the next page shows the scale of that
decline, from an index value of 120 at the start of 2002 all the way
down to 73 in early 2008.
The current account deficit (and value of the USD) improved markedly
up to the end of the Financial Crisis as money poured into the US as a
safe haven and consumers cut back on imports. The current account
deficit bas been relatively stable since then, running at about
$100bn/quarter until it dipped a bit again last year.
Trade, funds flows and changes in money supply have the largest
long-term impacts on currency values. When the US Fed ended QE and
started tightening monetary conditions in 2014, the USD enjoyed a strong
rally. The USD Index was back to 100 by early 2015 and stayed there
until loosening monetary conditions-and lots of jawboning from
Washington-led to pullback. Things reversed again and the USD maintained
a mild uptrend from early 2018 until now.
There are still plenty of US Dollar bulls around, and their arguments
have short-term merit. Yes, the US has higher real interest rates and
somewhat higher growth. Both are important to relative currency
valuations as I’ve said in the past. Longer term however, the “twin
deficits†-fiscal and current account-should underpin the fundamental
value of the currency.
Movements don’t happen overnight, especially when you’re talking
about the worlds reserve currency that has the deepest and largest
market supporting it. Changing the overall trend for the USD is like
turning a supertanker. I think it’s happening though, and it has big
potential implications for commodities, especially gold.
Dollar bulls will tell you the USD is the “cleanest shirt in the
laundry hamperâ€, referring to the relative strength of the growth rate
and interest rates compared to other major currencies. That’s true if we
just look at those measures but definitely not true when we look at the
longer term-fiscal and current account deficits.
In fact, the US has about the worst combined fiscal/current account deficit in the G7. The chart at the bottom of this page, from lynalden.com
shows the 2018 values for Current Account and Trade balances for a
number of major economies, as a percentage of their GDP. It’s not a
handsome group.
Both the trade and current account deficits are negative for most of
them. In terms of G7 economies, the US has the worst combined
Current/Trade deficit at 6% of GDP annually. You may be surprised to
note that the Current/Trade balance for the Euro zone is much better
than the US, thanks to a large Trade surplus. Much of that is generated
by Germany. Indeed, this chart explains Germanys defense of the Euro.
It’s combined Trade/Current Account surplus is so large it’s currency
would be skyrocketing if it still used the Deutschmark.
Because the current account deficit is cumulative, the overall
international investment position of the US has continued to worsen. The
US has gone from being an international creditor to an international
debtor, and the scale if its debt keeps increasing. That means it’s
getting harder every year to reverse the current account position as the
US borrows ever more abroad to cover its trade and fiscal deficits.
Interest outflows keep growing and investment inflows shrinking.
Something has to give.
The US has to borrow overseas, as private domestic demand for
Treasury bonds isn’t high enough to fund the twin deficits. In the past,
whenever the US Dollar got too high, offshore demand for US government
debt diminished. It’s not clear why. Maybe the higher dollar made
raising enough foreign funds difficult, or perhaps buyers started
worrying about the USD dropping after they bought when it got too
expensive. Whatever the reason, foreign holdings of US Treasuries have
been declining, forcing the US to find new, domestic, buyers.
Last year, the US Fed stopped its quantitative tightening program,
due to concerns about Dollar liquidity. Then came the repo market. Since
September, the Fed’s balance sheet has expanded by over $400 billion,
mainly due to repo market transactions.
The Fed maintains this “isn’t QE†because these are very short duration transactions but, cumulatively, the total Fed balance sheet keeps expanding. The “QE/no QE†debate is just semantics.
What do these transactions look like? Mostly, its Primary Dealers,
banks that also take part in Treasury auctions, in the repo market. The
Fed buys bonds, usually Treasuries, from these banks and pays for them
in newly printed Dollars. That injects money into the system, helps hold
down interest rates in the repo market and, not coincidentally,
effectively helps fund the US fiscal deficit. To put the series of
transactions in their simplest form, the US is effectively monetizing its deficit with a lot of these transactions.
The chart below illustrates the problem for the Primary Dealer US
banks. They’ve got to buy Treasuries when they’re auctioned-that is
their commitment as Primary Dealers. They also need to hold minimum cash
balances as a percentage of assets under Basel II bank regulations.
Cash balances fell to the minimum mandated level by late 2019- the
horizontal black line on the chart. That’s when the trouble started.
These banks are so stuffed with Treasuries that they didn’t have
excess cash reserves to lend into the repo market. Hence the blow up
back in September and the need for the Fed to inject cash by buying
Treasuries. The point, however, is that this isn’t really a “repo market
issueâ€, that’s just where it reared its head. It’s a “too many
Treasuries and not enough buyers†problem.
It will be tough for the Treasury to attract more offshore buyers
unless the USD weakens, or interest rates rise enough to make them
irresistible. Or a big drop in the federal deficit reduces the supply of
Treasuries itself.
I doubt we’ll see interest rates move up significantly. I don’t think
the economy could handle it and it would be self-defeating anyway, as
the government deficit would explode because of interest expenses. And
that’s not even taking into account the fact that President Trump would
be freaking out daily.
Based on recent history and political expediency, I’d say the odds of
significant budget deficit reductions are slim and none. That’s
especially true going into an election year. There’s just no way we’re
going to see spending restraint or tax increases in the next couple of
years. Indeed, the supply of Treasuries will keep growing even if the US
economy grows too. If there is any sort of significant slowdown or
recession the Federal deficit will explode and so will the new supply of
Treasures. Not an easy fix.
Barring new haven demand for US Treasuries, odds are the Fed will
have to keep sopping up excess supply. That means expanding its balance
sheet and, in so doing, effectively increasing the US money supply.
That brings us (finally!) to the “money shot†chart that appears
above. It compares changes in the size of the Fed balance sheet and the
US Dollar Index. To make it readable and allow me to match the scales, I
generated a chart that tracks annual percentage changes.
The chart shows a strong inverse correlation between changes in the
size of the Fed balance sheet and the value of the USD. This is
unsurprising as most transactions that expand the Fed balance sheet also
expand the money supply.
It’s impossible to tell how long the repo market transactions will
continue but, after three months, they aren’t feeling very “temporaryâ€.
To me, it increasingly looks like these market operations are “debt
monetization in dragâ€.
I don’t know if that’s the Fed’s real intent or just a side effect.
It doesn’t really matter if the funding and money printing continues at
scale. Even if the repo market calms completely, the odds are good we
see some sort of “new QE†start up. Whatever official reason is given
for it; I think it will happen mainly to soak up the excess supply of
Treasuries fiscal deficits are creating.
I don’t blame the FOMC if they’re being disingenuous about it. That’s
their job after all. If you’re a central banker, the LAST thing you’re
going to say is “our government is having trouble finding buyers for its
debtâ€, especially if its true.
With no prospect of lower deficits and apparent continued reduction
in offshore Treasury holdings, this could develop into long-term
sustained trend. I don’t expect it to move in a straight line, markets
never do. A severe escalation in Mideast tensions or the start of a
serious recession could both generate safe-haven Treasury buying. Money
flows from that would take the pressure off the Fed and would be US
Dollar supportive too.
That said, it seems the US has reached the point where a substantial
increase in its central bank’s balance sheet is inevitable. Both Japan
and the Eurozone have gotten there before the Fed, but it looks like it
won’t be immune.
The Eurozone at least has a “Twin surplus†to help cushion things.
And Japan, considered a basket case economically, had an extremely deep
pool of domestic savings (far deeper than the US) to draw on. Until very
recently, Japan also ran massive Current Account surpluses thanks to
decades of heavy investments overseas by Japanese entities. Those
advantages allowed the ECB and especially the BoJ to massively expand
their balance sheets without generating a huge run up in interest rates
or currency collapse.
I don’t know how far the US Fed can expand its balance sheet before
bond yields start getting away from it. I think pretty far though.
Having the world’s reserve currency is a massive advantage. There is
huge built in demand for US Dollars and US denominated debt. That gives
the Fed some runway if it must keep buying US Treasuries.
Assuming a run on yields doesn’t spoil the party, continued balance
sheet and money supply expansion should put increasing downward pressure
on the US Dollar. I don’t know if we’ll see a move as large as the
mid-2000s but a move down to the low 80s for the USD Index over the
course of two or three years wouldn’t be surprising.
It won’t be a straight-line move. A recession could derail things,
though the bear market on Wall St that would generate would support
bullion. Currency markets tend to be self-correcting over extended
periods. If the USD Index falls enough and there is a bump in US real
interest rates offshore demand for Treasuries should increase again.
The bottom line is that this is, and will continue to be, a very
dynamic system. Even so, I think we’ve reached a major inflection point
for the US currency. The 2000s were pretty good for the gold market and
gold stocks. We started from a much lower base of $300/oz on the gold
price. Starting at a $1200-1300 base this time, I think a price above
$2000/oz is a real possibility over the next year or two.
It’s not hard to extrapolate prices higher than that, but I’m not
looking or hoping for those. I prefer to see a longer, steadier move
that brings traders along rather than freaking them out.
This prediction isn’t a sure thing. Predictions never are. But I
think the probabilities now favor an extended bull run in the gold
price. Assuming stock markets don’t blow up (though I still expect that
correction), gold stocks should put in a leveraged performance much more
impressive than the bullion price itself.
There will be consolidations and corrections along the way, but I
think there will be many gold explorers and developers that rack up
share price gains in the hundreds of percent. That doesn’t mean buying
blindly and never trading. We still need to adjust when a stock gets
overweight and manage risk around major exploration campaigns. The last
few weeks has been a lot more fun in the resource space. I don’t think
the fun’s over yet. Enjoy the ride.
Like any good contrarian, a 10-year bull market makes me alert of
signs of potential trouble. As noted at the start of this editorial, I’m
expecting continues floods of liquidity. That may simply overwhelm
everything else for a while and allow Wall St to keep rallying, come
what may.
That said, a couple of data points recently got my attention. One is
more of a sentiment indicator, seen in the chart below. More than one
wag has joked that the Fed need only worry about Wall St, since the
stock market is the economy now. Turns out there is more than a bit of
truth to that.
The chart shows the US Leading Indicator reading with the level of
the stock market (which is a component of the official Leading
Indicator) removed. As you can see, without Wall St, the indicator
implies zero growth going forward. I’m mainly showing it as evidence of
just how surreal things have become.
The chart above is something to keep an eye on going forward. It
shows weekly State unemployment claims for several major sectors of the
economy. What’s interesting about this chart is that claims have been
climbing rapidly over the past few weeks. Doubly interesting is that the
increase in claims is broad, both within and across several sectors of
the economy.
I take the monthly Non-Farm Payroll number less seriously than most,
because it’s a backward-looking indicator. This move in unemployment
claims looks increasingly like a trend though. It’s now at its highest
level since the Financial Crisis.
It’s not in the danger zone-yet. But its climbing fast. We may need
to start paying more attention to those payroll numbers. If the chart
below isn’t a statistical fluke, we may start seeing negative surprises
in the NFP soon. That won’t hurt the gold price either.
Source and Thanks: https://www.hraadvisory.com/golds-big-picture
Tags: #VRIC Posted in Affinity Metals, All Recent Posts | Comments Off on Gold’s Big Picture SPONSOR: Affinity Metals $AAF.ca $SII.ca $TUD.ca $GTT.ca $AMK.ca $OSK.ca $RKR.ca
Posted by AGORACOM
at 9:32 AM on Friday, January 17th, 2020
Affinity Metals Corp. (TSXV: AFF) would like to cordially
invite you to visit us at Booth #437 at the Vancouver Resource
Investment Conference (VRIC) to be held at the Vancouver Convention
Centre West (1055 Canada Place, Vancouver) on Sunday January 19 – Monday
January 20, 2020.
The Vancouver Resource Investment
Conference has been the bellwether of the junior mining market for the
last twenty-five years. It is the number one source of information for
investment trends and ideas, covering all aspects of the natural
resource industry.
Each year, the VRIC hosts over 60 keynote speakers, 350 exhibiting companies and 9000 investors.
Investment
thought leaders and wealth influencers provide our audiences with
valuable insights. C-suite company executives covering every corner of
the mineral exploration sector as well as metals, oil & gas,
renewable energy, media and financial services companies are available
to speak one on one. This is a must-attend for investors and
stakeholders in the global mining industry.
Posted by AGORACOM
at 9:38 AM on Wednesday, January 15th, 2020
Affinity Metals Corp. (TSXV: AFF) (“Affinity”) (“the
Corporation”) is pleased to release over-limit assays for samples from
the fall 2019 exploration on the Regal property located in the northern
end of the prolific Kootenay Arc approximately 35 km northeast of
Revelstoke, British Columbia, Canada.
As previously reported, the Corporation received assay results for all 22 rock samples collected from surface outcrops in September 2019 from the Black Jacket and ALLCO areas of the property. Of the 22 grab samples collected, the majority contained bonanza grade silver, zinc, and lead with many samples reaching assay over-limits. The over-limit results for zinc and lead are reported in the table below (italicized) beside the original assay values. Assay values for tin, including high grade samples 11, 14 and 20 which were over-limit in the original assay report, are also presented in the last column of the table.
Sample Number
Sample Type
Silver g/t
Copper %
Zinc %
Lead %
Gold g/t
Tin ppm
ALC19CR01
grab
0
.035
0
0
0
0.4
ALC19CR02
grab
1300
.415
18.20
>20.0 (35.69)
0.70
46.1
ALC19CR03
grab
120
.232
.034
.984
0.02
2.4
ALC19CR04
grab
131
.089
.026
.102
2.66
1.1
ALC10CR05
grab
16.7
.295
.060
.013
0.09
0.4
ALC19CR06
grab
74.9
.144
>30.00 (34.97)
.059
0.28
2.6
ALC19CR07
grab
10.05
.310
.086
.029
0.04
0.5
ALC19CR08
grab
1870
.495
24.5
>20.0 (31.90)
1.85
189.5
ALC19CR09
grab
88.1
.077
>30.00 (39.98)
1.88
0.08
32
ALC19CR10
grab
1545
.178
26.7
>20.0 (28.67)
0.68
373
ALC19CR11
grab
2360
.366
16.80
>20.0 (43.67)
0.11
900
ALC19CR12
grab
3700
.624
1.645
>20.0 (71.14)
3.14
273
ALC19CR13
grab
964
.716
17.30
17.5
0.11
386
ALC19CR14
grab
3530
.350
1.945
>20.0 (59.54)
1.57
1600
ALC19CR15
grab
3670
.026
1.895
>20.0 (77.01)
0.33
205
ALC19CR16
grab
1790
.107
5.28
>20.0 (52.77)
0.37
146.5
ALC19CR17
grab
751
.069
6.45
18.05
0.45
107
ALC19CR18
grab
1065
.718
.178
.514
0.10
7.6
ALC19CR19
grab
2510
.299
5.58
>20.0 (70.63)
0.06
167
ALC19CR20
grab
4410
2.27
26.40
>20.0 (21.56)
5.68
4500
ALC19CR21
grab
47.5
.177
.048
.092
1.78
8.8
ALC19CR22
grab
87.7
.095
.011
.047
4.79
2.9
As
part of the fall 2019 program, a total of 1,846.35 meters of diamond
drilling was completed with 21 holes being drilled. The drilling was
divided over two target areas with 10 holes allocated to testing one of
the phyllite/limestone contacts in the ALLCO area and 11 preliminary
confirmation holes designed to begin testing the historic 1971 resource
(pre NI43-101 and therefore not compliant) reported for the
Regal/Snowflake mines.
The core samples have been submitted to
MSA Laboratories in Langley, BC and assay results are pending and will
be reported once received.
Property History & Background
The
Regal Project hosts several past producing small-scale historic mines
including the Regal Silver. The property also hosts numerous promising
mineral occurrences. From the historic records it appears that most, and
perhaps all, of the known mineralized showings/zones have not been
previously drilled using modern diamond drilling methods.
Snowflake and Regal Silver (Stannex/Woolsey) Mines
The
Snowflake and Regal Silver mines were two former producing mines that
operated intermittently during the period 1936-1953. The last
significant work on the property took place from 1967-1970, when Stannex
Minerals completed 2,450 meters of underground development work and a
feasibility study but did not restart mining operations. In 1982,
reported reserves were 590,703 tonnes grading 71.6 grams per tonne
silver, 2.66 per cent lead, 1.26 per cent zinc, 1.1 per cent copper,
0.13 per cent tin and 0.015 per cent tungsten (Minfile No. 082N 004 –
Prospectus, Gunsteel Resources Inc., April 29, 1986). It should be noted
that the above resource and grades, although believed to be reliable,
were prepared prior to the adoption of NI43-101 and are not compliant
with current standards set out therein for calculating mineral resources
or reserves.
ALLCO Silver Mine
The ALLCO Silver Mine
is situated 6.35 Kilometers northwest of the above described
Snowflake/Regal Mine(s). The ALLCO Silver Mine operated from 1936-1937
and produced 213 tonnes of concentrates containing 11 troy ounces of
gold (1.55 g/t), 11,211 troy ounces of silver (1,637 g/t) and 173,159
lbs of lead (36.9%).
Airborne Geophysics to Guide Future Exploration
An
extensive airborne geophysics survey conducted by Geotech Ltd of
Aurora, Ontario, for Northaven Resources Corp. in 2011, identified four
well defined high potential linear targets correlating with the same
structural orientation as the Allco, Snowflake and Regal Silver mines.
Northaven also reported that the mineralogy and structural orientation
of the Allco, Snowflake and Regal Silver appeared to be similar to that
of Huakan’s J&L gold project located to the north, and on a similar
geophysical trend line. The J&L is reportedly now one of western
Canada’s largest undeveloped gold deposits.
After completing the
airborne survey, Northaven failed in financing their company and
conducting further exploration on the property and subsequently
forfeited the claims without any of the follow up work ever being
completed. Affinity Metals is in the fortunate position of benefitting
from this significant and promising geophysics data and associated
targets.
The aforementioned Northaven airborne geophysical survey
conducted at a cost of $319,458.95 in August of 2011 is described in The
BC Ministry of Energy, Mines and Petroleum Resources Assessment Report
#33054. The results of the survey are competently explained and
illustrated by professionals on You Tube at: https://www.youtube.com/watch?v=GX431eBY_t0
Condor
Consulting, Inc. who compiled the survey data and produced the original
geophysics report was recently retained by Affinity in order to provide
more detailed interpretations and potential drill target locations with
the aim of testing two of the four target areas in the future.
Earth Sciences Services Corp. (ESSCO) has also provided acoustical geophysics data for portions of the Regal property.
The
Corporation is in the process of correlating and interpreting all of
the historic and new geophysical data with the objective of further
advancing exploration plans and associated drill targets.
Affinity
Metals has been granted a 5 Year Multi-Year-Area-Based (MYAB)
exploration permit which includes approval for 51 drill sites.
Qualified Person
The
qualified person for the Regal Project for the purposes of National
Instrument 43-101 is Frank O’Grady, P.Eng. He has read and approved the
scientific and technical information that forms the basis for the
disclosure contained in this news release.
About Affinity Metals
Affinity Metals is focused on the acquisition, exploration and development of strategic metal deposits within North America.
The Corporation’s flagship project and present focus is the Regal.
On behalf of the Board of Directors
Robert Edwards, CEO and Director of Affinity Metals Corp.
Posted by AGORACOM
at 3:57 PM on Tuesday, January 14th, 2020
Sponsor: Affinity Metals (TSX-V: AFF) a Canadian mineral exploration
company building a strong portfolio of mineral projects in North
America. The Corporation’s flagship property is the Drill ready Regal
Property near Revelstoke, BC. Recent sampling encountered bonanza grade
silver, zinc, and lead with many samples reaching assay over-limits.
Further assaying of over-limits has been initiated, results will be
reported once received. Click Here for More Info
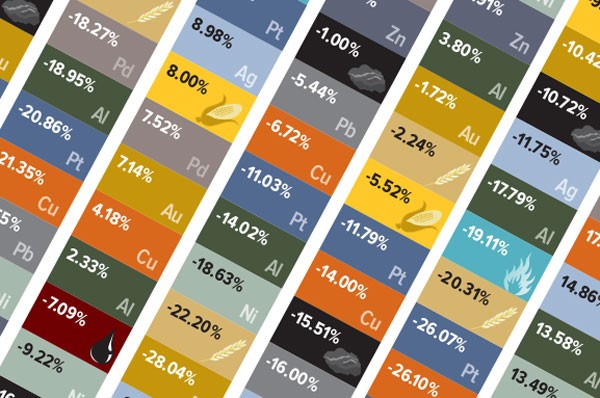
Near
the start of every year, I share our ever-popular Periodic Table of
Commodity Returns, now updated to reflect the final results of 2019. To
view the interactive table and download a copy of your own, click here.
Having
broken above $2,000 an ounce last week, palladium in now forecast by
Citi analysts to hit $2,500 by the middle of this year.
Commodities
as a whole had a mostly positive 2019, returning 16.53 percent as
measured by the S&P GSCI. This far surpasses commodities’ five-year
average return of about negative 11.52 percent, between 2014 and 2018.
Precious
metals were responsible for much of the growth. For the third straight
year, and for the fourth time in six years, palladium was the
top-performing commodity. The metal, used widely in the production of
catalytic converters, increased an incredible 54.21 percent to end 2019
at $1,912 an ounce, a slightly higher price than gold’s all-time high
set in September 2011.
As
was the case in past years, palladium benefited from mounting global
demand to curb emissions from gasoline-burning engines. It’s also among
the world’s scarcest precious metals, mined primarily in Russia and
South Africa, which means supply will potentially remain in deficit for
years to come.
Having
broken above $2,000 an ounce last week, palladium in now forecast by
Citi analysts to hit $2,500 by the middle of this year.
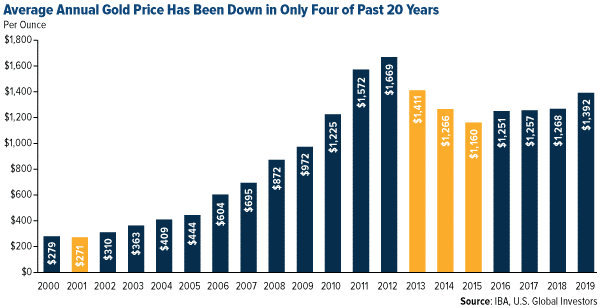
Gold Price Up in Four out of Every Five Years
Gold,
meanwhile, had its best year since 2010, climbing as much as 18.31
percent. The yellow metal’s role as an exceptional store of value shined
brightly in the second half of the year when the pool of negative-yielding debt
around the world began to skyrocket, eventually topping out at around
$17 trillion in August. On the news last week that Iran launched a
counterstrike against U.S.-occupied military bases in Iraq, the safe
haven briefly broke above $1,600 an ounce for the first time since April
2013.
In
the past two decades, gold has helped investors limit market volatility
and portfolio losses. Between 2000 and 2019, the precious metal’s
average annual price was down in only four years. Put another way, gold
was up on average in four out of every five years—a remarkable track
record.
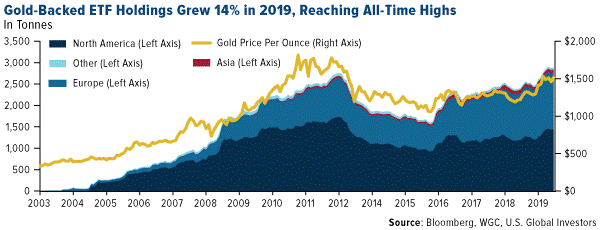
Safe
haven-seeking investors around the world piled into gold-backed ETFs in
2019, making it the best year on record for gold holdings. Assets under
management (AUM) in gold bullion ETFs expanded 37 percent from the
previous year, adding $19.2 billion, or 400 tonnes, according to the World Gold Council (WGC).
During the fourth quarter, total holdings hit a jaw-dropping 2,900
tonnes, the equivalent of 102 million ounces, which is the most on
record.
As
of the end of last week, gold looked slightly overbought on a relative
strength basis, meaning a correction wouldn’t be such a bad thing and in
fact expected.
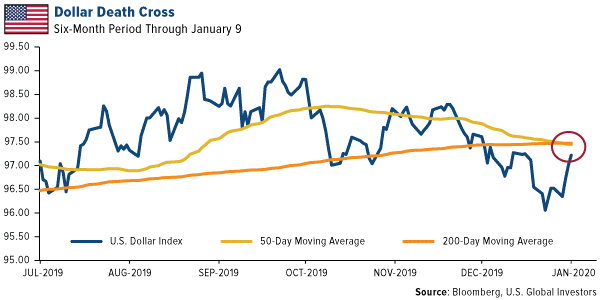
Has the Greenback Peaked?
Short
of escalating tensions in the Middle East or a pullback in stocks, the
catalyst for higher gold prices—and, indeed, commodity prices in
general—may very well be a substantial weakening of the U.S. dollar. On
Tuesday, the U.S. Dollar Index experienced a “death cross,†a bearish
signal that takes places when an asset’s 50-day moving average crosses
below its 200-day moving average. We haven’t seen this from the
greenback since May 2017.
Other
firms and analysts have recently made the case that the dollar is ready
to decline in 2020, which would give gold and other hard assets the
room to gain momentum. Below are just three such forecasts from the past
couple of weeks:
“Our
view is that the dollar is ready to decline in 2020 and will be
encouraged to do so as negative interest rates abroad turn less negative
while the Fed holds pat (or cuts)… In the event of an unlikely
recession in 2020, U.S. fiscal and monetary policy will turn sharply
expansionary, the dollar will decline further, and gold will do well.â€
~Murenbeeld & Co., January 3
“We
expect that U.S. dollar weakness will likely characterize global
financial markets throughout 2020… A weaker dollar is always good news
for commodity prices. We are particularly bullish gold at this point.
Gold is a direct play on a weaker dollar and could also benefit from any
major flare-up in geopolitical tensions.â€
~Alpine Macro, January 6
“Starting
2020, the key setup from a macro perspective is the confirmed top in
the U.S. Dollar Index as well as the U.S. Trade-Weighted Broad Dollar
Index… The U.S. Dollar Index (DXY) has broken below the 97 support to
trigger the bearish implication of the June-December topping pattern
(head-and-shoulders top) and the U.S. Trade-Weighted Broad Dollar Index
has broken below the early-November 2019 low as well as the 200-day
moving average to confirm a similar topping pattern to the DXY.â€
~CLSA, January 7
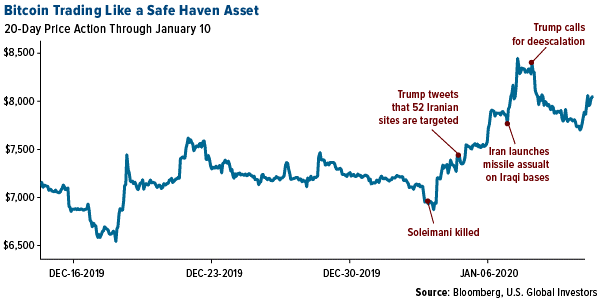
Bitcoin as a Safe Haven Asset
Gold
isn’t the only asset that responded positively to geopolitical
uncertainty involving Iran. The price of bitcoin, the world’s largest
cryptocurrency by market cap, surged on the news that President Donald
Trump had ordered a strike on Iranian general Qasem Soleimani, before
commenting that the U.S. was targeting as many as 52 sites in Iran.
From
January 2, the day before the strike, to January 8, when Trump
announced that Iran appeared to be “standing down,†bitcoin traded up as
much as 21 percent to its highest level in six weeks. In addition,
there were reports that local bitcoin sellers in Iran were charging three times the market rate in response to the threat of war with the U.S.
Google searches for “bitcoin†were also up. Cointelegraph reports that the search term “bitcoin Iran†exploded more than 4,450 percent in the seven days through January 8.
All
of this tells me that bitcoin continues to mature as an asset, and that
investors and savers increasingly trust it as a store of value in times
of uncertainty.
Looking for the inside scoop on mining companies? Click here
to read U.S. Global Investors portfolio manager Ralph Aldis’ interview
with MoneyShow and get his favorite mining picks for 2020!
Posted by AGORACOM
at 2:39 PM on Wednesday, January 8th, 2020
Sponsor: Affinity Metals (TSX-V: AFF) a Canadian mineral exploration
company building a strong portfolio of mineral projects in North
America. The Corporation’s flagship property is the Drill ready Regal
Property near Revelstoke, BC. Recent sampling encountered bonanza grade
silver, zinc, and lead with many samples reaching assay over-limits.
Further assaying of over-limits has been initiated, results will be
reported once received. Click Here for More Info
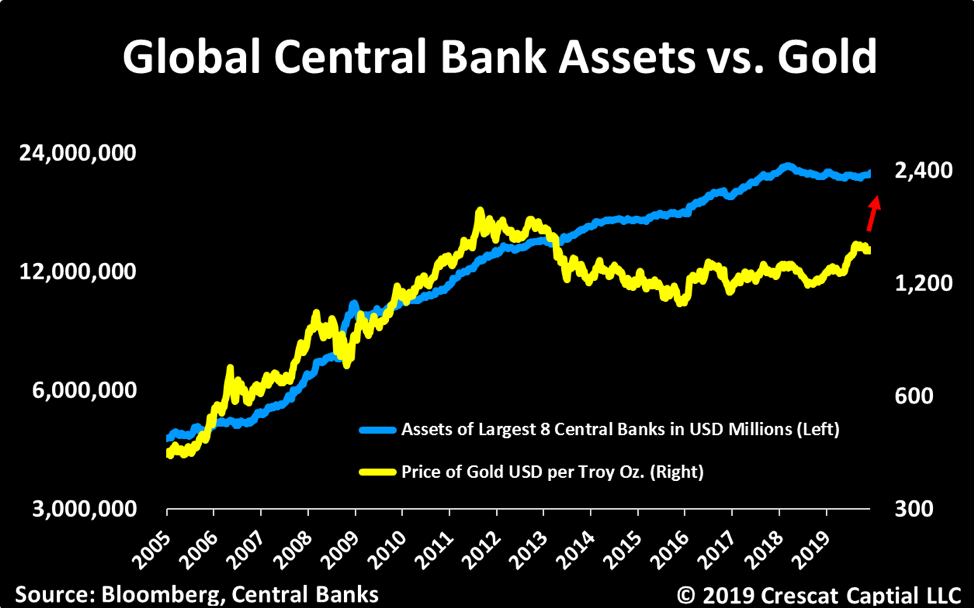
Excerpts from Crescat Capitals November Newsletter:
Precious Metals
Precious metals are poised to benefit from what we consider to be the best macro set up we’ve seen in our careers. The stars are all aligning. We believe strongly that this time monetary policy will come at a cost. Look in the chart below at how the new wave of global money printing just initiated by the Fed in response to the Treasury market funding crisis is highly likely to pull depressed gold prices up with it.
The gold and silver mining industry endured a severe bear market from 2011 to 2015 and have formed a strong base over the last four years.
The imbalance between historically depressed commodity prices
relative to record overvalued US stocks remains at the core of our macro
views. On the long side, we believe strongly commodities offer
tremendous upside potential on many fronts. Precious metals remain our
favorite. We view gold as the ultimate haven asset to likely outperform
in an environment of either a downturn in the business cycle, rising
global currency wars, implosion of fiat currencies backed by record
indebted government, or even a full-blown inflationary set up. These
scenarios are all possible. Our base case is that governments and
central banks will keep their pedals to the metal to attempt to fend off
credit implosion or to mop up after one has already occurred until
inflation becomes a persistent problem.
The gold and silver mining industry is precisely where we see one of
the greatest ways to express this investment thesis. These stocks have
been in a severe bear market from 2011 to 2015 and have been formed a
strong base over the last four years. They are offer and incredibly
attractive deep-value opportunity and appear to be just starting to
break out this year. We have done a deep dive in this sector and met
with over 40 different management teams this year. Combining that work
with our proprietary equity models, we are finding some of the greatest
free-cash-flow growth and value opportunities in the market today
unrivaled by any other industry. We have also found undervalued
high-quality exploration assets that will make excellent buyout
candidates.
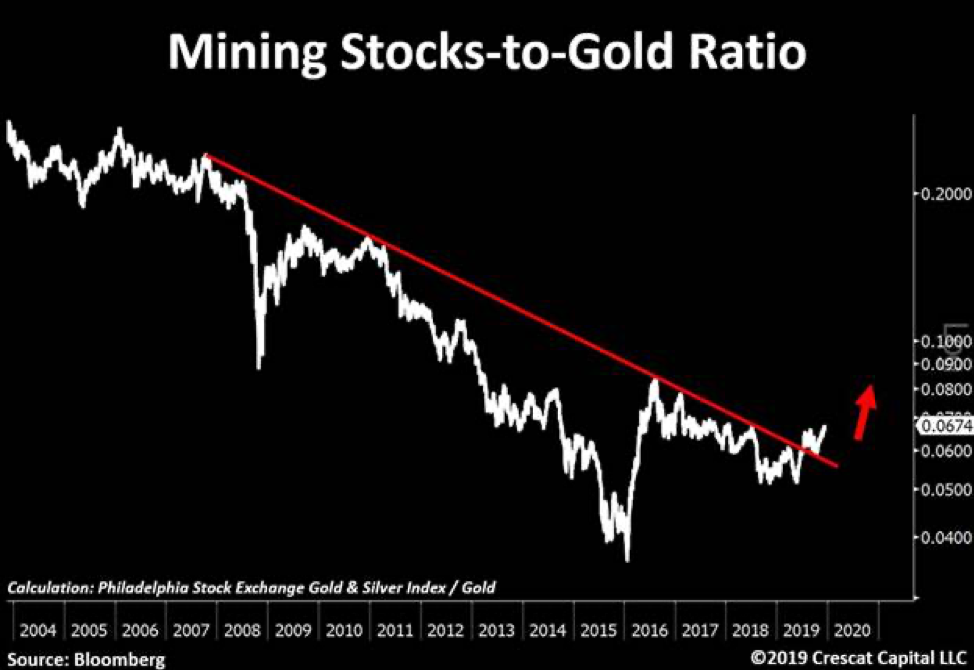
We recently point out this 12-year breakout in mining stocks relative
to gold now looks as solid as a rock. In our view, this is just the
beginning of a major bull market for this entire industry. We encourage
investors to consider our new Crescat Precious Metals SMA strategy which
is performing extremely well this year.
“This is just the beginning of a major bull market for this entire industry”
Zero Discounting for Inflation Risk Today
With historic Federal debt relative to GDP and large deficits into
the future as far as the eye can see, if the global financial markets
cannot absorb the increase in Treasury debt, the Fed will be forced to
monetize it even more. The problem is that the Fed’s panic money
printing at this point in the economic cycle may hasten the unwinding of
the imbalances it is so desperate to maintain because it has perversely
fed the last-gasp melt up of speculation in already record over-valued
and extended equity and corporate credit markets. It is reminiscent of
when the Fed injected emergency cash into the repo market at the peak of
the tech bubble at the end of 1999 to fend off a potential Y2K computer
glitch that led to that market and business cycle top. After 40
years of declining inflation expectations in the US, there is a major
disconnect today between portfolio positioning, valuation, and economic
reality. Too much of the investment world is long the “risk parityâ€
trade to one degree or another, long stocks paired with leveraged long
bonds, a strategy that has back-tested great over the last 40 years, but
one that would be a disaster in a secular rising inflation environment.
With historic Federal debt relative to GDP and large deficits into
the future as far as the eye can see, rising long-term inflation, and
the hidden tax thereon, is the default, bi-partisan plan for the US
government’s future funding regardless of who is in the White House and
Congress after the 2020 elections. The market could start discounting
this sooner rather than later. The Fed’s excessive money printing
may only reinforce the unraveling of financial asset imbalances today as
it leads to rising inflation expectations and thereby a sell-off in
today’s highly over-valued long duration assets including Treasury bonds
and US equities, particularly insanely overvalued growth stocks. We
believe we are in the vicinity of a major US stock market and business
cycle peak.
Source:”Running Hot”
Courtesy of Crescat Capital: https://www.crescat.net/running-hot/
Posted by AGORACOM
at 1:21 PM on Friday, January 3rd, 2020
Sponsor: Affinity Metals (TSX-V: AFF) a Canadian mineral exploration company building a strong portfolio of mineral projects in North America. The Corporation’s flagship property is the Drill ready Regal Property near Revelstoke, BC. Recent sampling encountered bonanza grade silver, zinc, and lead with many samples reaching assay over-limits. Further assaying of over-limits has been initiated, results will be reported once received. Click Here for More Info
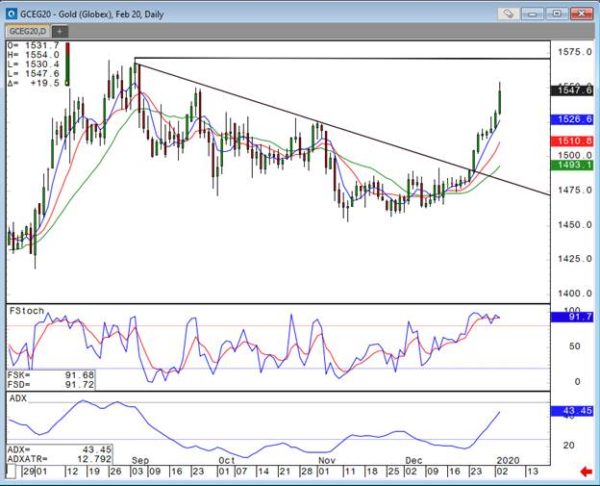
With an impressive start to the year this new heightened geopolitical development could be the catalyst to break out gold to multi year highs. The U.S. strike that killed a key Iranian general could have a ripple effect on the signing of the trade agreement on the 15th as China and Iran have recently worked together on joint military operations along with Russia. Any set back in the trade agreement would severely impact the direction of U.S. equities and the expectations for interest rate decisions globally. Price Analysis and Outlook The daily gold chart shows that momentum indicator slow stochastics are rising steadily and reaching overbought territory giving longer term indication that we have pushed into a Bull Market. While ADX, which measures strength of the trend, has turned up over 40 showing that the driving force behind the recent upward move is very strong. The 2 key levels of support to watch are the November 1st high of $1525.2 and the December 30th high of $1519.1. This should act as a consolidation level while a likely upside target completing this trend would be an objective of $1572
Posted by AGORACOM
at 11:45 AM on Wednesday, December 18th, 2019
Sponsor: Affinity Metals (TSX-V: AFF) a Canadian mineral exploration company building a strong portfolio of mineral projects in North America. The Corporation’s flagship property is the Drill ready Regal Property near Revelstoke, BC. Recent sampling encountered bonanza grade silver, zinc, and lead with many samples reaching assay over-limits. Further assaying of over-limits has been initiated, results will be reported once received. Click Here for More Info
Central bankers have been voracious buyers of gold during the last two years, and analysts look for that trend to continue in 2020.
Through the end of October, net official-sector purchases this year
totaled 562 metric tons, reported Alistair Hewitt, director of market
intelligence with the World Gold Council. That 56.2-tons-a-month average
puts sales on pace to roughly match the 656 tons bought in 2018, which
were the most central-bank purchases since 1967, according to WGC data.
“This year has been exceptionally strong. We think that next year,
net buying will continue at a high level, even if it’s not as high as
this year,†said Philip Newman, director of the London-based consultancy
Metals Focus.
Goldman Sachs looks for global central banks to collectively acquire
around 650 tons in 2020, while Standard Chartered is projecting
central-bank purchases will total 525 tons.
“It’s still elevated,†said Suki Cooper, precious-metals analyst with
Standard Chartered. “That is still firmly on the buy side.â€
‘Safe, liquid and generates returns’
Hewitt commented that central banks are looking at three main
criteria when deciding to expand the amount of gold they hold within
their foreign-exchange reserves.
“For a central bank, gold is a fantastic asset because it’s safe, liquid and generates returns over the long term,†Hewitt said.
He also listed two more factors why the central-bank buying has suddenly jumped in recent years.
“One issue is we are seeing heightened geopolitical tensions,†Hewitt
said, with these involving major gold-buying countries and economies.
“Central banks are looking toward gold to balance some of that risk.
“We’ve also got negative rates and yields for a large number of sovereign bonds.â€
Newman added that many central banks are “trying to get away†from
the U.S. dollar. This is especially the case with Russia due to U.S.
sanctions, he added.
As recently as 2017, most of the official-sector buying came from a
handful of central banks, including Russia, Turkey and Kazakhstan. But
in 2018 and 2019, there have been a slew, including some that had not
been in the market for years.
“You’ve got a whole range of buyers,†Newman said.
The largest buyers during the first 10 months of the year were Turkey
with 144.8 tons; Russia, 139; Poland, 100; and China, 95.8.
Others include Kazakhstan, 26.9 tons; India, 17.7; Qatar, 11; Ecuador, 10.6; Serbia and the U.K., 9.9; Argentina, 7; Colombia, 6.1; Kyrgyz Republic, 3.2; Mongolia, 2.3; Belarus, 1.9; Guinea, 0.9; Egypt and Mauritania, 0.7; Albania and Malta, 0.6; and Ukraine and Greece, 0.3.
Goldman Sachs projected that central-bank purchases could amount to as much as 22% of global supplies during 2019.
Central banks ‘buy for an extended period’
Hewitt looks for official-sector buying momentum to continue.
Central banks tend to put a lot of thought into decisions to buy –
with a long, rigorous policy-making process — and purchase the metal
for strategic reasons, rather than simply reacting to day-to-day moves
in the price, Hewitt said.
“Once these people start buying, they continue to buy for an extended
period of time,†Hewitt said. For instance, he pointed out that
Kazakhstan has been a regular gold buyer since 2010.
“Both trade tensions and negative yields are still here,†Hewitt
said. “They may rear their ugly heads again and become more pronounced,
or they may fade away and become less pronounced. But those underlying
forces will remain ever present in the market. Certainly in the next
year or so, those two factors should continue to support and underpin
central-bank demand for gold.â€
Observers pointed out that not only have central-bank gold purchases
been strong, but sales have been light. Back in 1999, when European
central banks were selling the metal, they began following central-bank
sales agreements to try to limit how much was sold in any one year and
thereby keep this from being a destabilizing force in the gold market.
These agreements have been discontinued, Hewitt noted. Commerzbank
analysts pointed out they were no longer necessary since hardly any
European central banks are selling anyway. Germany’s central bank sells a
modest amount each year only for its coin-minting program, Hewitt said.
“The market was not bothered by the central-bank gold agreement
coming to an end, partly because the gold market is very different from
what it was in 1999,†Hewitt said, adding that there “dramatic sellingâ€
back then.
“The gold market today is just more diverse, more resilient and more
liquid. That’s why the market just shrugged its shoulder when the
central-bank gold agreement came to an end.â€
Further, analysts at Commerzbank, in their 2020 outlook, commented
that one or more Western European central banks might even enter the
market as a gold buyer.
“One possible candidate is the Dutch central bank (DNB), which in
October published a remarkable statement about the role of gold on its
website,†Commerzbank said. “In it, it described gold as an anchor of
trust for the financial system. According to the DNB, gold reserves
could serve as the basis for a new beginning in the event of a system
collapse.
“If one or more Western central banks indeed started to actively buy
gold, this would attract considerable attention and spark market
reactions.â€
Posted by AGORACOM
at 6:41 PM on Monday, December 9th, 2019
Sponsor: Affinity Metals (TSX-V: AFF) a Canadian mineral exploration company building a strong portfolio of mineral projects in North America. The Corporation’s flagship property is the Drill ready Regal Property near Revelstoke, BC. Recent sampling encountered bonanza grade silver, zinc, and lead with many samples reaching assay over-limits. Further assaying of over-limits has been initiated, results will be reported once received. Click Here for More Info