Agoracom Blog Home

Archive for the ‘Loncor’ Category

The DRC Should Become the Largest Mining Economy in Africa SPONSOR: Loncor Resources $LN.ca $ABX.ca $TECK.ca $RSG $NGT.to $GOLD $NEM

Posted by AGORACOM at 10:07 AM on Wednesday, April 29th, 2020

Sponsor: Loncor, a Canadian gold explorer controlling over 3.6 million high grade ounces outside of a Barrick JV. The Ngayu JV property is 200km southwest of the Kibali gold mine, operated by Barrick, which produced 814,000 ounces of gold in 2019. Barrick manages and funds exploration at the Ngayu project until the completion of a pre-feasibility study on any gold discovery meeting their Tier One investment criteria. Newmont $NGT $NEM owns 7.8%, Resolute $RSG owns 27% Management owns 29% Click Here for More Info

This image has an empty alt attribute; its file name is Loncor-Small-Square.png
https://d3gvybjp3zjp3i.cloudfront.net/wp-content/uploads/2020/04/drc-money-new-640x480.jpg

“Investment appetite in the resources sector is low and investment hurdles have been raised which means that only the best investment jurisdictions, like the Democratic Republic of Congo, will receive much needed investment for growth.”

This is according to Dr Tony Harwood, president and CEO of Montero Mining and Exploration.

“The slow-down in the global economy has depressed metal prices and the advent of the Coronavirus (COVID-19) has also exacerbated this, bringing many countries into a negative growth and some in recession,” Dr Harwood, who is also an ambassador for DRC Mining Week, continues.

In addition, the implementation of the new DRC mining legislation has caused concerns with existing investors and potentially new foreign investors to the DRC.

Despite these challenges progress made on some very exciting mining and exploration projects, notably developments of the world class Kamoa-Kakula copper project and Kipushi zinc project, notes Harwood.

“Other highlights for the DRC include the development of the high grade Bisie Tin project as well as seeing gold production being achieved at Kibali gold mine,” Harwood points out.

Positive approach needed

In addressing the challenges surrounding the country’s divisive mining legislation Harwood encourages current investors to discuss changes in a positive manner with government for an equally equitable solution for both parties.

Harwood believes the development of the Kamoa-Kakula copper project will open the Katanga province and encourage further exploration and development not only in this area but the country as well.

“Its success will aid greatly in the development of the DRC mining sector not only from a production perspective but also by increasing employment, skills transfers, taxes paid, infrastructure development both in the DRC and in neighbouring countries,” states Harwood.

Looking to the future Harwood is adamant good mining legislation with investor incentives will boost local capital and entice foreign investors will ensure growth and if the DRC gets this right it will become the largest mining economy in Africa.

Harwood founded and listed the company on the TSX Venture exchange. He is also a non-executive director of private and public companies largely operating in Africa. In all he has listed three companies over the last 10 years all of which operate in Africa from a base in Africa.

Between 2006 and 2009 he was the President and CEO of Africo Resources, a company attempting to develop a high-grade coper project in Katanga.

During the exploration and development period the company entered various cooperative community development programmes with local villages surrounding the project.

These programmes largely revolved around agriculture and the company assisted in setting up community co-operatives for growing vegetables to be sold to the company and the surrounding communities. “In addition, we also set up health screening initiatives with the DRC health administration in and around our project area,” explains Harwood.

“In 2007 to 2008 we also distributed 328 wheelchairs for children. These had been designed for use in the country and had thick rubber tyres – this brought children a new mobility and enabled them to get to school and participate in their communities,” he concludes.

Source: https://www.miningreview.com/base-metals/the-drc-should-become-the-largest-mining-economy-in-africa/

CLIENT FEATURE: Loncor Resources $LN.ca 3.6 Million High Grade Gold Ounces in the DRC $ABX.ca $TECK.ca $RSG $NGT.to $GOLD $NEM

Posted by AGORACOM at 12:45 PM on Monday, April 27th, 2020
http://blog.agoracom.com/wp-content/uploads/2019/11/Loncor-Small-Square.png

LN:TSX

3.6 Million High Grade Gold Ounces in the Congo

Imbo Concession: Loncor controls 76.29% of the Imbo Project.

3 Seperate Deposits:

  • Adumbi, Kitenge and Manzako comprise 2.5 million ounces of gold
  • 30.65 million tonnes grading 2.54 g/t Au
  • 76.29% of the gold resource is attributable to Loncor via its 76.29% interest in the Imbo Project.

2020 Exploration Strategy:

  • Increase the mineral resources on the Imbo Project by undertaking additional drilling
  • Initiate Preliminary Economic Assessment on the Adumbi deposit.  
    • Increase and upgrade mineral resources within the open pit
    • Develop underground potential, mineralization remains open at depth

Makapela Project, NGAYU Belt: (100% Loncor Owned)

  • Indicated mineral resource of 614,200 ounces of gold
    • (2.20 million tonnes grading 8.66 g/t Au)
  •  Inferred mineral resource of 549,600 ounces of gold
    • (3.22 million tonnes grading 5.30 g/t Au).

Barrick JV in the NGAYU Belt:

  • Ngayu Belt is 200km southwest of the Kibali gold mine, operated by Barrick Gold
    • Kibali produced 814,000 ounces at “all-in sustaining costs” of US$693/oz 2019 
    • Barrick highlighted the Ngayu Greenstone Belt an area of particular exploration interest
    • Barrick earns 65% of any exploration discovery in 1,894 km2 of Loncor ground in the JV.
  • Barrick manages and funds exploration until the completion of a pre-feasibility study on any gold discovery meeting the investment criteria of Barrick.

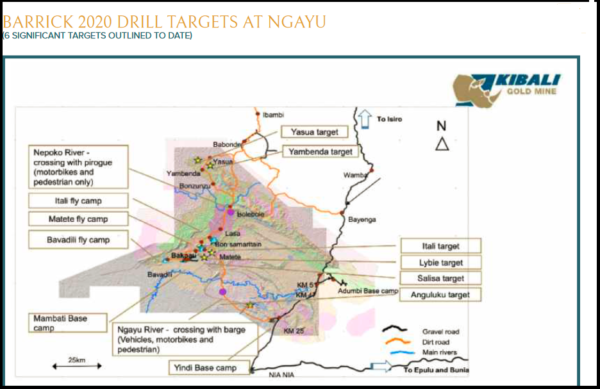
Barrick highlighted 6 signifcant drill targets and is moving toward drilling in 2020

Loncor Resources Inc.

Loncor a Canadian gold explorer controlling over 3.6 million high grade ounces outside of a Barrick JV in the DRC. The Ngayu JV property is 200km southwest of the Kibali gold mine, operated by Barrick, which produced 814,000 ounces of gold in 2019. Barrick manages and funds exploration at the Ngayu project until the completion of a pre-feasibility study on any gold discovery meeting their Tier One investment criteria. Newmont $NGT $NEM owns 7.8%, Resolute $RSG owns 27%, Loncor Management owns 29%

Loncor Hub on Agoracom

Ronald Peter Stöferle: Black Swans, Grey Rhinos and Golden Bulls – World Gold Forum 2020 – SPONSOR: Loncor Resources $LN.ca $ABX.ca $TECK.ca $RSG $NGT.to $GOLD $NEM

Posted by AGORACOM at 11:08 AM on Thursday, April 23rd, 2020

Sponsor: Loncor, a Canadian gold explorer controlling over 2,400,000 high grade ounces outside of a Barrick JV. The Ngayu JV property is 200km southwest of the Kibali gold mine, operated by Barrick, which produced 800,000 ounces of gold in 2018. Barrick manages and funds exploration at the Ngayu project until the completion of a pre-feasibility study on any gold discovery meeting their Tier One investment criteria. Newmont $NGT $NEM owns 7.8%, Resolute $RSG owns 27% Click Here for More Info

This image has an empty alt attribute; its file name is Loncor-Small-Square.png

Ronald Peter Stöferle’s keynote speech at this year’s virtual World Gold Forum 2020.

Unlimited quantitative easing and fiscal stimulation. Central banks and governments are on the test bench. Learn why this is the perfect breeding ground for gold, commodities and mining stocks.

A golden future lies ahead!

Topics: Black Swan or Grey Rhino?

In recent weeks, the news filled with Corona, experts and governments have been throwing around the term Black Swan. The Black Swan is a metaphor that describes an unpredictable, rare event that causes great harm. Ronald Stöferle, on the other hand, is of the opinion that the corona virus is more like a grey rhinoceros. A rare but highly probable but neglected event.

Central banks and governments under scrutiny We are in the process of making history. Never before has there been a crisis in which so many monetary and fiscal interventions by central banks and governments have been made in such a short time. Ronald postulates that the central banks, as they have already announced, will do everything possible to prevent deflation. The markets and the population should therefore be prepared for anything. From unlimited quantitative easing, to ideas like the universal basic income.

Gold on the rise again. There is a general change on the markets. Gold has reappeared on the scene. Ronald shows how gold has done exactly what it is supposed to do. Stabilize your portfolio and protect your assets from a drastic decline in stock values. He also postulates that the gold price has already reached its lowest point. Inflation or Stagflation Even if it was in fashion to declare inflation dead, it seems to be returning. Ronald explains that our in-house inflation indicator shows that inflation could be about to make a comeback. The markets are unlikely to feel this until the curfew is lifted and there is suddenly much more money in the system.

Gold stocks back in the bull market The comparison between the Great Depression and now does not seem to limp. Ronald postulates a good environment for gold mining stocks, as was the case during the Great Depression. The Golden Future Gold has returned to the public eye. We are currently in the public participation phase.

As Ronald explains that current climate, both by the massive interventions and the general crisis, are the perfect breeding ground for gold and commodities in general.

Time stamp: 2:40

Agenda 3:30

The black swan, which is none 8:54

(When) Will confidence in central banks begin to erode 15:26

Gold: What the 7th sense of the financial market has to tell us 20:55

Inflation and Stagflation – The Ultimate Craft of Pain 27:08

Gold mining shares 29:31

The golden future 36:45

Follow us on Twitter: https://twitter.com/IGWTreport

Homepage link: https://www.incrementum.li/en/

Bank of America Calling for $3,000 Gold in 18 Months SPONSOR: Loncor Resources $LN.ca $ABX.ca $TECK.ca $RSG $NGT.to $GOLD $NEM

Posted by AGORACOM at 8:52 AM on Wednesday, April 22nd, 2020

Sponsor: Loncor, a Canadian gold explorer controlling over 2,400,000 high grade ounces outside of a Barrick JV. The Ngayu JV property is 200km southwest of the Kibali gold mine, operated by Barrick, which produced 800,000 ounces of gold in 2018. Barrick manages and funds exploration at the Ngayu project until the completion of a pre-feasibility study on any gold discovery meeting their Tier One investment criteria. Newmont $NGT $NEM owns 7.8%, Resolute $RSG owns 27% Click Here for More Info

This image has an empty alt attribute; its file name is Loncor-Small-Square.png
  • The analysts noted that the Federal Reserve: “Can’t print gold.”

(Kitco News) – Bank of America commodity analysts just keep getting more bullish on gold as the weeks go by.

The bank said in a report last week that gold ’s technical momentum could drive prices to an all-time high this year; in a new report published Tuesday, analysts have officially increased their bullish outlook, saying that gold prices could hit $3,000 within 18 months, a 50% increase from its previous forecast

Along with increasing its 18-month target, the bank said that it sees gold prices averaging $2,063 an ounce in 2021.

“As economic output contracts sharply, fiscal outlays surge, and central bank balance sheets double, fiat currencies could come under pressure. And investors will aim for gold,” the analysts said.

Although a strong U.S. dollar and weak physical jewelry demand in Asia could be headwinds for the gold market, the analysts said that the Federal Reserve has provided enough momentum to propel investment demand and prices higher.

Economists at Bank of America have warned that the Federal Reserve’s balance sheet as a percentage of GDP could rise 20% to 40% this year. According to reports last week, the Federal Reserve’s balance sheet hit a record high of $6.42 trillion, up more than 50% from levels reported during the first week of March.

The analysts noted that the Federal Reserve: “Can’t print gold.”

“Beyond traditional gold supply and demand fundamentals, financial repression is back on an extraordinary scale. Rates in the US and most G-10 economies will likely be at or below zero for a very long period of time as central banks attempt to push inflation back above their targets,” the analysts said.

Although investor sentiment has improved slightly during the last few weeks, the bank’s analysts said that there is still more bad news ahead. They noted that economists are forecasting a 30% decline in the U.S. GDP in the second quarter as the economy was grounded after all non-essential businesses were closed and citizens were requested to stay at home.

“As central banks rush to expand their balance sheets and backstop the economy, a lot of risks could effectively be socialized, boosting the appeal of gold,” the analysts said.

Weak economic growth does not bode well for equity markets, the analysts said, adding that this will be another factor supporting higher gold prices.

“The positive equity/gold correlations are a possible sign that equity markets may not have fully bottomed and that the gold market has further room to run, in our view. The trigger here could be an extension of lockdown restrictions over the next few weeks,” the analysts said.

Despite the strong bullish sentiment, Bank of America does see some risks in the marketplace. Along with weak physical demand, the analysts said that central bank gold purchases are expected to slow this year.

They also noted that lower market volatility could also weigh on gold prices.

Source:https://www.kitco.com/news/2020-04-21/Bank-of-America-calling-for-3-000-gold-in-18-months.html

Loncor $LN.ca Increases Mineral Resources By 49% To 2.5 Million Ounces At Its Imbo Project In The Ngayu Greenstone Belt, D.R. $ABX.ca $TECK.ca $RSG $NGT.to $GOLD $NEM

Posted by AGORACOM at 8:41 AM on Friday, April 17th, 2020
This image has an empty alt attribute; its file name is Loncor-Small-Square.png
  • Compared to the inferred mineral resources of 1.675 million ounces of gold (20.78 million tonnes grading 2.5 g/t Au) outlined in January 2014
  • On three separate deposits, Adumbi, Kitenge and Manzako at Imbo, inferred mineral resources have now increased by 49% to 2.5 million ounces of gold (30.65 million tonnes grading 2.54 g/t Au)
  • Total mineral resources at Loncor’s properties in the Ngayu belt now stand at 3.05 million ounces of inferred mineral resources

TORONTO, April 17, 2020 (GLOBE NEWSWIRE) — Loncor Resources Inc. (“Loncor” or the “Company“) (TSX: “LN”; OTCQB: “LONCF”) is pleased to announce a 49% increase in mineral resources at its Imbo Project (Loncor 76.29%) in the D.R. Congo.

Compared to the inferred mineral resources of 1.675 million ounces of gold (20.78 million tonnes grading 2.5 g/t Au) outlined in January 2014 by independent consultants Roscoe Postle Associates Inc. (“RPA”) on three separate deposits, Adumbi, Kitenge and Manzako at Imbo, inferred mineral resources have now increased by 49% to 2.5 million ounces of gold (30.65 million tonnes grading 2.54 g/t Au), this increase coming from the Adumbi deposit.  This assessment was undertaken by the Company’s independent geological consultants Minecon Resources and Services Limited (“Minecon”). The updated estimate for Adumbi was based on a review of the Adumbi deposit including remodelling, grade capping and considering the CIM requirement for mineral resources to have “reasonable prospects for economic extraction”. 76.29% of this updated gold resource is attributable to Loncor via its 76.29% interest in the Imbo Project.

Combined with the Company’s Makapela Project (100%) (see Figure 1), total mineral resources at Loncor’s properties in the Ngayu belt now stand at 3.05 million ounces of inferred mineral resources (33.87 million tonnes grading 2.80 g/t Au) plus 0.614 million ounces of indicated mineral resources (2.205 million tonnes grading 8.66 g/t Au ). 

Commenting on today’s inferred mineral resource increase on the Imbo Project, Loncor’s President Peter Cowley said: “We are very encouraged by the significant increase in mineral resources at the Adumbi deposit, which was developed from exploration conducted during the period 2014-17, following on from the recommendations from the independent RPA study in 2014.  We now have a clear strategy going forward to increase the mineral resources on the Imbo Project by undertaking additional drilling and advancing the project up the value curve by initiating a Preliminary Economic Assessment on the Adumbi deposit.  Significant potential still exists at Adumbi to increase and upgrade mineral resources within the open pit as well as underground potential since the mineralization remains open at depth.”

As outlined in the Company’s press release dated January 28, 2020, Loncor has been focussing on the Adumbi deposit (see Figures 2 and 3), where Minecon had identified significant resource upside potential from additional exploration evaluation, including drilling that was undertaken during 2017.  Much of this exploration work was undertaken following on from the recommendations made by RPA in their 2014 NI 43-101 technical report and included:

  • Additional Drilling
    RPA recommended additional drilling at Adumbi to test the down dip/plunge extent of the mineralization. In 2017, four deeper core holes (see Figures 3 and 8) were drilled below the previously outlined RPA inferred resource over a strike length of 400 metres and to a maximum depth of 450 metres below surface. All four holes intersected significant gold mineralization in terms of widths and grade and are summarised below:
BoreholeFrom(m)To(m)Intercept
Width(m)
True
Width(m)
Grade (g/t) Au
SADD50434.73447.4212.6910.675.51
      
SADD51393.43402.729.296.544.09
      
SADD52389.72401.8712.157.013.24
 419.15428.759.605.545.04
      
SADD53346.36355.639.275.703.71
 391.72415.1723.4514.436.08

Due to funding constraints, no follow up drilling was undertaken at the Adumbi deposit after 2017.

  • Survey and Georeferencing
    All the Adumbi drill hole collars, trenches and accessible adits and adit portals were accurately surveyed and the data appropriately georeferenced.  In addition, all accessible underground excavations and workings were accurately surveyed.
  • Re-logging of All Drill Holes
    All boreholes (153 holes totalling 33,651 metres) from Adumbi were systematically relogged and all data was put on (Strata Logs software) including core orientations.  The re-logging of drill holes defined the presence of five distinct geological domains in the central part of the Adumbi deposit where the BIF (Banded Iron Formation) unit attains a thickness of up to 130 metres (see Figures 3 and 4).  From northeast to southwest these are:
  1. Hanging wall schists: dominantly quartz carbonate schist, with interbedded carbonaceous schist.
  2. Upper BIF Sequence: an interbedded sequence of BIF and chlorite schist, 45 to 130 metres in thickness.
  3. Carbonaceous Marker: a distinctive 3 to 17 metre thick unit of black carbonaceous schist with pale argillaceous bands.
  4. Lower BIF Sequence: BIF interbedded with quartz carbonate, carbonaceous and/or chlorite schist in a zone 4 to 30 metres in thickness.
  5. Footwall Schists: similar to the hanging wall schist sequence.

In the central part of the Adumbi deposit, three main zones of gold mineralization are present (see Figures 5 and 6).  These include the following mineralization:

  1. within the Lower BIF Sequence;
  2. in the lower part of the Upper BIF Sequence.  Zones 1 and 2 are separated by the Carbonaceous Marker, which is essentially unmineralized; and
  3. a weaker zone in the upper part of the Upper BIF Sequence.

There is a higher-grade zone of gold mineralization termed the Replaced Rock Zone (“RP Zone”) associated with alteration and structural deformation that has completely destroyed the primary host lithological fabric.  The RP Zone occurs in the lower part of the Upper BIF package and in the Lower BIF package, and transgresses the Carbonaceous Marker, located between the Upper and Lower BIF packages, both along strike and down dip (see Figures 3 and 4).

  • Relative Density (“RD”) Measurements
    The increase in the sample population coupled with the application of a more rigid RD determination procedure based on recommendations from the RPA resource study, indicates that the new RD measurements from both mineralized and unmineralized material and from the various material types and lithologic units have improved the confidence in the relative RD determination to be applied to any resource estimates. Relative to the 6 oxide RD measurements used for tonnage estimation in the RPA model, 297 oxide RD measurements within the mineralized domain were undertaken during the review work. For the transition and fresh material, equal number of determinations relative to the previous RD sample volumes were undertaken with the review process employing more rigid RD determination procedures.  

Table 1 below indicates significate positive variance between the previous model RD and the reviewed work for the oxide and transition materials.

Table 1: Summary of Previous and Updated Mineralised Average RD Measurements for Adumbi Deposit

Material
Type
RD used in
Previous RPA Model
RD Determinations Used
in Current Model
RD Variance
(%)
Oxide1.802.4536.1
Transition2.202.8228.2
Fresh3.003.051.7
  • Oxidation and Fresh Rock Surfaces
    The re-logging of the core as per the RPA recommendations identified major differences between the depths of Base of Complete Oxidation (BOCO) and Top of Fresh Rock (TOFR), and the depths used by RPA in the 2014 model.  In the RPA model, the BOCO was negligible and the TOFR corresponded approximately to the re-logged BOCO.  The deeper levels of oxidation that were observed during the re-logging exercise have had positive implications with respect to ore type classification and associated metallurgical recoveries, mining and processing cost estimates.
  • Adit Sampling and Georeferencing
    Following the accurate surveying of the 10 historical adits and appropriately georeferencing, the 796 adit samples (1,121 metres in total) when applied have positive implications on the data spacing and classification of mineral resources at the Adumbi deposit.
  • Quality Control and Quality Assurance
    Assessment of assay standards and blanks of the Adumbi deposit by RPA indicated that 1,014 samples within some batches failed QC and were identified for re-assay. A total of 616 pulps and 382 quarter core samples were retrieved for re-assay. The samples were submitted to the SGS Laboratory (which is independent) in Mwanza, Tanzania in November 2014, together with international reference material from Rocklabs (8 per 100 samples) and blanks (4 per 100 samples). This was undertaken to ensure the samples passed internal QA/QC analytical procedures.

    For the post 2014 drilling campaign, drill cores for assaying were taken at a maximum of one metre intervals and were cut with a diamond saw with one-half of the core placed in sealed bags by company geologists and sent to the SGS Laboratory in Mwanza.  The core samples were then crushed at the laboratory down to minus 2 mm and split with one half of the sample pulverized down to 90% passing 75 microns. Gold analyses were carried out on 50g aliquots by fire assay. In addition, checks assays were also carried out by the screen fire assay method to verify high grade sample assays obtained by fire assay. Internationally recognized standards and blanks were inserted as part of the internal QA/QC analytical procedures.

    Minecon has reviewed the quality of all the assay data used for the modelling and estimation of resources to ensure that they all passed the Company’s internal QA/QC criteria.
  • Gold Price
    A gold price of US$1,200 per ounce was used in 2014 for the RPA study. To reflect more recent market conditions, a gold price of US$1,500 per ounce has been used in Minecon’s resource determinations.

In summary, this additional 2014 to 2017 information resulted in better quantification with improved confidence in updating the geological model for grade interpolation and pit optimisation studies to determine mineral resources for the Adumbi deposit.

Geological Modelling and Grade Estimation
The Adumbi 3-Dimensional model was constructed by Minecon in collaboration with on site geologists using cross sectional and horizontal flysch plans of the geology and mineralization (see Figures 3 and 4) and was used to assist in the constraining of the 3-D geological model.  The mineralization model was constrained within a wireframe at 0.5 g/t Au cut-off grade (see Figures 5 and 6).  Grade interpolation was undertaken using:

  • 2 metre sample composites capped at 18 g/t Au to improve the reliability of the block grade estimates.
  • Ordinary Kriging to interpolate grades into the block model.
  • Relative densities of 2.45 for oxide, 2.82 for transitional and 3.05 for fresh rock were applied to the block model for tonnage estimation.

Pit Optimisation Parameters
To constrain the depth extent of the geological model and any mineral resources, an open pit for the Adumbi deposit was constructed based on the following pit optimisation parameters:

  • A long-term gold price of US$1,500 per ounce.
  • Block size: 8 metres x 8 metres x 8 metres.
  • A two-metre minimum mining width and a maximum of four metres of internal waste was applied.
  • Mining dilution of 100% of the tonnes at 95% of the grade.
  • Ultimate slope angle of minus 45 degrees.
  • Metallurgical recoveries of 95% for oxide and transitional material and 90% for fresh rock (in the RPA study a fresh rock metallurgical recovery of 95% was used while Minecon reduced this to a more conservative 90% even though no additional metallurgical testwork was undertaken after the RPA study).
  • Average mining cost of US$2.5/t mined.
  • Mineral resources were estimated at a block cut-off grade of 0.9 g/t Au constrained by a Whittle pit with processing and G&A costs of US$30/t.
  • Transport of gold and refining costs equivalent to 4.5% of the gold price.
  • No additional studies on depletion by artisanal activity was undertaken since the 2014 RPA study and the same total amount of material was used by Minecon.

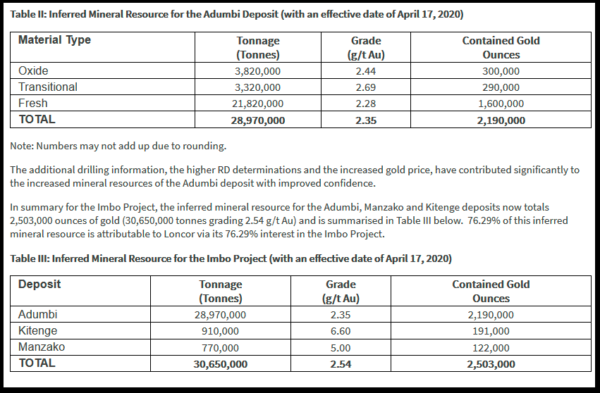
The results of the Adumbi pit optimisation (see Figure 7) indicated an inferred mineral resource within the pit of 2.19 million ounces of gold (28.97 million tonnes at 2.35 g/t gold) (see Table II below).

Mineral Resources
Within the US$1,500 pit shell (Figure 7), the following is classified as inferred mineral resource at the Adumbi deposit: 

Table II: Inferred Mineral Resource for the Adumbi Deposit (with an effective date of April 17, 2020)

Material TypeTonnage
(Tonnes)
Grade
(g/t Au)
Contained Gold
Ounces
Oxide3,820,0002.44300,000
Transitional3,320,0002.69290,000
Fresh21,820,0002.281,600,000
TOTAL28,970,0002.352,190,000

Note: Numbers may not add up due to rounding.

The additional drilling information, the higher RD determinations and the increased gold price, have contributed significantly to the increased mineral resources of the Adumbi deposit with improved confidence.

In summary for the Imbo Project, the inferred mineral resource for the Adumbi, Manzako and Kitenge deposits now totals 2,503,000 ounces of gold (30,650,000 tonnes grading 2.54 g/t Au) and is summarised in Table III below.  76.29% of this inferred mineral resource is attributable to Loncor via its 76.29% interest in the Imbo Project.

Table III: Inferred Mineral Resource for the Imbo Project (with an effective date of April 17, 2020)

DepositTonnage
(Tonnes)
Grade
(g/t Au)
Contained Gold
Ounces
Adumbi28,970,0002.352,190,000
Kitenge910,0006.60191,000
Manzako770,0005.00122,000
TOTAL30,650,0002.542,503,000

Note: Numbers may not add up due to rounding.

Additional Resource Potential and Recommendations for Further Work
There is significant additional resource potential within the Imbo project permit:

  • At the Adumbi deposit, the gold mineralization is still open at depth and, subject to securing the necessary financing, the drilling of an additional 12 core holes (7,000 metres) has the potential to add and upgrade mineral resources within the US$1,500 pit as well as outline potential underground resources below the pit (see Figure 8).  After this proposed drilling program has been completed, additional drilling may be undertaken (subject to securing the necessary financing) before a Preliminary Economic Assessment is initiated to include additional mineral resource determinations, metallurgical testwork, open pit and potential underground studies, metallurgical plant processing, infrastructural, environmental and economic studies.
  • At the Kitenge and Manzako deposits, additional drilling may also be undertaken (subject to securing the necessary financing) to further define and increase the inferred mineral resources at these deposits. 
  • Ongoing exploration including gridding, soil sampling, trenching and channel sampling is planned to be undertaken at the Imbo East prospect in order to generate potential drill targets.

An independent National Instrument 43-101 technical report relating to the mineral resource estimates on the Imbo Project reported in this press release will be filed on SEDAR and EDGAR within the period required by National Instrument 43-101.

Qualified Person
Mr. Daniel Bansah, Chairman and Managing Director of Minecon, is the “qualified person” (as such term is defined in National Instrument 43-101) who is responsible for the mineral resource estimates and other technical information disclosed in this press release.  Mr. Bansah has reviewed and approved the contents of this press release.

About Loncor Resources Inc.
Loncor is a Canadian gold exploration company focussed on the Ngayu Greenstone Belt in the Democratic Republic of the Congo (the “DRC”).  The Loncor team has over two decades of experience of operating in the DRC.  Ngayu has numerous positive indicators based on the geology, artisanal activity, encouraging drill results and an existing gold resource base.  The area is 200 kilometres southwest of the Kibali gold mine, which is operated by Barrick Gold (Congo) SARL (“Barrick”).  In 2019, Kibali produced record gold production of 814,000 ounces at “all-in sustaining costs” of US$693/oz.  Barrick has highlighted the Ngayu Greenstone Belt as an area of particular exploration interest and is moving towards earning 65% of any discovery in 1,894 km2 of Loncor ground that they are exploring.  As per the joint venture agreement signed in January 2016, Barrick manages and funds exploration on the said ground at the Ngayu project until the completion of a pre-feasibility study on any gold discovery meeting the investment criteria of Barrick.  In a recent announcement Barrick highlighted six prospective drill targets and are moving towards confirmation drilling in 2020. Subject to the DRC’s free carried interest requirements, Barrick would earn 65% of any discovery with Loncor holding the balance of 35%.  Loncor will be required, from that point forward, to fund its pro-rata share in respect of the discovery in order to maintain its 35% interest or be diluted.

In addition to the Barrick JV, certain parcels of land within the Ngayu project surrounding and including the Makapela and Adumbi deposits have been retained by Loncor and do not form part of the joint venture with Barrick. Barrick has certain pre-emptive rights over the Makapela deposit.  Loncor’s Makapela deposit (which is 100%-owned by Loncor) has an indicated mineral resource of 614,200 ounces of gold (2.20 million tonnes grading 8.66 g/t Au) and an inferred mineral resource of 549,600 ounces of gold (3.22 million tonnes grading 5.30 g/t Au).  Adumbi and two neighbouring deposits hold an inferred mineral resource of 2.5 million ounces of gold (30.65 million tonnes grading 2.54 g/t Au), with 76.29% of this resource being attributable to Loncor via its 76.29% interest in the project.  

Resolute Mining Limited (ASX/LSE: “RSG”) owns 26% of the outstanding shares of Loncor and holds a pre-emptive right to maintain its pro rata equity ownership interest in Loncor following the completion by Loncor of any proposed equity offering. 

Additional information with respect to Loncor and its projects can be found on Loncor’s website at www.loncor.com. 

Excess Money Supply Has Been Like Miracle-Gro For Gold Prices SPONSOR: Loncor Resources $LN.ca $ABX.ca $TECK.ca $RSG $NGT.to $GOLD $NEM

Posted by AGORACOM at 10:19 AM on Thursday, April 9th, 2020

Sponsor: Loncor, a Canadian gold explorer controlling over 2,400,000 high grade ounces outside of a Barrick JV. The Ngayu JV property is 200km southwest of the Kibali gold mine, operated by Barrick, which produced 800,000 ounces of gold in 2018. Barrick manages and funds exploration at the Ngayu project until the completion of a pre-feasibility study on any gold discovery meeting their Tier One investment criteria. Newmont $NGT $NEM owns 7.8%, Resolute $RSG owns 27% Click Here for More Info

This image has an empty alt attribute; its file name is Loncor-Small-Square.png
  • 285 stimulus measures have been announced around the world in the past eight months
  • Japan, which only this week declared a state of emergency, approved a $1 trillion relief package

The $2.2 trillion coronavirus relief package that President Donald Trump signed into law on March 27 is just the beginning. The Treasury Department is now seeking some $250 billion more to replenish small business loans, and there’s hope that the president and House Democrats can agree on a “Phase Four” spending deal, one that may target infrastructure. Trump has asked for $2 trillion.

And that’s just the U.S.

According to Evercore ISI’s Ed Hyman, as many as 285 stimulus measures have been announced around the world in the past eight months, “the most ever by a wide margin.” Japan, which only this week declared a state of emergency, approved a $1 trillion relief package on Tuesday.

Last month I predicted that at least $10 trillion would be spent to mitigate the economic impact of this virus, and it appears as though we’re already there, with much more to go. And this is all before considering monetary stimulus in the form of near-zero rates and quantitative easing (QE).

The U.S. economy is being flooded with excess money and liquidity right now. Compared to the same period a year ago, M2 money supply––which includes not just cash but also savings deposits, money market funds and other “near” money––has increased some 12 percent, the most in more than 10 years.

Money Supply Flowing Into Physical Gold

All this excess liquidity has to go somewhere, and historically it’s acted as Miracle-Gro for gold prices. Look at the chart below. There’s a clear correlation between the annual growth rate in M2 money supply and the price of the yellow metal. In the times when money supply surged from the same period a year earlier, gold prices followed.

Gold touched its all-time high of $1,900 an ounce in 2011 when M2 money supply growth soared above 10 percent year-over-year. With supply growth now at 12 percent––and likely headed higher––liquidity has flowed into physical gold as well as paper gold. On Monday, spot gold traded above $1,700 for the first time since December 2012. The next test, I believe, is $2,000, and as I’ve said before, $10,000 gold isn’t crazy.

Gold ETF Inflows Smash Records

Global exchange-traded funds (ETFs) backed by physical gold notched a new all-time record in the first quarter of 2020, attracting 298 metric tons, or net inflows of $23 billion, for a total of more than $164 billion, according to a report by the World Gold Council (WGC). That’s the highest ever in U.S. dollar terms for a quarter and the most in tonnage terms since the first quarter of 2016, after the start of the current

U.S. Global Investors

The WGC expects the recent drivers of gold to persist, including “widespread market uncertainty and the improved opportunity cost of holding gold as yields move lower.”

“With the Fed taking interest rates to zero for the foreseeable future, gold could do well as it tends to outperform during easing cycles,” the group writes. “Additionally, multi-trillion dollar fiscal stimulus policies to combat the economic impact of COVID-19 could prove inflationary––a development that could support gold prices in the long run.”

So far inflation in the U.S. has been moderate, despite earlier expectations that Trump’s tariffs and the U.S.-China trade war would push up consumer prices. But I agree that the global $10 trillion+ stimulus effort will have a noticeable impact on the prices of goods and services, which could be constructive for gold.

Precious Metal Royalty and Streaming Companies Have the Cushion to Weather the Coronavirus

There are other ways to get exposure to gold and precious metals, of course. I believe the best way is with royalty and streaming companies, led by heavyweights Franco-Nevada, Wheaton Precious Metals and Royal Gold, with a combined market cap of close to $40 billion as of April 7.

These companies, as I’ve shared with you many times before, are not the ones spending money to develop a project. They simply put up the capital, and in exchange, they enjoy either a royalty on whatever the miner produces or rights to a stream of metal supply at a fixed, lower-than-average cost.

While they enjoy a lot of the upside potential when gold prices are rising, royalty companies share very little of the downside potential with producers and explorers when the metal is in decline. Royalty companies are better insulated from bear markets because they have a diversity of high-quality active mines in their portfolio.

The superiority of their business model can be seen in the chart below. Whereas the universe of publicly traded precious metal miners had an average gross profit margin of 20.7 percent as of December 2019, the three top royalty and streaming companies had one of 45.7 percent, or more than twice the amount. This, I believe, gives them an adequate cushion to weather the coronavirus downturn.

U.S. Global Investors

For full disclosures pertaining to this post click here.

SOURCE: https://www.forbes.com/sites/greatspeculations/2020/04/08/excess-money-supply-has-been-like-miracle-gro-for-gold-prices/#30566fb6be41

Coronavirus To Fuel Gold-Miner Deals: Barrick Gold CEO SPONSOR: Loncor Resources $LN.ca $ABX.ca $TECK.ca $RSG $NGT.to $GOLD $NEM

Posted by AGORACOM at 1:35 PM on Tuesday, April 7th, 2020

Sponsor: Loncor, a Canadian gold explorer controlling over 2,400,000 high grade ounces outside of a Barrick JV. The Ngayu JV property is 200km southwest of the Kibali gold mine, operated by Barrick, which produced 800,000 ounces of gold in 2018. Barrick manages and funds exploration at the Ngayu project until the completion of a pre-feasibility study on any gold discovery meeting their Tier One investment criteria. Newmont $NGT $NEM owns 7.8%, Resolute $RSG owns 27% Click Here for More Info

This image has an empty alt attribute; its file name is Loncor-Small-Square.png
  • There’s a real opportunity that there might be some acquisition options coming out of this,” Bristow told FOX Business. “We’re certainly keeping very busy looking at those options.”

The COVID-19 pandemic could lead to a flurry of deals in the gold mining industry, according to Barrick Gold CEO Mark Bristow.

The pandemic has caused some miners to put operations on care and maintenance, shrinking gold supplies. At the same time, major central banks and governments have been injecting cash into their economies, devaluing their currencies and spiking interest in gold, a traditional safe haven.

“There’s a real opportunity that there might be some acquisition options coming out of this,” Bristow told FOX Business. “We’re certainly keeping very busy looking at those options.”

All of this comes as gold is seeing a declining reserve base due to miners not investing in their future and production forecasts pointing to a 20 percent to 30 percent decline in new gold supply over the next 10 years.

The gold mining industry has 14 so-called tier-one assets, according to Bristow, and Barrick already has six of them, including three in Nevada, two in Africa and one in the Dominican Republic. The company has a handful of other assets that are on the verge of becoming tier one, which refers to mines that have produced more than 500,000 ounces of gold per year for at least 10 years at the lower half of the cost curve.

Bristow says the opportunity created by the COVID-19 pandemic is similar to what happened following the 2008 global financial crisis when miners found themselves in an environment that was ripe for deals as the price of gold surged from about $700 per ounce to $1,900 before collapsing and leaving a trail of destruction.

“You’ve got to be careful that you don’t blow your brains out like the industry did between 2009 and the run-up to the peak in 2012,” Bristow said.

The VanEck Vectors Gold Miner ETF hit a peak market capitalization of $10.79 billion in September 2011 before falling to below $4 billion in January 2016.

The value of mergers and acquisitions in the gold industry increased by 45 percent to $18.2 billion in 2019, according to a report released in February by the consultancy Metals Focus. That number was 43 percent below the 2010 peak of $32.2 billion, the report said.

Even with the coronavirus, Bristow says the Toronto-based Barrick, the world’s No. 2 gold miner, aims to become the “most valued gold company” and will continue to acquire “best-in-class assets,” according to Bristow, as well as hire the best people.

“That always delivers superior returns,” he said.

The company recently released its 10-year plan, which sets out a path to reach 5 million ounces of annual production with its current resources.

Should Barrick make any new acquisitions or discover more gold, it would build on that foundation of 5 million ounces. The icing on the cake for the company may be the price of the yellow metal itself. “At these gold prices, we’re in very good shape because we’ve allocated and invested and built our business based on a long term gold price of $1,200,” Bristow said.

Gold this year has gained more than 10 percent and is hovering around $1,677 an ounce.

SOURCE: https://finance.yahoo.com/news/coronavirus-fuel-gold-miner-deals-111049052.html

Precious Metals Are About To Reset Like In 2008 – Gold Bugs, Buckle Up! SPONSOR: Loncor Resources $LN.ca $ABX.ca $TECK.ca $RSG $NGT.to $GOLD $NEM

Posted by AGORACOM at 10:48 AM on Monday, April 6th, 2020

Sponsor: Loncor, a Canadian gold explorer controlling over 2,400,000 high grade ounces outside of a Barrick JV. The Ngayu JV property is 200km southwest of the Kibali gold mine, operated by Barrick, which produced 800,000 ounces of gold in 2018. Barrick manages and funds exploration at the Ngayu project until the completion of a pre-feasibility study on any gold discovery meeting their Tier One investment criteria. Newmont $NGT $NEM owns 7.8%, Resolute $RSG owns 27% Click Here for More Info

This image has an empty alt attribute; its file name is Loncor-Small-Square.png

For years, many Gold Bugs (investors who’ve been advocating buying Gold and Silver at low prices as a hedge against future global economic risks) were shunned as conspiracy theorists and nuts. How could these people believe Gold and Silver were solid investments when the Global equities markets were rallying 5% a year consistently – what could go wrong?

Over the past two weeks, I have personally received multiple phone calls and emails from friends and associates asking how these people can suddenly “buy physical metals”. In one case, this individual was purchasing Airline and Food Services stocks in late February thinking this move would be short-lived and telling me how the airlines would recover quickly after this is all over.  Now, that person wants to know my secret contacts for buying physical metals.

If you know any Gold Bugs, you know we’ve built relationships with suppliers, friends and other Gold Bugs throughout the year. Believe it or not, I can still buy physical metals from a few of my closest associates in the industry. Eric Sprott is a fan of my precious metals forecasts and talked about my work a few times publicly.

Yes, the prices have begun to skyrocket a bit – Silver especially.  But I can still buy physical metals because I have a deep resource of friends and suppliers.

What’s going to happen over the next few weeks is that more and more average people are suddenly going to realize they should have been buying metals as security against risk.  Paper metals are going to explode as well, but physical metals will demand a premium that is much higher than paper/spot price. Right now, one ounce of Silver is going for about $21 to $25 per ounce in physical form (depending on my sources).  The current SPOT price of silver is $14.50. That means the premium for physical Silver is between +45% to +75% right now in the open market.

Daily Gold Chart

This Daily Gold chart highlights the upside Fibonacci price targets using our Adaptive Fibonacci Price Modeling system.  We believe the next upside price target for Gold is $1825. A higher upside price target is visible on this chart near $1950 and we believe Gold prices will reach this level eventually.  But we believe the current $1825 level is the immediate target.  This would represent an immediate +10 upside price advance and would establish NEW HIGH prices for the past 9 years.

Silver Daily Chart

This Silver Daily chart also highlights our Adaptive Fibonacci Price Modeling system and shows an upside price target of $17.25.  Remember, the current physical demand for Gold and Silver has skyrocketed over the past 2+ weeks. The Spot price is really not indicative of the open market price of physical at the moment.  If Spot Silver moves to $17.25 as we predict, that would be a +19% upside price advance.  If Silver advances to $18.25, that would be a +26% upside price advance.

You should also take a look at our silver chart from 1999 and what happened then, and should happen again now as well.

Silver Bugs are loving the setup right now because they know the pattern that sets up in the Metals market when a crisis hits.  First, Gold begins to rally faster than Silver and the Gold to Silver ratio spikes higher.  Then, once the shock-wave of the market crisis subsides, the metals begin a fairly usual price advance where both Gold and Silver advance – in unequal forms.  This is when the real fun for Gold & Silver Bugs begins.

Gold to Silver Weekly Ratio Chart

THE SILVER LINING

Take a look at this Gold to Silver Weekly Ratio chart.  This chart measures how much one ounce Silver it takes to purchase one ounce of gold at current prices.  Notice that spike in the ratio back in 2008?  That was the spike in gold prices relative to Silver prices as the top formed in 2008 and the “shock wave” struck global investors.  What happened?  Everyone tried to pile into the Gold trade and ignored Silver for about 6+ weeks.

Then what happened to the Gold to Silver Ratio?  It COLLAPSED from levels near 85 to a bottom hear 31.  That means the price of Silver advance almost 3x faster than the price of Gold over that span.  In order for the ratio to fall from near 90 to levels near 30, that indicates a very expansive price increase in the price of Silver.

Now, take a look at what has happened just recently in the Gold to Silver Ratio…  another massive price spike.  This time, the spike reached levels near 120 (Yikes).  Can you guess why Gold and Silver Bugs are so excited right now? If another price advance takes place in precious metals which is similar to the 2008~2011 rally, Gold may see a 300% to 500% rally and Silver may see a 450% to 900% rally over the next 2 to 3 years.

This is no joke.  Physical metals are why Gold and Silver Bugs believe the value of having it in your hands is much better than owning an IOU from a broker or bank.

Get ready for some incredible price moves in the metals markets and congrats to all the Gold and Silver bugs out there.  Our analysis says our patience and accumulation of physical metals will soon pay off in a big way.

As a technical analyst and trader since 1997, I have been through a few bull/bear market cycles. I believe I have a good pulse on the market and timing key turning points for short-term swing traders.

SOURCE:https://finance.yahoo.com/news/precious-metals-reset-2008-gold-223755361.html

Chris Vermeulen
Chief Market Strategies
Founder of Technical Traders Ltd.

Loncor Increases Interest In Adumbi Mining To 76.29% $LN.ca $ABX.ca $TECK.ca $RSG $NGT.to $GOLD $NEM

Posted by AGORACOM at 8:26 AM on Wednesday, March 25th, 2020
  • Loncor has acquired an additional 5.04% interest in its subsidiary Adumbi Mining
  • Adumbi holds six exploitation licences in the Ngayu Greenstone Belt including the Imbo exploitation licence, where an Inferred Mineral Resource of 1.675 million ounces of gold (20.78 million tonnes grading 2.5 g/t Au

TORONTO, March 25, 2020 (GLOBE NEWSWIRE) — Loncor Resources Inc. (“Loncor” or the “Company“) (TSX: “LN”; OTCQB: “LONCF”) announces that it has acquired an additional 5.04% interest in its subsidiary Adumbi Mining SARL (“Adumbi Holdco”) pursuant to a private transaction with one of the former minority shareholders of Adumbi Holdco.  This acquisition increases Loncor’s interest in Adumbi Holdco from 71.25% to 76.29%.  “Loncor continues to consolidate its dominant position in the Ngayu Goldbelt.  Over the next twelve months we intend to drill the Adumbi gold deposit and several other highly prospective areas of the Imbo license,” said Founder and CEO, Arnold Kondrat.

Adumbi Holdco, which recently changed its name from KGL Somituri SARL, holds six exploitation licences in the Ngayu Greenstone Belt including the Imbo exploitation licence, where an Inferred Mineral Resource of 1.675 million ounces of gold (20.78 million tonnes grading 2.5 g/t Au,) was outlined in January 2014 by independent consultants Roscoe Postle Associates Inc on three separate deposits, Adumbi, Kitenge and Manzako.  76.29% of this gold resource is now attributable to Loncor.

About Loncor Resources Inc.
Loncor is a Canadian gold exploration company focussed on the Ngayu Greenstone Belt in the Democratic Republic of the Congo (the “DRC”).  The Loncor team has over two decades of experience of operating in the DRC.  Ngayu has numerous positive indicators based on the geology, artisanal activity, encouraging drill results and an existing gold resource base.  The area is 200 kilometres southwest of the Kibali gold mine, which is operated by Barrick Gold (Congo) SARL (“Barrick”).  In 2019, Kibali produced record gold production of 814,000 ounces at “all-in sustaining costs” of US$693/oz.  Barrick has highlighted the Ngayu Greenstone Belt as an area of particular exploration interest and is moving towards earning 65% of any discovery in 1,894 km2 of Loncor ground that they are exploring.  As per the joint venture agreement signed in January 2016, Barrick manages and funds exploration on the said ground at the Ngayu project until the completion of a pre-feasibility study on any gold discovery meeting the investment criteria of Barrick.  In a recent announcement Barrick highlighted six prospective drill targets and are moving towards confirmation drilling in 2020.  Subject to the DRC’s free carried interest requirements, Barrick would earn 65% of any discovery with Loncor holding the balance of 35%.  Loncor will be required, from that point forward, to fund its pro-rata share in respect of the discovery in order to maintain its 35% interest or be diluted.

In addition to the Barrick JV, certain parcels of land within the Ngayu project surrounding and including the Makapela and Adumbi deposits have been retained by Loncor and do not form part of the joint venture with Barrick.  Barrick has certain pre-emptive rights over the Makapela deposit.  Loncor’s Makapela deposit (which is 100%-owned by Loncor) has an Indicated Mineral Resource of 614,200 ounces of gold (2.20 million tonnes grading 8.66 g/t Au) and an Inferred Mineral Resource of 549,600 ounces of gold (3.22 million tonnes grading 5.30 g/t Au).  Adumbi and two neighbouring deposits hold an Inferred Mineral Resource of 1.675 million ounces of gold (20.78 million tonnes grading 2.5 g/t Au), with 76.29% of this resource being attributable to Loncor via its 76.29% interest.   

Resolute Mining Limited (ASX/LSE: “RSG”) owns 25% of the outstanding shares of Loncor and holds a pre-emptive right to maintain its pro rata equity ownership interest in Loncor following the completion by Loncor of any proposed equity offering. 

Additional information with respect to Loncor and its projects can be found on Loncor’s website at www.loncor.com. 

Qualified Person
Peter N. Cowley, who is President of Loncor and a “qualified person” as such term is defined in National Instrument 43-101, has reviewed and approved the technical information in this press release. 

Technical Reports
Certain additional information with respect to the Company’s Ngayu project is contained in the technical report of Venmyn Rand (Pty) Ltd dated May 29, 2012 and entitled “Updated National Instrument 43-101 Independent Technical Report on the Ngayu Gold Project, Orientale Province, Democratic Republic of the Congo”.  A copy of the said report can be obtained from SEDAR at www.sedar.com and EDGAR at www.sec.gov

Bob Moriarty Discusses Loncor Resources: The Fed, the Coronavirus and Investing SPONSOR Loncor Resources $LN.ca t $ABX.ca $TECK.ca $RSG $NGT.to $GOLD $NEM

Posted by AGORACOM at 3:02 PM on Wednesday, March 11th, 2020

Sponsor: Loncor, a Canadian gold explorer controlling over 2,400,000 high grade ounces outside of a Barrick JV. The Ngayu JV property is 200km southwest of the Kibali gold mine, operated by Barrick, which produced 800,000 ounces of gold in 2018. Barrick manages and funds exploration at the Ngayu project until the completion of a pre-feasibility study on any gold discovery meeting their Tier One investment criteria. Newmont $NGT $NEM owns 7.8%, Resolute $RSG owns 27% Click Here for More Info

This image has an empty alt attribute; its file name is Loncor-Small-Square.png

Maurice Jackson of Proven and Probable speaks to Bob Moriarty of 321gold about his thoughts on the current financial markets and investment opportunity

  Excerpt: Maurice Jackson:……Staying in the Southern Hemisphere, let’s visit the Congo, where you just introduced Loncor Resources (TSX:LN). Sir, who is Loncor Resources, and what is the opportunity they present to the market?

Bob Moriarty: Here’s what’s absolutely amazing, I’m glad you brought that up. Loncor Resources approached me, I had never even heard a whisper of the name, I had no clue as to who they were. I went looking into it, they have an incredibly massive land position, in the Democratic Republic of Congo, the DRC.

Barrick Gold has several gold mines there, in the Greenstone Belt, and across the border in Tanzania. Barrick Gold has some of their other really giant mines. Loncor has, in their wholly owned properties, resources of about 2.4 million ounces. They’ve got joint venture with Barrack, on a big piece of their property, like 3000 square kilometers, which is a really big project. Barrick is funding it to feasibility, they’re paying everything. Barrick runs the project, and Barrick spends the money. There are no particular limits on what Barrick can spend, they can spend anything they want to. They’ve got a drill program that’s literally starting right now.

If you look at any stock, you want to figure out what the basement is, what is the lowest price the stock can go to? If you ignored the JV with Barrick, which would be a foolish thing to do, but if you ignored it, you’re buying ounces of gold, in the ground, for $19 an ounce, U.S. So, I don’t think there’s any downside to it. Approximately 70% of shares are in the top three or four shareholders. I think Loncor Resources is a great stock, because if you like gold, and I think after all of the things that I’ve said over the last 15 years, anybody who doesn’t like gold right now is economically illiterate.

Maurice Jackson: You know, you said that lightly, $19 an ounce.

Bob Moriarty: Yeah, yeah. How can you go wrong? At the stage they’re operating, they should be getting $50 or $60 bucks an ounce.

Now, one of the things that we haven’t gotten into, and we need to get into is, one, the T-bond, and, two, what I see happening to gold and gold shares. The T-bond Daily Sentiment Index (DSI), on Friday, hit 98. That is the highest rating I’ve seen, on the Daily Sentiment Indicator for any commodity, ever. Therefore, the T-bond’s going to crash, it’s probably going to take gold with it. Gold had a DSI of 96 a couple of weeks ago.

Everybody hates it. They act like, “Oh my God, you say that gold’s going down. My God, I hate you!” The corrections are perfectly normal, and we’re going to have a correction in gold, and we’re going to have a correction in palladium, and we’re going to have a correction in rhodium. We’re going to go into the biggest financial crash in world history, and most asset classes are going to get sold off. That’s not a bad thing, that creates opportunity, but you’ve got to be flexible, and hopefully liquid.

Now, I am not saying, “Go out and sell everything you’ve got.” Every time I say we’re going to have a correction, “Oh my God, you told me to sell everything.” Well, that’s not what I said, not at all. I said we’re going to have a correction. At the end of the correction, gold and silver and platinum are going to be a lot more valuable. We’re going to do exactly what we did in 2008. A lot of stocks were down 70% or 80%. Most of the big ones, the ones that I like, Lion One Metals, Novo Resources, Irving Resources, Barksdale Capital, these stocks are down 30 or 40% since the first of the year, when I said, “Beware of the stock market.”

I’m not saying something’s going to change on Monday with gold shares, gold shares have been going down for two months.

Maurice Jackson: You referenced Jake Bernstein’s work on the Daily Sentiment Index. What are the parameters that you referenced regarding buy and sell indicators?

Bob Moriarty: The DSI measures sentiment. Most investor look at fundamentals, technicals, worry about the interest rates, worry about the Fed. That’s all bull. People buy stocks because of emotions, and they sell stocks because of emotions. If you can measure those emotions accurately, you’d make a lot of money.

When 98 out of 100 people say something is going to go up, and it doesn’t make any difference what it is, or what the fundamentals are, or what the Fed does, or what the economy does, or what interest rates do, when 98 out of 100 people say something is going to go up, the next move is down. That is the highest number I’ve ever seen. Anything above 90 says the top is near, and anything below 10 says the bottom is near. 98 is such an extreme measure, that I’m perfectly comfortable saying that, you and I are talking on Saturday, and on Monday, T-bonds are going to go down.

Maurice Jackson: Mark the words, there. Which metals have your attention, and why?

Bob Moriarty: Silver and platinum, strange enough, you sent me some information (click here). There was a fire, an explosion at a platinum processing place in South Africa, and the real story is the price of platinum is so far below the cost of production, they’ve got to shut production.

Nobody wants to admit this, everybody’s got their own pet theory, but the fact is supply and demand does work. You cannot have the price of any commodity below the cost of production for very long, or things are going to happen. People are going to shut down production whether it’s wheat, whether it’s gold, or anything else. The silver gold ratio got above 100 to 1, that’s the highest it’s ever been. I think it got up to 102, intraday, a week ago. Silver was very cheap, relative to gold, but that doesn’t mean silver couldn’t correct. I own a lot of silver, and I own a lot of platinum, and a little bit of gold.

SOURCE: https://www.streetwisereports.com/article/2020/03/10/the-fed-the-coronavirus-and-investing.html