SPONSOR: Lomiko Metals is focused on the exploration and development of minerals for the new green economy such as lithium and graphite. Lomiko owns 80% of the high-grade La Loutre graphite Property, Lac Des Iles Graphite Property and the 100% owned Quatre Milles Graphite Property. Lomiko is uniquely poised to supply the growing EV battery market. Click Here For More Information
- A country fuelled by hydropower has become the world’s electric vehicle leader
In 1995, the lead singer of the 1980s band A-ha and the head of the Norwegian environmental group Bellona climbed improbably into a converted electric Fiat Panda they had imported from Switzerland and set off on a road trip.
They drove around Oslo refusing to pay the city’s sky-high road tolls, parking illegally wherever they could, and ignoring every penalty notice they were given. Eventually, the authorities impounded their car and auctioned it off to cover the fines.
But the stunt attracted massive media attention, and the point was made. Soon after, electric vehicles were exempted from road tolls, one of a large raft of incentives that have, over the years, helped make Norway the country with the world’s highest per capita electric vehicle ownership.
Last month, in an economy hit by the coronavirus crisis, fully electric cars accounted for just under 60% of Norway’s new car market, and plug-in hybrids just over 15% – meaning three in four of all new cars sold were either wholly or partly electric.
It still has some way to go, but the country looks on course to meet a government target – set in 2016, with full cross-party parliamentary support – of phasing out the sale of all new fossil-fuel based cars and light commercial vehicles by 2025.
“It’s actually quite amazing how fast the mindset’s changed,†said Christina Bu of the Norwegian EV Electric Vehicle Association. “Even in 2013 or 2014, people were sceptical. Now, a majority of Norwegians will say: my next car will be electric.â€
The story of how and why that has happened has a straightforward, if unexpected logic. First, despite being a major oil and gas producer, almost all of Norway’s domestic energy comes from a single, and renewable, source: hydropower.
That means switching to EVs is a much greener option for Norway than for countries whose power is generated mostly by coal plants – and that if it wants to significantly reduce its emission levels, it has little choice but to green its transport sector.
Driven by the environmental imperative, the government began offering incentives to buy and run electric cars as far back as 1990, first by introducing a temporary exemption from Norway’s exorbitant vehicle purchase tax, which became permanent six years later.
“This was an important step,†Bu said. “Norway was a very poor country before we discovered oil; cars were a luxury item. They’ve always been taxed very highly. Cars in Norway are a lot more expensive than elsewhere. Without the purchase tax, the cost of an electric car basically fell to that of an ordinary car.â€
Since then, electric car drivers have been given the right to park for free in some municipal car parks, drive in bus lanes, take ferries without a ticket and, thanks to A-ha, drive toll-free. They are not required to pay VAT on their cars, or road tax, and company electric cars are taxed at a lower rate than petrol or diesel vehicles.
Some measures have changed over the years: to be allowed to drive in a bus lane, for example, you now need to be carrying a passenger. A so-called 50% rule was introduced in 2017, allowing local authorities to charge EV drivers up to 50% of the parking fees, road tolls and ferry rates applicable to fossil-fuel vehicles.
But overall, said Bu, the “combination of a big one-off saving when you buy the car, plus the substantially lower costs – fuel, tolls, parking, maintenance – of actually driving it, still adds up to a very powerful financial argument. Over its lifetime, you really save a lot of money with an electric car in Norway.â€
That was certainly what persuaded Wenche Charlotte Egelund, 57, who bought a VW Golf Electric with her partner two years ago when they moved out of central Oslo. “The incentives were crucial,†she said. “The tax and VAT exemptions, free municipal parking, free toll roads that mean we avoid the rush-hour traffic jams.â€
In fact, Egelund said, the incentives were so significant that she almost “felt the decision was imposed on me. Financially, it was like there was no other sensible option. I do wonder whether it really is as green as we are told. Is a car running on clean diesel really worse than the environmental impact of producing an EV battery?â€
Rachel Ritman, 56, a postwoman living on the outskirts of Fredrikstad, bought her Opel Ampera two years ago and said she has not regretted her choice, even if she was “not sure we would have gone electric without the incentivesâ€. The car’s range was good, she said: 250 miles (400km) in summer, 200 miles (320km) in winter and because she charges at home she does not suffer from “lade-angstâ€, or the fear of running out of juice.
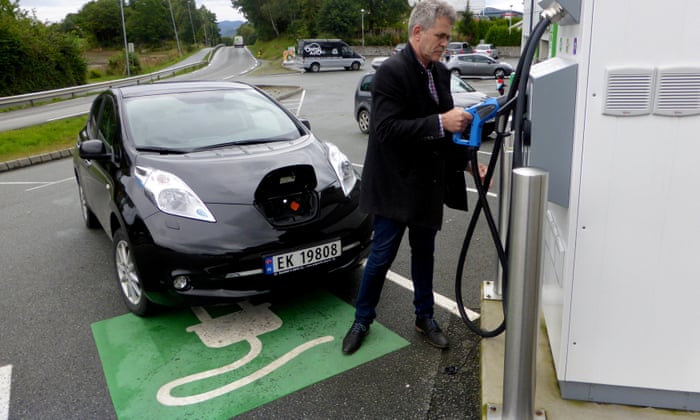
Both Ritman and Egelund have a second, diesel-powered car for extra-long journeys, to country cabins or holidays. Sten BrÃ¥then, 55, a media consultant, bought his Nissan Leaf as a second car “for taking the children around and driving to work. But there were so many advantages that when we were getting a new main car last year we didn’t think twice about going electric.â€
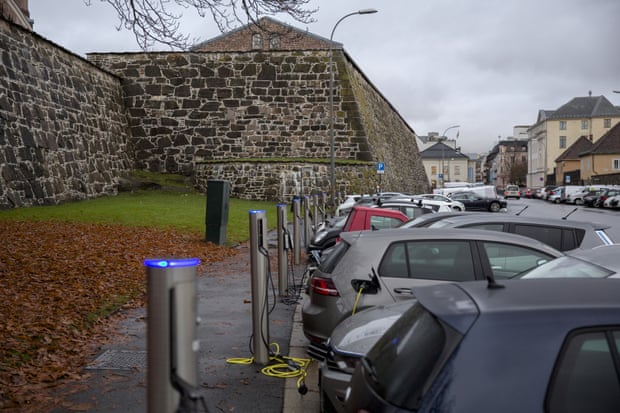
Government incentives were vital in the decision to buy, Bråthen said: “I think we would have managed without the other incentives – free toll roads and parking – but the actual cost of buying was so much lower than ordinary cars here in Norway.†He warned, though, that Norway was going to need more charging stations.
Despite the incentives, EV sales in Norway remained low until about 2010, when a number of smaller, more affordable electric cars from makers such as Mitsubishi and Nissan came to market, and improved technology meant larger electric cars began to offer both the space and range to make them a sensible choice for families.
Bu said the incentives were so significant that “many people say they’ve bought the most expensive car they’ve ever had when they buy electric – Teslas, Jaguars, that kind of model – simply because they’ve calculated what kind of saving they’re going to be making over the coming years, and feel it makes senseâ€.
That has led to accusations that Norway’s encouragement of electric vehicles amounts to little more than tax cuts for the rich, or a cut-price second car. Many Norwegians on lower incomes can only dream of owning an electric car, and three out of four car purchases are on the secondhand market.
Bu – whose organisation represents consumers rather than producers – rejected this, arguing that “we have to change the cars we drive, and the only way to do that is to change the new cars. We can’t change used onesâ€. EVs will soon make up 10% of Norway’s passenger fleet, she said, and are slowly coming on to the used market. Advertisement
She said she was confident for the future of electric vehicles, even in countries without a big renewable power sector, and studies show that EVs running on power generated from fossil fuel are responsible for roughly the same level of overall CO2 emissions as petrol cars.
“As a society, we clearly have to do two things,†she said. “Produce more renewable energy and products – like cars – that can run on it,†she said. “We have to do both, as fast as possible. We can’t hang around until we’re producing 100% renewable energy.â€
Electric cars are “never going to be truly environmentally friendlyâ€, Bu said. “The main problem is making the batteries. We need clean battery producers in Europe. But look, we need transport. We need cars and vans, particularly outside our cities. And for us, electric is the answer.â€
This story is a part of Covering Climate Now’s week of coverage focused on Climate Solutions, to mark the 50th anniversary of Earth Day. The Guardian is the lead partner in Covering Climate Now, a global journalism collaboration committed to strengthening coverage of the climate story.
SOURCE: https://www.theguardian.com/environment/2020/apr/19/norway-and-the-a-ha-moment-that-made-electric-cars-the-answer


 Source: Pew Research Center.