SPONSOR: ThreeD Capital Inc. (IDK:CSE) Led by legendary financier, Sheldon Inwentash, ThreeD is a Canadian-based venture capital firm that only invests in best of breed small-cap companies which are both defensible and mass scalable. More than just lip service, Inwentash has financed many of Canada’s biggest small-cap exits. Click Here For More Information.

Key Investment Themes In Crypto Networks
By: Matt Spoke
I’ve been an entrepreneur in this wild cryptocurrency industry for over 5 years. My focus has been on leading a team of core developers to build an open decentralized protocol that solves real problems for real users. I’m not alone in this endeavour. There are at least a few dozen of my peers leading projects with broadly similar goals.
To the outside world, we’re all crypto geeks building alternatives to Bitcoin. That said, there are nuances in the designs and goals of various projects that form the basis of some early investments theses that leading funds have adopted to guide their selection criteria when looking at digital assets.
Without getting into all the specifics, for the purposes of this article, I want to focus only on the specific digital asset classes that are native to their own networks or blockchains, rather than tokens built into “dApps†or other similar models.
The reason this is important is because there are an increasing number of funds, both institutional and not, that are looking at digital assets as the next asset class to include in their diversified portfolios that include everything from public equities, to real estate, to gold, to bonds and other instruments. Who knows, maybe the next time you check your pension, your favourite digital asset could be in it.
As such, it’s helpful to have a standard way to think about the differences and similarities among digital assets, such that they can be categorized for investment decisions.
To the outside looking in, this industry can be extremely opaque to understand and evaluate. How value will be created, on what time horizon and how does one form opinions on the quality of the project they’re looking at. While there is infinite nuance between projects, protocols, dApps, etc., most digital assets fall within common buckets, that have formed the informal standard crypto theses. This mental model is helpful for any observer, technologist or fund that has been researching or thinking about allocating capital or time into this industry. It also might help us understand new opportunities for value that fall outside of these established categories (more on this later).
In speaking to a prominent investor in the cryptocurrency industry recently, he summarized this very simply:
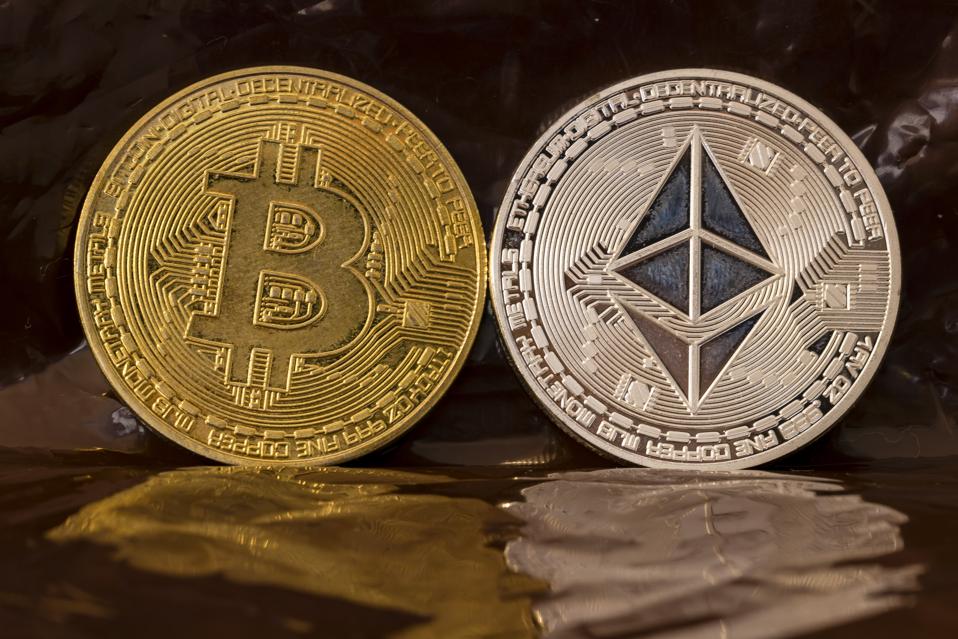
“I understand and believe in Bitcoin and Ethereum. Everything else is just playing copy-cat and trying to play the same game.â€
In a broad sense, this is generally how the industry has evolved. Bitcoin became dominant, and then many built alternatives (“altâ€-coins) broadly solving for a similar goal, and then Ethereum introduced a new type of protocol that was quickly followed by its own inspired alternatives – something that Chris Burniske of Placeholder Ventures refers to as “Ethereum Killersâ€.
The funds investing in this industry have had to build their theses around this reality. As such, you’ll often find funds with a deep conviction for Bitcoin and Ethereum, and then, to a lesser extent, a series of “hedges†into alternatives that could grow in relevance and in some cases potentially overtake the projects that first inspired them. Many of these alternatives have taken different technical approaches, but in general seek to solve the same problem and target the same ‘blockchain-converted’ developer or investor audience.
These investment themes behind Bitcoin and Ethereum are similar in that they are both digital assets, but they’re different in the problems they seek to solve.
Bitcoin established a category of digital assets that Multicoin Capital likes to refer to as “Global, State-free Moneyâ€. This theme focuses on a growing need for a global form of money that is independent of institutional trust and provides a digital alternative to gold. The need for such an asset is to address the >500m people in the world who live in countries with greater than 10% inflation, and to provide a place for people to store their wealth that is safe from seizure and “portable†across geographic boundaries.
Although it’s unclear how to measure the size of that addressable market, the thesis implies a multi-trillion-dollar opportunity in this category.
Ethereum, on the other hand, professed to be building a “world computer†or in other contexts, the basis for a “decentralized internetâ€. This category of digital assets known as “decentralized internet†projects is what primarily caused the run up of the ICO markets in 2017-2018. Believers in this thesis argue that the causes of many of the inequities online today stem from the overly “centralized†nature of the internet’s infrastructure, such that incentives lead towards monopolization of online services – think Facebook and Google. As such, there is a massive interest in owning a piece of the “fuel†that will power the renewed internet infrastructure of the future.
On top of this thesis are companies building utopia as they see it. These ideas range from a system of finance that is open and alternative to banking, a system of identity independent of governments, to other lofty and worthy ideas that would find their homes in the “decentralized internet†category.
Within these two broad categories, there are nuances and further sub-categories, but at the highest level, this is a helpful frame to better understand where a particular project fits, and what alternatives it should be compared against. This framing should also help to better understand why Bitcoin and Ethereum are fundamentally not competing technologies, but why EOS, Tron, and Cardano have yet to prove why they’re contenders to supplant Ethereum, their category king. As with categories in other online industries, we’ll likely see a market where 75% of the value is dominated by the category leader, and the rest spread among its competitors.
With 25-30+ launched or soon-to-be live networks looking to compete in Ethereum’s category, its quickly become saturated. At the current state of adoption in our industry, we’re nearing an oversupply of novel technical solutions and a real need for actual usage. Networks have collapsed into mirror-like narratives (build a dApp here!), use cases (build DeFi here!), and are all seemingly speaking to the same audience.
So when looking at how this market might evolve, the real breakthroughs will likely lie with projects that have a disproportionate chance of dominating these two categories or projects that define a brand new category with massive market potential. More on this next week.
Source: https://www.forbes.com/sites/mattspoke/2019/10/30/key-investment-themes-in-crypto-networks/#78f4be1d3774