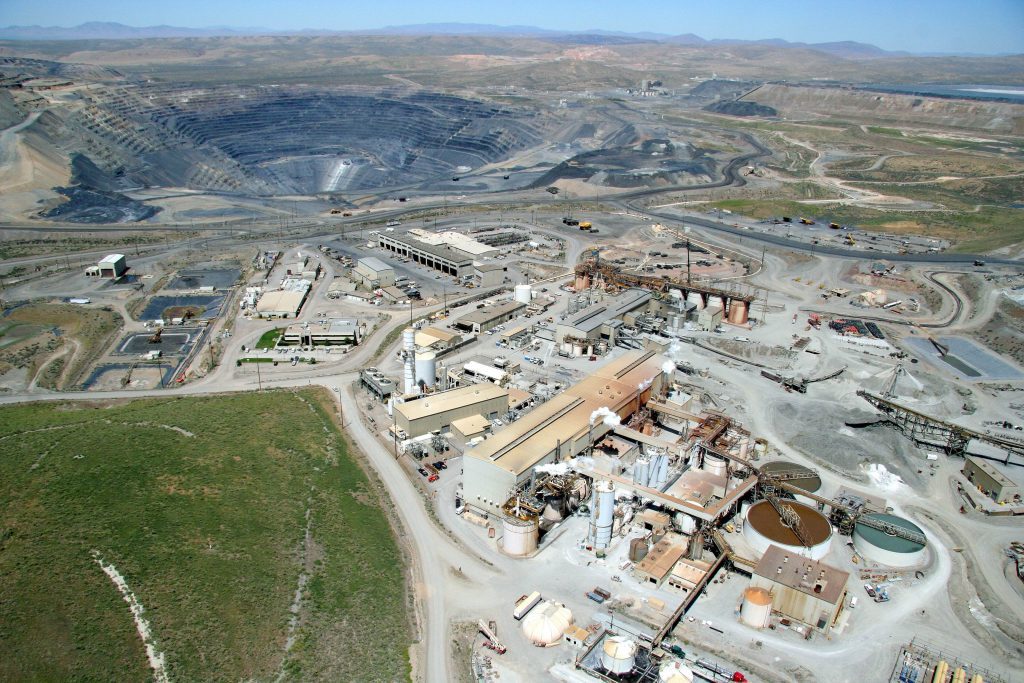
SPONSOR: American Creek owns a 20% Carried Interest to Production at the Treaty Creek Project in the Golden Triangle. 2019’s first hole averaged 0.683 g/t Au over 780m in a vertical intercept. 2020 drilling plans 18,000 to 20,000 metres from 7-10 drill platforms with four diamond drill rigs. The Treaty Creek property is located in the same hydrothermal system as the Pretivm and Seabridge’s KSM deposits and is fully funded for exploration in 2020. Click Here For More Info
Gold continues to deliver strong relative performance and was up 7.31% on a year-to-date basis through Friday’s close. This compares to -20.96% for the S&P 500 Total Return Index.1
| Asset | YTD | 1 YR | 3 YR* | 5 YR* |
| Gold Bullion | 7.31% | 24.33% | 9.07% | 6.32% |
| S&P 500 TR Index | -20.96% | -7.58% | 4.82% | 6.42% |
* Average annual total returns. Bloomberg. Data as of Friday close, 3/27/2020.
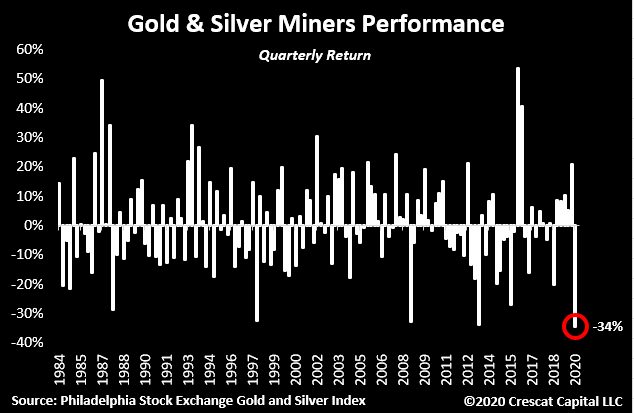
Gold and precious metal equities have been collateral damage during this most recent market correction. The broader markets had become a tinder box with grossly elevated valuation metrics never seen before, coupled with an economy burdened by record amounts of leverage (government, corporate, personal) and widespread investor complacency. All that was required was a spark — enter COVID-19. The speed of the correction was historical. The February to March 30% drawdown was the fastest 30% drawdown of all time (Figure 1).
For us at Sprott, the corresponding selloff in gold bullion and precious metal equities was not surprising. During violent broader market corrections, liquidity is priority number one. This time was no different as broader markets gapped down in response to the greatest demand shock in modern economic history. This resulted in many entities selling gold bullion to meet liquidity requirements that surfaced because of margin calls, and the shuttering of both credit and debt markets. This pattern is similar to what the market witnessed as the Global Financial Crisis (GFC) unfolded in 2008-2009.
Figure 1. Feb.-Mar. 2020 Selloff was the Fastest 30% Drawdown in History
Measured by Number of Days
Source: BofA Global Research, Bloomberg.
Gold Serves its Function as Portfolio Insurance
Before hypothesizing where we will go from here, it is important to highlight that gold bullion has served its function as portfolio insurance. Year to date through March 27, 2020, gold bullion has appreciated 6.84%, while the S&P 500 Index1 has declined 20.96%. At the same time, gold mining equities have not fared as well gold bullion, because during the early stages of a correction, gold stocks are first and foremost stocks; GDX2 was down 10.45% YTD.
The GFC as Playbook
As we are seeing today, there was a material demand shock as the GFC unfolded, with demand across economies declining suddenly and sharply. Although not a perfect analog, the GFC can serve as a playbook. As liquidity became paramount for many market sectors during the GFC, gold bullion was sold to meet liquidity requirements. From the beginning of 2008 to November 12, 2008 (gold bullion’s low price), the S&P 500 fell 41.11%, gold equities (GDX2) cratered 60.60% and gold bullion depreciated by a relatively modest 16.94%. Once the U.S. Federal Reserve (“Fed”) stabilized liquidity conditions, gold bullion and precious metals stocks generated superior absolute and relative returns. From November 12, 2008 to the end of 2009, gold bullion rallied 54.02% and GDX rebounded 138.20%. The S&P 500 declined another 20.62% from November 12, 2008, to its bottom in March 2009 and then appreciated 64.83% to year-end 2009.
Fed Announces Unlimited QE on March 23
This time around, the Fed and the U.S. federal government are pulling no punches. Initially the Fed said it would undertake various operations to provide market liquidity that could total $1.5 trillion. This would include purchases of treasuries across all maturities and repo market operations. President Trump then announced interest on student loans would be waived in addition to a moderate $50 billion emergency aid package. The Fed then announced another $700 billion quantitative easing program which would include purchases of municipal bonds.
This past week, the biggest bazooka of all time was pulled out of the Fed’s arsenal as it amended its previously announced QE program by removing limits on its asset purchases and adding corporate bonds to its list of eligible securities it can purchase. Finally, the U.S. announced a $2.3 trillion fiscal package. The package equates to 10.6% of US GDP. The total budget deficit is expected to widen to at least 11.5% of GDP, which are levels not seen since WWII. The package includes grants (hundreds of billions) and direct payments to taxpayers ($290 billion), both of which are forms of helicopter money.3
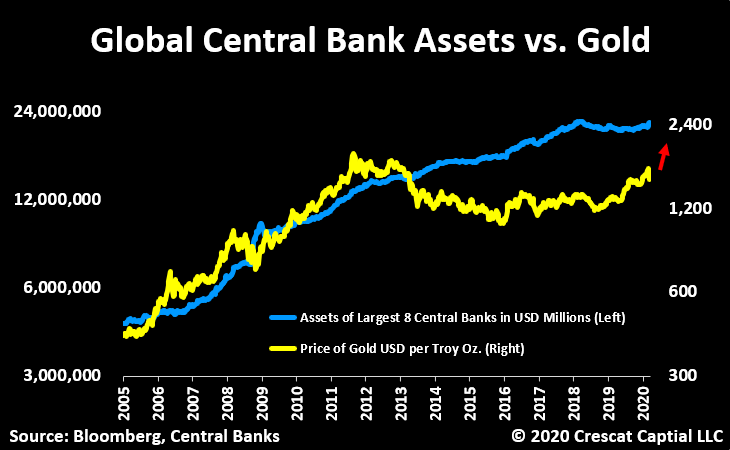
This is very good news for gold bullion and gold equities. There is an 80% correlation between the Fed’s balance sheet and the price of gold bullion. Similar to what occurred during the GFC, gold bullion should move first followed by gold equities (see Figure 2).
A Tailwind for Gold and Gold Stocks
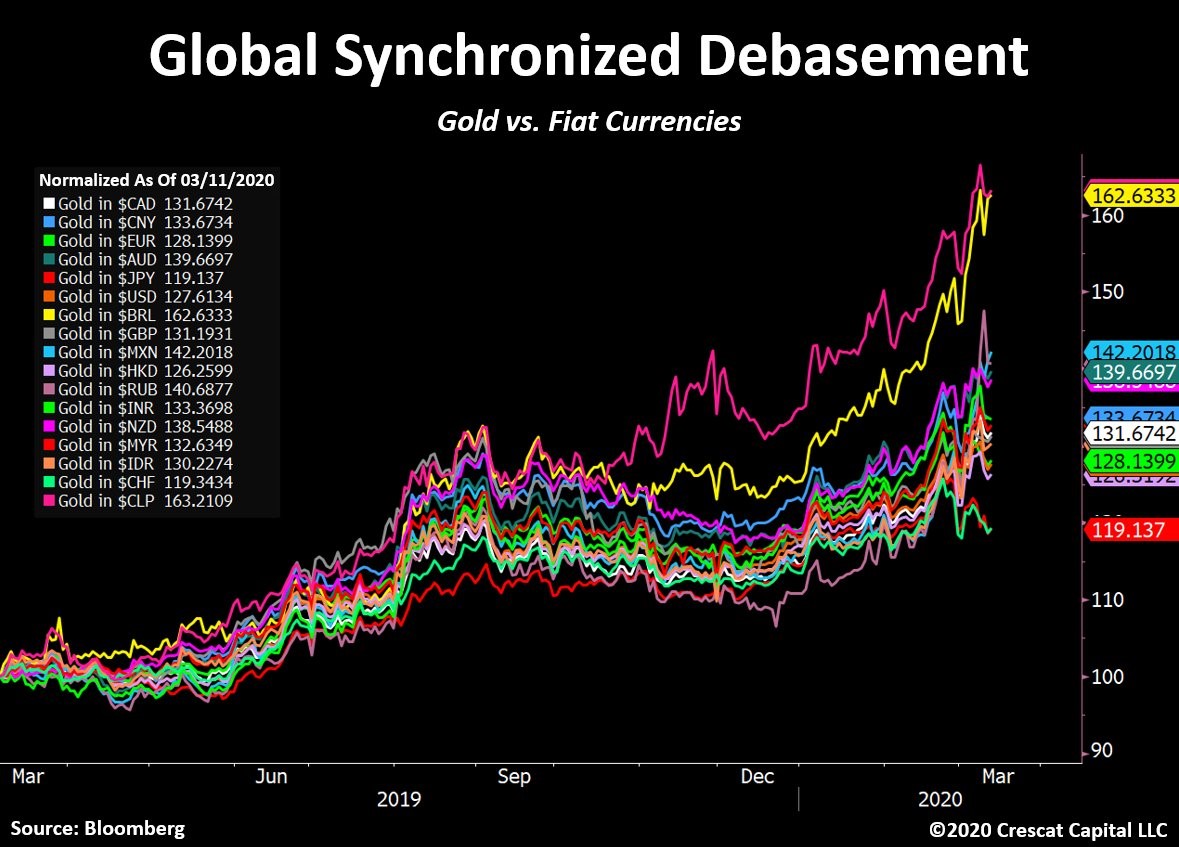
This response has not been limited to the U.S. Globally, we are seeing central banks and governments deploying unprecedented amounts of monetary and fiscal stimulus in response to the economic fallout caused by Covid-19. All these actions should debase fiat currencies while providing a tremendous tailwind for gold bullion and gold equities.
We believe the table is set for a move in gold bullion and gold equities that could dwarf the second half of 2008.
Figure 2. Fed Balance Sheet vs. Price of Gold Bullion and Gold Equities
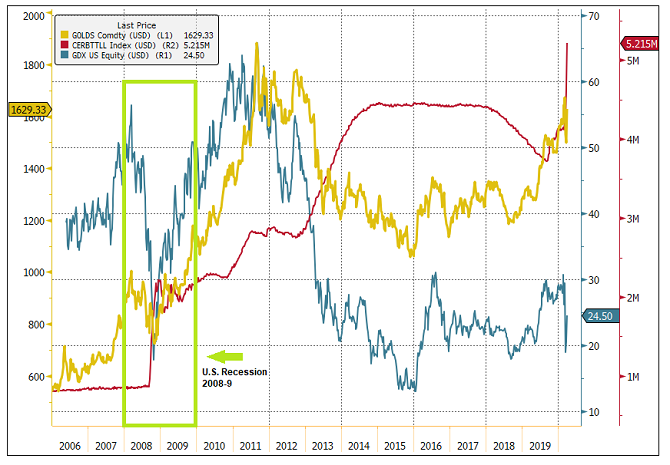
Source: Bloomberg. Data as of 3/27/2020. The red line represents reserve credit outstanding in $ trillions ($5.125 trillion as of 3/27/2020). The yellow line is the gold spot price based on GOLDS Comdty Index. The blue line is the price of gold mining equities represented by GDX.3