Posted by AGORACOM
at 12:23 PM on Thursday, March 5th, 2020
SPONSOR: Labrador Gold – Two successful gold explorers lead the way in the Labrador gold rush targeting the under-explored gold potential of the province. Exploration has already outlined district scale gold on two projects, including a 40km strike length of the Florence Lake greenstone belt, one of two greenstone belts covered by the Hopedale Project. Recently acquired 14km of the potential extension of the new discovery by New Found Gold’s Queensway project to the south.Click Here for More Info
Conglomerate gold player, Novo Resources, has swapped scrip to take a piece of New Found Gold Corp, giving it exposure to the Newfoundland gold prospect
Dr. Quinton Hennigh said: “We
at Novo think the Queensway Project represents a very promising new
high-grade gold discovery. It appears the Queensway Project encompasses
an area highly prospective for high-grade, epizonal orogenic gold
mineralization
TSX-listed, Pilbara-focused gold player, Novo Resources, has acquired
15.97 per cent of New Found Gold Corp via a scrip-for-scrip deal that
gives Novo access to New Found’s stellar gold prospect on the east coast
of Canada. Novo says that the New Found tenement package is the largest
in the Province of Newfoundland and Labrador.
A recent drill intercept at New Found’s Queensway project located
near the town of Gander in central Newfoundland returned 19m at 3 ounces
to the tonne from 98m, including 6m at a staggering 9oz/tonne gold.
Novo says the intercept has an estimated true width of around 70 per
cent of the 19m hit, making it an extraordinary hole.
According to New Found’s management, this drill hole is adjacent to
historical surface workings and only 2km from an historical gold
resource.
Novo said that Eric Sprott, a director of Novo, was sitting on 16.79%
of the issued and outstanding shares of New Found immediately prior to
the acquisition. New Found is considered a non-arm’s length party to
Novo pursuant to TSX Venture Exchange policies and the deal is subject
to the approval of the Exchange.
Under the terms of the acquisition, Novo also has the right to
appoint a director to the board of directors of New Found at any time
for a period of three years from the acquisition date provided that the
company holds no less than 10% of New Found’s issued and outstanding
shares. Novo has also agreed to certain voting restrictions for a period
of three years.
President and Chairman of Novo Resources, Dr. Quinton Hennigh said: “We
at Novo think the Queensway Project represents a very promising new
high-grade gold discovery. It appears the Queensway Project encompasses
an area highly prospective for high-grade, epizonal orogenic gold
mineralization. We are very pleased to have the opportunity to be part
of this exciting discovery and, upon completion of the Acquisition, look
forward to supporting New Found as they advance work around hole
NFGC-19-01 and the many other high-grade showings across the Queensway
Project.â€
Whilst Novo has been and remains focused on delivering its
Pilbara-based conglomerate gold project, the acquisition of an interest
in New Found is the second of its kind for Novo. The TSX-listed company
announced back in January this year that it had subscribed for shares in
ASX-listed Kalamazoo Resources in a financing arrangement that will,
upon closing, give Novo 8.17 per cent of Kalamazoo’s issued and
outstanding shares.
Novo said that Kalamazoo has a string of prospects in the
Bendigo-Castlemaine region of Victoria in Australia and its prospects
have strong similarities to the 1Moz Fosterville gold deposit being
mined underground by TSX-listed Kirkland Lake Gold at an average grade
of 31g/t gold.
Interestingly, Eric Sprott, Novo director, is also a shareholder in Kalamazoo.
With a market cap approaching the equivalent of half a billion
Australian dollars, Novo can make scrip-based acquisitions such as New
Found and Kalamazoo with ease.
The impact on its share capital is minimal but the upside is
potentially serious if either of its current or future based bets come
good – and with 19m going 3 ounces to the tonne, New Found just might
fit into that category.
Posted by AGORACOM
at 11:09 AM on Thursday, March 5th, 2020
Sponsor: Loncor, a Canadian gold explorer controlling over 2,400,000 high grade ounces outside of a Barrick JV. The Ngayu JV property is 200km southwest of the Kibali gold mine, operated by Barrick, which produced 800,000 ounces of gold in 2018. Barrick manages and funds exploration at the Ngayu project until the completion of a pre-feasibility study on any gold discovery meeting their Tier One investment criteria. Newmont $NGT$NEM owns 7.8%, Resolute $RSG owns 27% Click Here for More Info
What if you gave a party and no one came? The Fed found themselves in that embarrassing position on Tuesday as they dumped a .5% drop in the Fed Funds rate onto a startled market. The market wasn’t startled at the interest rate decline, the market was startled because when the Fed spiked the punch one more time no one would drink the Kool Aid.
I’ve said for months the Fed would stick another Band-Aid on a
fatally wounded financial system yet they would fail. I felt that way
because I spent almost two years fighting a useless and pointless war.
You see we are all raised to believe that governments are all
powerful. But if you watch a squadron of 27 B-52s each loaded with 117
bombs carpet sweep an area and your enemy armed only with a bolt action
rifle gets up and shoots back at you, you begin to understand that
government only think they are all powerful. There is always a limit to
power. The Fed just reached it.
The Fed found that out on March 3rd. And it wasn’t even a tiny virus
from a laboratory in Wuhan that defeated the Fed. It was a totally
dysfunctional financial system where outright frauds such as Tesla can
double in a week.
I’ll say it again. The Everything Bubble just burst, some because of
the virus, some because of an out of balance useless financial system
and a lot because of a now broken Just in Time manufacturing system
totally dependent on China.
The metals are going to be included for a period as the margin clerks
man their phones and whisper sweet words of doom to their clients.
Everything is going to get sold. We are going into a massive period of
deflation. At the end all those million dollar MacMansions will be going
for pennies on the dollar. Gold might be $500 an ounce but will buy ten
times what it does today. We have sailed off the edge of the known
world.
I cannot predict the price of gold; many believe in error that they
can. I can just say that after many trials and tribulations the world
will realize that an honest monetary system is the only cure to what
ails us. It will include a jubilee and a metals based currency.
So it would behoove investors to be looking around for production or near production stories.
Someone came to me a week ago with a compelling story of a company
effectively off the radar screens of investors. Part of the reason is
that the founder of Loncor Resources (LN-T) Arnold Kondrat owns 29% of
the shares. Resolute Mining owns another 27% and Newmont 7.6%. With 64%
of the shares in the strongest of strong hands, there hasn’t been all
that much inclination to tell their story.
Loncor operates in the DRC, the Democratic Republic of the Congo. The
company has such a massive land position that it’s fairly hard to
understand why they have been so far off the radar of investors.
Loncor has 43-101 gold ounces of over 2.4 million. To use USD
figures, at today’s stock price Loncor is worth $19 per ounce in the
ground of gold. That no doubt will tend to set a floor under the price.
At their stage of development they should be getting more like $50-$60
USD an ounce.
It’s pretty hard to fathom the incredible size of Loncor’s land
position in the DRC. They hold 3,534 square km in the Ngayu greenstone
belt with similar endowment and geology with the greenstone belt to
their east in Tanzania home to several big gold mines. Within their
Ngayu land position they have a joint venture with Barrick on 1,894
square km of the total property. Barrick has an active trenching and
ground sampling program and is preparing to drill some of the six drill
ready targets already identified. Drilling begins this month.
The JV with Barrick is interesting. First of all, Barrick knows the
greenstone belt with big mines both in the DRC and in Tanzania. Barrick
wants at least four million ounces and would prefer high grade. Barrick
funds and runs the exploration program across the 1,894 square km all
the way to completion of a pre-feasibility study.
The DRC has a 10% carried interest and Barrick will have 65% of the
remainder with Loncor getting the remaining 35% of what is left after
the DRC gets their cut. At that point Loncor pays their own way on their
piece of the pie.
In Loncor’s fact sheet
they mention something interesting. Loncor’s Ngayu Greenstone belt is
home to a 130 km BIF. (Banded Iron Formation) Readers with a really good
memory may recall me writing about BIF
before when I was talking about where the gold showed up in the Western
Australia Pilbara Basin, also near the giant iron projects of WA.
Basically the iron was dissolved in seawater. When single cell
cyanobacteria began to produce oxygen some 3 billion years or so ago, as
the chemistry of the water changed, the iron precipitated out of
solution. Quinton Hennigh came up with the theory years ago that that is
how the world’s biggest gold properties got their gold. Gold and BIF
are similar in age and where you find one, you almost always find the
other.
Loncor is cheap. Yes, they may get cheaper but I find them attractive
enough that I bought some shares in the open market. Investors are
probably going to find it difficult to pick up a large position. The
shares pretty much trade by appointment. With a Barrick JV and with gold
in the ground at $19 an ounce in USD I don’t expect them to remain
cheap for long.
Loncor is an advertiser. I own shares. That makes me biased. I don’t
share in your gains or losses so take some responsibility for your own
trading decisions. It’s your money after all.
Posted by AGORACOM
at 9:38 AM on Wednesday, March 4th, 2020
P&E Mining Consultants Inc. Provides Drill Hole Spacing Recommendation for the 2020 Drill Plan
Calculations include credit for previously analyzed values for Cu and Ag
Newly discovered NE Extension within the 300 Horizon. The gold-only result of 1.27 gpt Au over a 252 metre (m) interval increased to 1.51 gpt AuEq, an increase of 18.9%.
Cardston, Alberta–(Newsfile Corp. – March 4, 2020) – American Creek Resources Ltd. (TSXV: AMK) (the “Company”)
is pleased to announce the results of gold-equivalent (AuEq)
calculations for all drilling completed at JV partner Tudor Gold’s
(“Tudor”) flagship project Treaty Creek. These calculations include
credit for previously analyzed values for Cu and Ag. Geological analysis
and reinterpretation of all the drill holes to date exposed a new
copper horizon (CS 600 horizon) as well as significant silver and copper
mineralization throughout the Goldstorm system.
The strongest AuEq increase was seen in the newly discovered NE Extension within the 300 Horizon. The
gold-only result of 1.27 gpt Au over a 252 metre (m) interval increased
to 1.51 gpt AuEq (with 13.8 gpt Ag and 504 ppm Cu), an increase of
18.9%.
All drill holes at Goldstorm Zone had
significant increases to the composite results when the AuEq values for
the copper and silver mineralization were included however when the
drill holes intersected the CS-600 Horizon, the copper values within
this mineralized body had the greatest impact to an individual horizon
with up to 79.8% increase to the AuEq value from a gold-only 0.39 gpt Au over 150m to 0.70 gpt AuEq over the same 150m interval.
P&E Mining Consultants Inc. were
retained to assess all Goldstorm drill hole results and historical data
in order to render an opinion as to the consistency of the gold
mineralization as well to ascertain the recommended drill hole spacing
that would be required to potentially derive an Indicated Mineral
Resource and a Measured Mineral Resource. P&E Mining Consultants
Inc. concluded the following:
“Three dimensional continuity analyses
of the Treaty Creek drill hole assay results were carried out for the
Goldstorm Zone. The regional geological trend was used to guide the
selection of horizontal, across-strike, and dip-plane directions during
variogram fan analysis. Variogram fans were generated separately for Ag,
Au, Cu, Pb, and Zn uncapped composite samples in each zone.
All modeled semi-variograms display a
very low nugget effect, and display long range continuity down the
plunge of the mineralization and along the regional strike of the
deposits.
For the Goldstorm Zone, a drill spacing
of 200 m is recommended for Indicated Mineral Resources, and 100 m for
Measured Mineral Resources.”
Tudor’s goal is to design a diamond drill
hole program that will fast-track the exploration program for 2020 with
the objective to begin the Mineral Resource Estimate work as soon as
possible.
Vice President of Project Development Ken Konkin P.Geo. comments:
“We are very encouraged to see that the silver and copper
mineralization has made an important impact to the AuEq results from our
recent drilling as well as the historical drilling. The next step is to
plan the drill hole program for the 2020 exploration season. We
continue to work with our Mineral Resource Estimate geologists and
engineers from P&E Mining Consultants to plan the drill hole program
in order to optimize the drilling and to attempt to fast-track the
exploration program for this coming drill season
Table l provides gold equivalent composites from the 2019 drilling
and all historical drilling within the Goldstorm Zone. Table ll contains
the drill data including collar location, depth of drill holes as well
as the dip and azimuth for all drill hole.
TABLE l: Au Eq COMPOSITES GOLDSTORM ZONE
Section
HOLE ID
From
To
Interval (m)
AuEq g/t
Au g/t
Ag g/t
Cu ppm
% increase
Horizon
107+00 NE
CB-17-29
1.20
575.00
573.80
0.321
0.278
0.9
224
15.5%
300
107+00 NE
CB-17-29
60.50
333.50
273.00
0.435
0.392
1.1
197
11.0%
300
107+00 NE
CB-17-29
60.50
176.00
115.50
0.728
0.685
1.9
142
6.3%
300
107+00 NE
CB-18-32
196.50
783.50
587.00
0.542
0.497
1.6
177
9.1%
300 + CS600
107+00 NE
CB-18-32
196.50
316.50
120.00
1.082
1.045
1.7
106
3.5%
300
107+00 NE
CB-18-34
419.00
711.50
292.50
0.499
0.461
2.4
63
8.2%
300
107+00 NE
CB-18-34
831.50
897.50
66.00
0.290
0.221
1.3
361
31.2%
CS600
108+00 NE
CB-17-09
41.00
545.00
504.00
0.549
0.488
2.3
225
12.5%
300
108+00 NE
CB-17-09
41.00
200.00
159.00
0.782
0.708
2.9
261
10.5%
300
108+00 NE
CB-17-12
3.00
243.50
240.50
0.848
0.797
2.6
139
6.4%
300
108+00 NE
CB-17-12
33.00
224.00
191.00
0.979
0.923
3.0
134
6.1%
300
108+00 NE
CB-17-24
3.50
563.00
559.50
0.618
0.576
2.0
121
7.3%
300
108+00 NE
CB-17-24
62.00
275.00
213.00
1.018
0.945
3.9
180
7.7%
300
108+00 NE
CB-17-24
3.50
686.00
682.50
0.563
0.498
1.8
288
13.1%
300
108+00 NE
CB-18-36
659.50
772.00
112.50
0.487
0.454
1.8
74
7.3%
300
108+00 NE
CB-18-36
659.50
704.50
45.00
0.733
0.688
2.7
88
6.5%
300
108+00 NE
CB-18-36
682.00
703.00
21.00
1.101
1.035
4.6
79
6.4%
300
108+00 NE
CB-18-38
20.50
638.00
617.50
0.465
0.429
1.3
137
8.4%
300
108+00 NE
CB-18-38
248.50
353.00
104.50
0.733
0.639
3.4
360
14.7%
300
108+00 NE
CB-18-38
468.50
638.00
169.50
0.683
0.659
1.1
76
3.6%
300
108+00 NE
GS-19-40
23.00
350.00
327.00
0.501
0.443
1.72
251
13.1%
300
108+00 NE
GS-19-40
81.50
127.00
45.50
1.060
0.907
4.92
634
16.9%
300
108+00 NE
GS-19-41
27.50
353.00
325.50
0.724
0.589
5.25
480
22.9%
300
108+00 NE
GS-19-41
47.00
146.00
99.00
1.252
1.015
9.83
800
23.3%
300
109+00 NE
CB-16-03
88.00
708.00
620.00
0.582
0.534
1.5
202
9.0%
300
109+00 NE
CB-16-03
112.00
426.00
314.00
0.792
0.733
2.2
220
8.0%
300
109+00 NE
CB-17-04
152.10
327.00
174.90
0.827
0.803
1.0
76
3.0%
300
109+00 NE
CB-17-27
12.50
536.00
523.50
0.688
0.640
1.6
197
7.5%
300
109+00 NE
CB-17-27
12.50
350.00
337.50
0.807
0.758
2.0
169
6.5%
300
109+00 NE
CB-18-31
404.00
680.50
276.50
0.526
0.494
1.4
100
6.5%
300
109+00 NE
CB-18-31
481.00
597.00
116.00
0.773
0.732
1.8
124
5.6%
300
109+00 NE
CB-18-33B
599.00
623.00
24.00
0.435
0.367
5.4
22
18.5%
300
109+00 NE
GS-19-43
68.00
561.50
493.50
0.608
0.566
1.36
174
7.4%
300 + CS600
109+00 NE
GS-19-43
141.50
197.00
55.50
1.068
1.005
2.62
211
6.3%
300
109+00 NE
GS-19-43
405.50
561.50
156.00
0.785
0.718
1.50
325
9.3%
CS600
109+00 NE
GS-19-44
101.00
368.00
267.00
0.867
0.807
3.30
134
7.4%
300
109+00 NE
GS-19-44
125.00
275.00
150.00
1.143
1.065
4.62
151
7.3%
300
109+00 NE
GS-19-45
44.00
369.50
325.50
0.765
0.719
1.91
154
6.4%
300
109+00 NE
GS-19-45
62.00
278.00
216.00
0.947
0.901
2.27
122
5.1%
300
109+00 NE
GS-19-45
105.00
278.00
173.00
1.054
1.000
2.63
144
5.4%
300
109+00 NE
GS-19-46
34.50
628.50
594.00
0.550
0.510
1.31
165
7.8%
300 + CS600
109+00 NE
GS-19-46
175.50
337.50
162.00
0.778
0.734
1.93
135
6.0%
300
109+00 NE
GS-19-46
564.00
600.00
36.00
1.425
1.328
1.12
560
7.3%
CS600
110+00 NE
CB-17-06
182.50
589.50
407.00
0.767
0.675
3.1
369
13.6%
300
110+00 NE
CB-17-06
222.00
393.50
171.50
0.914
0.814
3.7
379
12.3%
300
110+00 NE
CB-17-07
99.50
530.00
430.50
0.697
0.625
2.4
293
11.5%
300
110+00 NE
CB-17-07
162.50
309.50
147.00
1.155
1.028
4.9
457
12.4%
300
110+00 NE
CB-18-37B
125.00
819.50
694.50
0.502
0.459
1.2
196
9.4%
300
110+00 NE
CB-18-37B
300.50
423.50
123.00
1.002
0.944
2.0
234
6.1%
300
110+00 NE
CB-18-37B
125.00
912.00
787.00
0.473
0.427
1.2
212
10.8%
300 + CS600
110+00 NE
GS-19-50
148.00
725.50
577.50
0.681
0.602
1.99
372
13.1%
300 + CS600
110+00 NE
GS-19-50
160.00
427.00
267.00
0.878
0.811
2.67
300
8.3%
300
110+00 NE
GS-19-50
652.00
736.00
84.00
0.816
0.571
2.53
1444
42.9%
CS600
110+00 NE
GS-19-51
119.00
365.00
246.00
0.777
0.722
2.31
187
7.6%
300
110+00 NE
GS-19-51
578.00
618.50
40.50
1.304
1.019
2.94
1693
28.0%
CS600
110+00 NE
GS-19-53
108.00
255.00
147.00
1.036
0.984
3.07
98
5.3%
300
111+00 NE
CB-18-39
141.50
705.30
563.80
1.086
0.981
4.4
352
10.7%
300
111+00 NE
CB-18-39
141.50
422.00
280.50
1.274
1.141
5.5
449
11.7%
300
111+00 NE
CB-18-39
539.00
695.00
156.00
1.247
1.154
4.6
257
8.1%
300
111+00 NE
GS-19-48
97.50
1024.50
927.00
0.793
0.677
3.00
543
17.1%
300 + CS600
111+00 NE
GS-19-48
97.50
426.00
328.50
1.152
1.048
4.30
354
9.9%
300
111+00 NE
GS-19-48
871.50
940.50
69.00
1.483
0.937
3.90
3364
58.3%
CS600
111+00 NE
GS-19-49
81.00
907.50
826.50
0.800
0.696
3.40
429
14.9%
300 + CS600
111+00 NE
GS-19-49
81.00
330.00
249.00
1.080
0.998
5.10
137
8.2%
300
111+00 NE
GS-19-49
483.00
606.00
123.00
1.042
0.941
1.80
538
10.7%
300
111+00 NE
GS-19-49
747.00
832.50
85.50
1.494
1.067
10.50
2035
40.0%
CS600
111+00 NE
GS-19-52
62.00
663.50
601.50
0.783
0.668
3.25
513
17.2%
300 + CS600
111+00 NE
GS-19-52
62.00
398.00
336.00
1.062
1.004
2.65
182
5.8%
300
111+00 NE
GS-19-52
513.50
663.50
150.00
0.703
0.391
6.49
1583
79.8%
CS600
112+50 NE
GS-19-42
63.50
843.50
780.00
0.849
0.683
5.80
650
24.3%
300 + CS600
112+50 NE
GS-19-42
63.50
434.00
370.50
1.275
1.097
10.00
393
16.2%
300
112+50 NE
GS-19-42
63.50
315.50
252.00
1.508
1.268
13.80
504
18.9%
300
112+50 NE
GS-19-42
717.70
843.50
125.80
0.902
0.522
3.80
2253
72.8%
CS600
114+00 NE
GS-19-47
117.50
1199.00
1081.50
0.697
0.589
3.40
450
18.3%
300 + CS600 + DS
114+00 NE
GS-19-47
200.00
501.50
301.50
0.867
0.828
2.10
96
4.7%
300
114+00 NE
GS-19-47
665.00
816.50
151.50
1.009
0.572
8.90
2228
76.4%
CS600
114+00 NE
GS-19-47
933.50
1176.50
243.00
0.996
0.908
4.80
207
9.7%
DS
* All assay grades are uncut and intervals reflect drilled intercept
lengths. True widths have not been determined as the mineralized body
remains open in all directions. Further drilling is required to
determine the mineralized body orientation and true widths.
HQ and NQ2 diameter core samples were sawn in half and typically sampled at standard 1.5m intervals.
**Metal prices used to calculate the AuEq metal content are: Gold
$1322/oz, Ag: $15.91/oz, Cu: $2.86/lb. All metals are reported in USD
and calculations do not consider metal recoveries
The goal is to design a diamond drill hole program for the 2020
exploration program with the objective to begin the Mineral Resource
Estimate work at the end of the 2020 field season. Tudor hopes to
accomplish as much drilling needed to bring a Measured and Indicated
Mineral Resource Estimate forward as quickly as possible.
Walter Storm, President and CEO, stated: “These
new gold equivalents are extremely encouraging as our technical team
continues to take positive steps advancing Tudor Gold’s flagship Treaty
Creek Au-Ag-Cu project. Furthermore we received good news from P&E
Mining Consultants Inc. that the drill hole spacing required to derive a
Measured Resource is 100 meters due to the homogenous nature of the
AuEq composites obtained to-date. During the new few weeks, our
geologist and engineers will continue to work with the geological model
and begin to prepare the diamond drill hole proposal for 2020.”
The Treaty Creek Project is a Joint Venture with Tudor Gold owning
3/5th and acting as operator. American Creek and Teuton Resources each
have a 1/5th interest in the project. American Creek and Teuton are both
fully carried until such time as a Production Notice is issued, at
which time they are required to contribute their respective 20% share of
development costs. Until such time, Tudor is required to fund all
exploration and development costs while both American Creek and Teuton
have “free rides”.
QA/QC
Drill core samples were prepared at MSA Labs’ Preparation Laboratory
in Terrace, BC and assayed at MSA Labs’ Geochemical Laboratory in
Langley, BC. Analytical accuracy and precision are monitored by the
submission of blanks, certified standards and duplicate samples inserted
at regular intervals into the sample stream by Tudor Gold personnel.
MSA Laboratories quality system complies with the requirements for the
International Standards ISO 17025 and ISO 9001. MSA Labs is independent
of the Company.
Qualified Person
The Qualified Person for this news release for the purposes of
National Instrument 43-101 is the Company’s Vice President of Project
Development, Ken Konkin, P.Geo. He has read and approved the scientific
and technical information that forms the basis for the disclosure
contained in this news release.
About American Creek
American Creek holds a strong portfolio of gold and silver properties
in British Columbia. The portfolio includes three gold/silver
properties in the heart of the Golden Triangle; the Treaty Creek and
Electrum joint ventures with Walter Storm/Tudor, as well as the recently
acquired 100% owned past producing Dunwell Mine. Other properties held
throughout BC include the Gold Hill, Austruck-Bonanza, Ample Goldmax,
Silver Side, and Glitter King.
For further information please contact Kelvin Burton at: Phone: 403 752-4040 or Email: [email protected]. Information relating to the Company is available on its website at www.americancreek.com
Posted by AGORACOM-JC
at 1:08 PM on Tuesday, March 3rd, 2020
Highlights:
Option to acquire 100% of two licenses from Shawn Ryan in an area of excellent infrastructure.
Licenses cover over 14km of the potential extension of the
Appleton fault zone associated with many of the gold showings, including
the new discovery, on New Found Gold’s Queensway project to the south.
The two licenses represent the most prospective areas for
gold of a 45km by 15km regional till and vegetation sampling program
conducted over 3 years.
VANCOUVER, British Columbia, March 03, 2020 – Labrador Gold Corp. (TSX-V: LAB) (“LabGold†or the “Companyâ€) is pleased to announce the acquisition of two licenses near Gander, Newfoundland from Shawn Ryan. The licenses are along strike to the northeast of the recently announced gold discovery of New Found Gold of 92.86g/t Au over 19 metres in Hole NFGC-01 on their Queensway Project. The licenses, Gander South and Gander North, consist of 264 claims covering an area of 6,600 hectares (66 square kilometres). Note that gold values in adjacent properties in similar rocks are not indicative of mineralization on the Gander licenses.
The company has the option to acquire a 100% interest in the two licenses subject to TSX Venture Exchange approval as follows:
Payment of $1,250,000 cash and issue 2 million shares as follows: $250,000 cash and 400,000 shares following TSX venture exchange approval $150,000 cash and 250,000 shares on the first anniversary of the option agreement; $150,000 cash and 300,000 shares on the second anniversary of the option agreement; $200,000 cash and 350,000 shares on the third anniversary of the option agreement; $250,000 cash and 400,000 shares on the fourth anniversary of the option agreement and $250,000 cash and 300,000 shares on the fifth anniversary of the option agreement.
Additional payments based on exploration expenditures will be made as follows: $750,000 on $10 million expenditure on one of the licenses $750,000 on $20 million expenditure on one of the licenses $750,000 on $30 million expenditure on one of the licenses
The Company will also grant a 1% net smelter return royalty (NSR) to
the Vendor plus $1 per ounce of gold in a measured and indicated
resource. An advance royalty of $50,000 per annum for each property will
be payable starting in 2026.
The Company also undertakes to spend $750,000 on each license over the first four years.
“I am very happy to see this district is getting the attention it
deserves,†said Shawn Ryan, Technical Advisor to LabGold. “I started
with 2,200 claims in 2016, and with over 1700 till samples and 3,700
vegetation samples taken over an area of 45km by 15km in 3 years have
whittled it down to the most prospective 264 claims. I am looking
forward to continuing my relationship with LabGold to aggressively
explore these licenses.â€
The two licenses cover over 14 kilometres of strike length of the
potential Appleton fault zone extension. The Appleton fault zone is
associated with many of the gold showings, including the new discovery,
on New Found Gold’s Queensway project to the south. Exploration over the
past four years including till, vegetation and soil sampling has
demonstrated the prospectivity of the licences, particularly along the
extension of the crustal scale Appleton fault zone.
Roger Moss, President and CEO, stated: “We are very happy to continue
our relationship with Shawn and work together to discover more gold
along the same structural trend that hosts the recent New Found Gold
Discovery. We believe this area has great potential for the discovery of
orogenic gold deposits associated with deep seated structures. Work
already completed on the licenses to date indicates significant gold
anomalies in till, vegetation and soil samples along the extension of
the Appleton fault zone. We intend to systematically explore this very
prospective trend during 2020 to delineate drill targets.â€
The licenses occur in an area of excellent infrastructure, situated
just 16km northwest of the town of Gander with good road access, nearby
electricity and abundant water.
Roger Moss, PhD., P.Geo., is the qualified person responsible for all technical information in this release.
About Labrador Gold:
Labrador Gold is a Canadian based mineral exploration company focused
on the acquisition and exploration of prospective gold projects in the
Americas. In 2017 Labrador Gold signed a Letter of Intent under which
the Company has the option to acquire 100% of the Ashuanipi property in
northwest Labrador and the Hopedale property in eastern Labrador.
The Hopedale property covers much of the Florence Lake greenstone
belt that stretches over 60 km. The belt is typical of greenstone belts
around the world but has been underexplored by comparison. Initial work
by Labrador Gold during 2017 show gold anomalies in soils and lake
sediments over a 3 kilometre section of the northern portion of the
Florence Lake greenstone belt in the vicinity of the known Thurber Dog
gold showing where grab samples assayed up to 7.8g/t gold. In addition,
anomalous gold in soil and lake sediment samples occur over
approximately 40 kilometres along the southern section of the greenstone
belt (see news release dated January 25th, 2018 for more details).
The Ashuanipi gold project is located just 35 km from the historical
iron ore mining community of Schefferville, which is linked by rail to
the port of Sept Iles, Quebec in the south. The claim blocks cover large
lake sediment gold anomalies that, with the exception of local
prospecting, have not seen a systematic modern day exploration program.
Results of the 2017 reconnaissance exploration program following up the
lake sediment anomalies show gold anomalies in soils and lake sediments
over a 15 kilometre long by 2 to 6 kilometre wide north-south trend and
over a 14 kilometre long by 2 to 4 kilometre wide east-west trend. The
anomalies appear to be broadly associated with magnetic highs and do not
show any correlation with specific rock types on a regional scale (see
news release dated January 18th, 2018). This suggests a possible
structural control on the localization of the gold anomalies. Historical
work 30 km north on the Quebec side led to gold intersections of up to
2.23 grams per tonne (g/t) Au over 19.55 metres (not true width)
(Source: IOS Services Geoscientifiques, 2012, Exploration and geological
reconnaissance work in the Goodwood River Area, Sheffor Project, Summer
Field Season 2011). Gold in both areas appears to be associated with
similar rock types.
The Company has 57,039,022 common shares issued and outstanding and trades on the TSX Venture Exchange under the symbol LAB.
Neither TSX Venture Exchange nor its Regulation Services
Provider (as that term is defined in policies of the TSX Venture
Exchange) accepts responsibility for the adequacy or accuracy of this
release.
Posted by AGORACOM
at 10:09 AM on Tuesday, March 3rd, 2020
Loncor Resources Inc. (“Loncor” or the “Company“)
(TSX: “LN”; OTCQB: “LONCF”) is pleased to announce the appointment of
Mr. John Barker as Vice President of Business Development for Loncor.
Arnold Kondrat, Chief Executive Officer of Loncor, commented: “We
welcome John Barker as Vice President of Business Development for
Loncor. Mr. Barker has over 30 years of global mining experience
encompassing many key elements of the mining world, and I look forward
to working with him and the team to unlock the potential evident in the
Ngayu gold belt.â€
Mr.
Barker has 15 years’ experience as a leading mining analyst, including
with RBC DS heading up their Global Gold Mining initiative and focussing
on African mining equities. Subsequently, he was Vice President
Corporate Development for TSX-listed SouthernEra Resources, which was
taken over by Lonmin, and was instrumental in the Guinor Gold sale to
Crew Gold. More recently he has been involved in various copper,
diamond and platinum initiatives in Southern Africa. During his career
he has been involved in numerous asset sales and equity issues raising
over US$600m in Canada, Australia, Europe and RSA. Mr. Barker
commented: “Loncor
offers the chance to get involved in a region of the world that is only
now starting to show its true gold producing potential through the
success of the Barrick-operated Kibali gold mine. The Ngayu belt holds
the potential of similar discoveries and I am excited on helping the
company utilise its vast in-country experience to realise value for all.â€
About Loncor Resources Inc. Loncor
is a Canadian gold exploration company focussed on the Ngayu Greenstone
Belt in the Democratic Republic of the Congo (the “DRCâ€).
The Loncor team has over two decades of experience of operating in the
DRC. Ngayu has numerous positive indicators based on the geology,
artisanal activity, encouraging drill results and an existing gold
resource base. The area is 200 kilometres southwest of the Kibali gold
mine, which is operated by Barrick Gold (Congo) SARL (“Barrickâ€).
In 2019, Kibali produced record gold production of 814,000 ounces at
“all-in sustaining costs†of US$693/oz. Barrick has highlighted the
Ngayu Greenstone Belt as an area of particular exploration interest and
is moving towards earning 65% of any discovery in 1,894 km2 of Loncor
ground that they are exploring. As per the joint venture agreement
signed in January 2016, Barrick manages and funds exploration on the
said ground at the Ngayu project until the completion of a
pre-feasibility study on any gold discovery meeting the investment
criteria of Barrick. In a recent announcement Barrick highlighted six
prospective drill targets and are moving towards confirmation drilling
in early 2020. Subject to the DRC’s free carried interest requirements,
Barrick would earn 65% of any discovery with Loncor holding the balance
of 35%. Loncor will be required, from that point forward, to fund its
pro-rata share in respect of the discovery in order to maintain its 35%
interest or be diluted.
In
addition to the Barrick JV, certain parcels of land within the Ngayu
project surrounding and including the Makapela and Adumbi deposits have
been retained by Loncor and do not form part of the joint venture with
Barrick. Barrick has certain pre-emptive rights over the Makapela
deposit. Loncor’s Makapela deposit has an Indicated Mineral Resource of
614,200 ounces of gold (2.20 million tonnes grading 8.66 g/t Au) and an
Inferred Mineral Resource of 549,600 ounces of gold (3.22 million
tonnes grading 5.30 g/t Au). Adumbi and two neighbouring deposits hold
an Inferred Mineral Resource of 1.675 million ounces of gold (20.78
million tonnes grading 2.5 g/t Au), with 71.25% of this resource being
attributable to Loncor via its 71.25% interest.
Resolute
Mining Limited (ASX/LSE: “RSG”) owns 25% of the outstanding shares of
Loncor and holds a pre-emptive right to maintain its pro rata equity
ownership interest in Loncor following the completion by Loncor of any
proposed equity offering. Newmont Goldcorp Corporation (NYSE: “NEM”;
TSX: “NGT”) owns 7% of Loncor’s outstanding shares.
Additional information with respect to Loncor and its projects can be found on Loncor’s website at www.loncor.com
Posted by AGORACOM
at 10:02 AM on Tuesday, March 3rd, 2020
Affinity Metals Corp. (TSXV: AFF) (“Affinity” or the “Company“) announces that it has closed the first tranche (the “First Tranche“) of its non-brokered private placement (the “Offering“)
previously announced on February 6, 2020. Under the First Tranche, the
Company has issued 1,960,000 units for gross proceeds of $392,000. No
finder’s fees were paid in connection with the First Tranche.
All
securities issued under the First Tranche are subject to a hold period
expiring June 29, 2020, in accordance with applicable securities laws
and the policies of the TSX Venture Exchange.
A company owned by Sean Pownall, a director of the Company (the “Insider“),
participated in the private placement and purchased 625,000 units for
aggregate gross proceeds of $125,000. Participation by the Insider in
the private placement is considered a “related party transaction”
pursuant to Multilateral Instrument 61-101 – Protection of Minority Security Holders in Special Transactions (“MI 61-101“).
The Company is exempt from the requirements to obtain a formal
valuation and minority shareholder approval in connection with the
Insider’s participation in the private placement in reliance of sections
5.5(a) and 5.7(a) of MI 61-101, respectively, on the basis that
participation in the Offering by the Insider did not exceed 25% of the
fair market value of the Company’s market capitalization The Company did
not file a material change report at least 21 days prior to the First
Tranche closing of the Offering as participation of the Insider had not
been confirmed at that time.
This
news release does not constitute an offer to sell or a solicitation of
an offer to buy any of the securities in the United States of America.
The securities have not been and will not be registered under the United
States Securities Act of 1933 (the “1933 Act”) or any state securities
laws and may not be offered or sold within the United States or to U.S.
Persons (as defined in the 1933 Act) unless registered under the 1933
Act and applicable state securities laws, or an exemption from such
registration is available.
About Affinity
Affinity
is a Canadian mineral exploration company focused on advancing the
Regal polymetallic project located near Revelstoke, British Columbia,
Canada.
Information related to the Company and the Regal project can be found on the Company’s website at:www.affinity-metals.com.
On behalf of the Board of Directors
Robert Edwards CEO and Director of Affinity Metals Corp. The Company can be contacted at: [email protected] or by phone at 604-227-3554.
Posted by AGORACOM
at 9:21 AM on Thursday, February 27th, 2020
Cardston, Alberta–(February 27, 2020) – American Creek Resources
Ltd. (TSXV: AMK) (“the Corporation”) is pleased to report the assays
from phase 1 drilling from the 2019 fall drill program that was
conducted at the company’s 100% owned Dunwell Mine property located in
the Golden Triangle of British Columbia.
The Dunwell Mine is a high-grade past producing polymetallic mine
located just 8km by road from the shipping town of Stewart. This
property boasts exceptional logistics and a rich mining history with
significant potential for future development. A significant geological
feature running through the property is the Portland Canal Fissure Zone.
With the recent acquisition of the Glacier Creek claims American Creek
now controls 5km of the 6.5km Portland Canal Fissure Zone which contains
numerous high-grade polymetallic mineral occurrences including two past
producing mines (the Dunwell and Portland Canal). Very little modern
exploration has been done on the property. While there is huge potential
exploring along the extended reaches of the fissure zone, the initial
drill program was designed to test areas near the workings of the
Dunwell mine itself.
The initial objective for the drill program was to test the down dip
extension of the Dunwell main vein below sub-level 4. The second
objective was to test geophysical anomalies from an Induced Polarization
(IP) survey conducted later in the fall of 2019. Both of these
objectives were successfully accomplished with this drill program.
A total of 20 holes totaling 3,245.9m were completed on the property.
The first 14 holes were based on geological and historical data and
were successful in encountering veins of high-grade polymetallic
mineralization including 20.3 g/t AuEq over 2.7m, 18.4 g/t AuEq over 1.5m, 28.6 g/t AuEq over 0.5m and 24.4 g/t AuEq over 0.5m.
Holes DW19-04 to DW19-08 were drilled to test the down dip of the Dunwell zone below sub-level 4.
Results show high-grade hits, including 13.2 g/t AuEq,
in this series of holes that traversed from the east southeast to the
east. The holes consistently hit two zones, both at the base of dikes at
22 – 26 meters and 83 – 87 meters. These two zones, seen in the five
holes, run sub-parallel to the fault the drill pad was located on and
trend for some distance to the north.
Hole DW19-09 was drilled to test the north extension of the main zone
below level 4. The first breccia below the dike shows up in this hole
with a 28.5 g/t AuEq assay and the second with a 18.4 g/t AuEq assay.
HOLE
FROM (m)
TO (m)
INTERVAL (m)
AU g/t
AG g/t
CU %
PB %
ZN %
AuEq g/t
DW19-09
27.60
28.05
0.45
13.870
258.0
0.438
15.530
11.040
28.509
DW19-09
143.02
144.52
1.50
7.898
84.9
0.359
0.791
20.250
18.440
Hole DW19-10 was drilled to test below sub-level 4 but further to the southeast from hole DW19-04.
HOLE
FROM (m)
TO (m)
INTERVAL (m)
AU g/t
AG g/t
CU %
PB %
ZN %
AuEq g/t
DW19-10
29.00
29.57
0.57
2.785
42.5
0.055
0.713
3.020
4.956
DW19-10
88.71
89.61
0.90
3.535
43.2
0.060
1.480
2.860
5.959
DW19-10
99.13
99.79
0.66
1.707
33.7
0.031
0.285
0.529
2.491
The two breccias below the dikes, seen in holes 7 and 8 are present.
Holes 11 to 13 were drilled to follow up on the results from hole 9.
The holes were drilled in a fan where holes 11 and 12 were drilled at a
steeper angle to test below hole 9 and hole 13 was drilled at a flatter
angle to test above hole 9. Hole 14 was drilled at a 5° rotation to the
north of hole 9 to test the width of the structure.
HOLE
FROM (m)
TO (m)
INTERVAL (m)
AU g/t
AG g/t
CU %
PB %
ZN %
AuEq g/t
DW19-11
26.82
27.82
1.00
5.601
66.0
0.213
1.700
7.850
10.729
DW19-11
95.63
96.27
0.64
4.408
34.5
0.026
0.363
0.757
5.326
DW19-11
138.45
138.95
0.50
4.026
66.0
0.166
1.070
6.220
8.139
DW19-11
142.24
144.93
2.69
11.346
142.5
0.220
3.197
13.069
20.269
DW19-12
22.17
23.47
1.30
2.851
60.8
0.147
1.844
4.946
6.638
DW19-12
27.05
27.81
0.76
1.562
30.4
0.104
0.647
2.660
3.461
DW19-12
97.49
99.15
1.66
1.546
54.4
0.041
1.060
5.356
4.998
DW19-13
27.55
28.15
0.60
8.110
113.0
0.171
4.630
8.270
15.116
DW19-13
142.87
143.57
0.70
4.486
66.6
0.068
0.710
1.009
6.087
DW19-14
27.43
28.23
0.80
8.924
161.0
0.309
5.120
6.800
16.222
DW19-14
98.32
99.86
1.54
7.692
32.8
0.009
0.207
0.111
8.227
DW19-14
142.75
144.70
1.95
3.720
43.2
0.103
0.755
9.240
8.673
DW19-14
146.88
147.38
0.50
9.403
264.0
0.528
5.210
20.900
24.347
All the holes intersected the breccia below the dike at about 27
meters. Holes 11, 13 and 14 appear to intersect a similar structure to
that seen in hole 9. Multiple high-grade intercepts assayed as high as 24.3 g/t AuEq, 20.3 g/t AuEq, 16.3 AuEq, and 15.1 g/t AuEq while the remaining intercepts were still strong.
No modern exploration techniques or technologies have been used on
the Dunwell until a cutting edge Induced Polarization (IP) survey took
place in late fall of 2019. Only two of the dozens of geophysical
anomalies identified in the survey in close proximity to the Dunwell
Mine were drill tested in this first phase of drilling.
The last 6 holes (DW19-15 to DW19-19) were drilled to test the extent
of a large IP anomaly and were successful in encountering veins of
high-grade polymetallic mineralization including 19.4 g/t AuEq over 3.6m, 38.1 g/t AuEq over 0.5m and 28.4 AuEq over 0.4m with the remaining intercepts also containing significant mineralization.
Hole 15 was drilled south into the anomaly and Hole 16 was drilled
west into the anomaly with both intersecting a massive sulphide zone.
Holes 17 – 19 were drilled in a fan to follow up hole 16. Hole 18 also
hit a massive sulphide zone.
HOLE
FROM (m)
TO (m)
INTERVAL (m)
AU g/t
AG g/t
CU %
PB %
ZN %
AuEq g/t
DW19-15
100.90
102.08
1.18
8.445
869.0
0.034
0.186
1.265
19.536
DW19-15
152.09
152.59
0.50
32.230
472.0
0.008
0.134
0.372
38.119
DW19-16
45.11
45.81
0.70
11.260
144.0
0.208
6.550
6.010
18.471
DW19-16
75.07
78.68
3.61
8.850
88.8
0.221
1.768
19.514
19.354
DW19-17
no significant results
DW19-18
38.79
39.22
0.43
15.300
185.0
2.874
2.870
14.470
28.243
DW19-19
34.87
36.04
1.17
3.332
27.9
0.048
0.986
2.580
5.239
DW19-19
75.71
77.13
1.42
5.255
225.9
0.159
9.298
3.315
13.328
Hole 16 hit a massive sulphide interval at 75 – 78 meters. Hole 20
was drilled to test an IP anomaly along the access road below the second
drill pad. One small breccia was intercepted.
HOLE
FROM (m)
TO (m)
INTERVAL (m)
AU g/t
AG g/t
CU %
PB %
ZN %
AuEq g/t
DW19-20
121.01
121.45
0.44
1.669
27.5
0.007
0.034
0.082
2.056
CEO and President, Darren Blaney stated: “Our very
first drill program has intersected a significant number of high-grade
veins in the vicinity of the mine workings confirming our belief in the
potential of this project.
The Dunwell is an incredibly prospective property located in the
heart of the Golden Triangle. It has everything going for it from
amazing logistics to past high-grade production, with all indications
being that there is substantive additional ore yet to be mined.
With the recent acquisition of the Glacier Creek Crown Grants we now
cover 5km of the heavily mineralized Portland Canal Fissure Zone which
runs for 6.5km and is associated with over a dozen high-grade gold and
silver showings including two past producing mines. The potential of the
property extends far beyond the old workings of the Dunwell Mine.
Future exploration will be using the latest technologies to aid us in
unlocking that potential.”
Through a series of strategic acquisitions American Creek was able to
purchase the past-producing Dunwell Mine as well as several adjoining
very prospective properties, combining them into one large land package
that encompasses the best gold and silver mineral occurrences and
historic workings in the Bear River valley. The amalgamated property
spans 2,222 hectares covering the majority of the Portland Canal Fissure
Zone, an area first prospected in the late 1800’s and hosting some of
the earliest producing gold and silver mines in the Stewart area.
The Dunwell project is located 8km northeast of Stewart and is road
accessible with the Dunwell Mine adit itself located only 2km from
Highway 37A and a major power line. Stewart hosts a deep sea port
including ore loading and shipping facilities. Unlike the majority of
mineral properties located near Stewart, the Dunwell is located in low
mountainous terrain (700 m and lower elevation) with moderate relief.
These features allow for year-round work which typically isn’t the case
for exploration programs conducted in the Stewart region where projects
are typically at higher altitude, are accessible only by helicopter, and
lack critical infrastructure such as roads and power. The Dunwell
project may just have the best logistics of any project in the Golden
Triangle.
The Dunwell Mine is the most significant mineral occurrence within
the Portland Canal Fissure Zone. Production at the Dunwell occurred
between 1926 and 1937. From historic reports, it appears that a total of
45,657 tonnes averaging 6.63 g/t gold, 223.91 g/t silver, 1.83% lead,
2.43% zinc and 0.056% copper were produced.
In addition to the Dunwell mine itself, the property package also
contains over a dozen other high-grade gold and silver occurrences and
historic small-scale gold/silver high-grading operations along a
north/south trend that correlates to the fissure zone and major
faulting. Some examples of the nine areas that actually produced ore
are:
Ben Ali: 4,500 tons at 21.6 g/t gold
Lakeview 60 tons at 4.7 g/t gold, 2,734 g/t silver, and 11.5% lead
Victoria 11 tons at 20.15 g/t gold, 775 g/t silver, 25% lead
Tyee 8.2 tons at 124.4 g/t gold and 4,478.8 g/t silver
George E 12 tons at 13 g/t gold and 3,250 g/t silver, 23.3% lead
Each of these areas were producing during the 1930’s when exploration
techniques and technology was very primitive. American Creek has
already started to use the latest in exploration technology on the
property and will continue to do so to unlock the great potential that
exists here.
The Qualified Person for the Dunwell results in this new release is
James A. McCrea, P. Geo., for the purposes of National Instrument
43-101. He has read and approved the scientific and technical
information that forms the basis for the disclosure contained in this
news release.
About American Creek
American Creek holds a strong portfolio of gold and silver properties
in British Columbia. The portfolio includes three Golden Triangle
gold/silver properties; the Treaty Creek and Electrum joint ventures
with Walter Storm/Tudor as well as the 100% owned past-producing Dunwell
Mine. Other properties held throughout BC include the Gold Hill,
Austruck-Bonanza, Ample Goldmax, Silver Side, and Glitter King.
For further information please contact Kelvin Burton at: Phone: 403 752-4040 or Email: [email protected]. Information relating to the Corporation is available on its website at www.americancreek.com
Posted by AGORACOM
at 1:13 PM on Wednesday, February 26th, 2020
SPONSOR: American Creek owns a 20% Carried Interest to Production at the Treaty Creek Project in the Golden Triangle. 2019’s first hole averaged of 0.683 g/t Au over 780m in a vertical intercept. The Treaty Creek property is located in the same hydrothermal system as the Pretivm and Seabridge’s KSM deposits. Click Here For More Info
Exchange-traded fund holdings expand for 25 days to most ever
Moody’s Analytics says recession possible if pandemic occurs
Global investors are stashing more and more assets into gold as the
coronavirus outbreak spreads and appetite for risk takes a hit.
The global tally of bullion in exchange-traded funds swelled by the
most in more than a month on Tuesday as equities sank. That was the 25th
consecutive day of inflows, a record. At 2,624.7 tons, the holdings are
the largest ever.
After surging 18% last year, gold has extended its rally in 2020,
with prices hitting the highest since 2013. The haven has been favored
as the virus outbreak has spread beyond China, threatening a pandemic
and slower growth.
Goldman Sachs Group Inc. has said that should the disruption from the disease stretch into the second quarter, prices may rally toward $1,850 an ounce. Spot bullion was last at $1,644.67, up 0.6%. It touched $1,689.31 on Monday.
A global recession
is likely if the coronavirus becomes a pandemic, according to Moody’s
Analytics Chief Economist Mark Zandi. The odds of that outcome now stand
at 40%, up from 20%, he said in a note.
The threat of a prolonged downturn in growth due to the impact of the virus may keep gold elevated, according to Morgan Stanley. Further ETF inflows are likely as long as real interest rates remain negative, it said in a note.
Posted by AGORACOM
at 2:47 PM on Friday, February 21st, 2020
SPONSOR: Labrador Gold – Two successful gold explorers lead the way in the Labrador gold rush targeting the under-explored gold potential of the province. Exploration has already outlined district scale gold on two projects, including a 40km strike length of the Florence Lake greenstone belt, one of two greenstone belts covered by the Hopedale Project. Click Here for More Info
GDX and GDXJ are consolidating bullishly within a now seven-year-long base
Last week, I covered the historical trajectory of the gold stocks and how today compares to the early 1960s.
The late 2015 to early 2016 period marked one of the three best
buying opportunities of the past 100 years (from a secular standpoint),
and gold stocks are in position for sensational performance over the
next 20 years.
That sounds great, but what matters most is the here and now. We do
not want to get caught in a cyclical downturn (which could occur more
than once during this super bull).
Fortunately, the outlook over the next 12 to 18 months is bullish.
The macro-fundamentals are supportive and improving, and the gold stocks
now have a beautiful technical setup that could lead to massive gains.
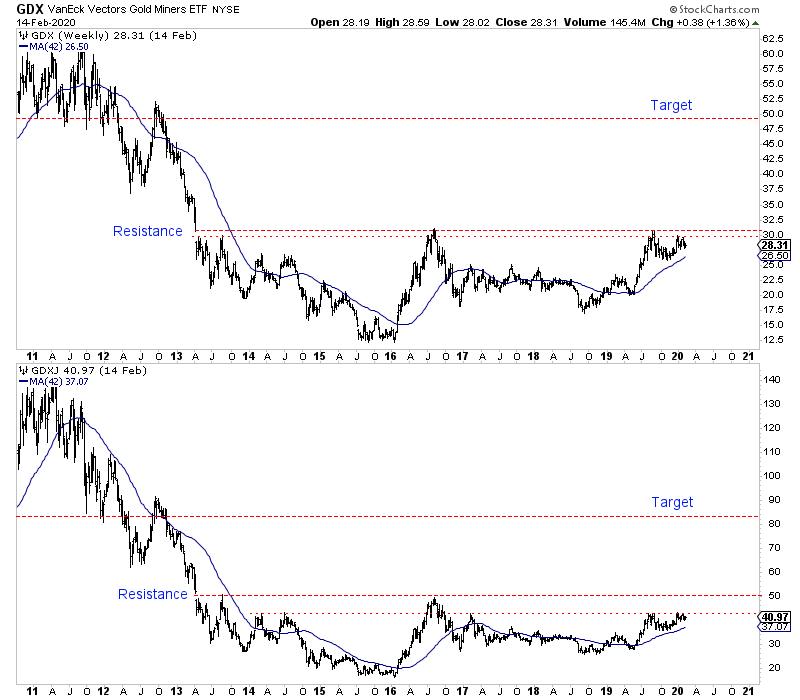
GDX and GDXJ are consolidating bullishly within a now seven-year-long
base. They are digesting recent gains while holding well above key
support levels and are in position for an eventual explosive breakout.
GDX & GDXJ Weekly Bars
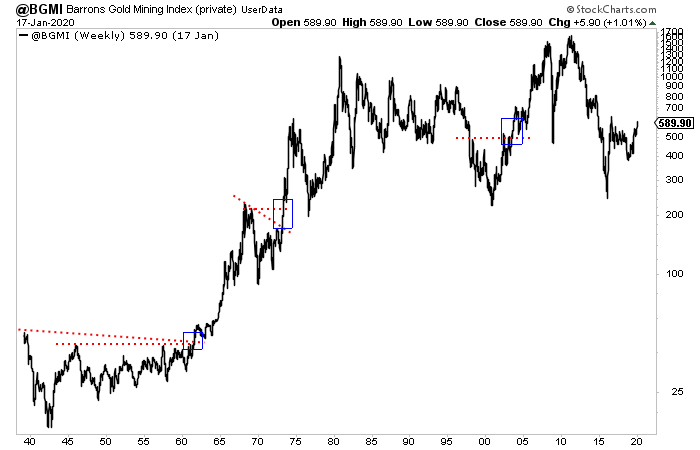
Historically, there have not been many multi-year breakouts with the
potential magnitude of this next one. In using the Barron’s Gold Mining
Index, I only find three.
The breakout in 1964 was a historic, multi-decade breakout that
ushered in an enormous bull market in gold stocks. It was the most
significant inflection point ever for gold stocks.
Later during that bull market, the gold stocks broke a 5-year downtrend and 5-year resistance in 1973, exploding higher.
Barron’s Gold Mining Index
The 2005 breakout compares best with the potential next one.
Like the one in 2005, this next one is setting up several years after
a secular low, following one of the worst bear markets of the past 90
years.
Also, this next breakout could occur following a +7 year-long base,
which is not too far from the +9 year base that was broken in late
2005.
Furthermore, the May 2005 low is similar to September 2018 in that
both followed a mini-bear market that lasted at least 18 months.
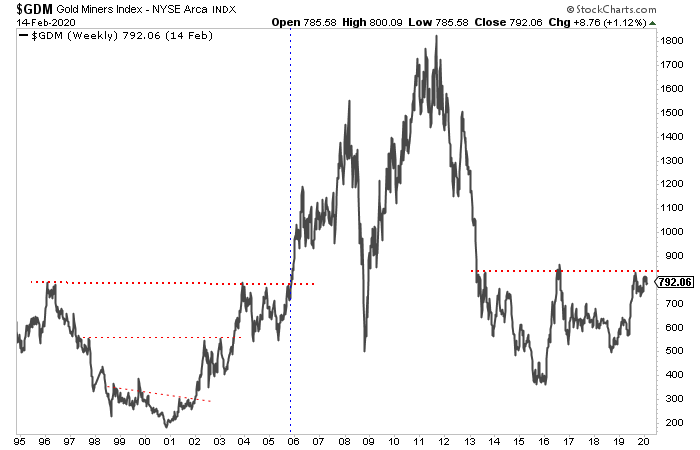
We plot the NYSE Arca Gold Miners Index, which is the parent index of GDX.
GDM Weekly Line
Since there are similarities in the setup, perhaps the upside
potential from a new breakout could be similar to that which followed
the 2005 breakout.
I want to focus on GDXJ because we invest in juniors and not seniors. The history of GDXJ back to January 2004 is available on this website.
From its May 2005 low to its peak in November 2007, GDXJ advanced
nearly 4-fold. Once GDXJ surpassed its January 2004 peak, it gained 138%
into that 2007 peak.
GDXJ closed last week just below $41. The measured upside target from
a break past $50 is $83. If GDXJ today duplicated its performance
before and after the 2005 breakout, then it would peak at $100 or $115.
If we get the breakout, then $83 becomes the minimum upside target. In that case, $100 or $115 is hardly a stretch.
Posted by AGORACOM
at 11:56 AM on Friday, February 21st, 2020
Sponsor: Affinity Metals (TSX-V: AFF) a Canadian mineral exploration company building a strong portfolio of mineral projects in North America. The Corporation’s flagship property is the Drill ready Regal Property near Revelstoke, BC. Recent sampling encountered bonanza grade silver, zinc, and lead with many samples reaching assay over-limits. Click Here for More Info
Silver is a precious metal with approximately 50% of the demand coming from industrial uses.
It is a “high beta†play on the gold price, more sensitive to global growth and the inflation expectations.
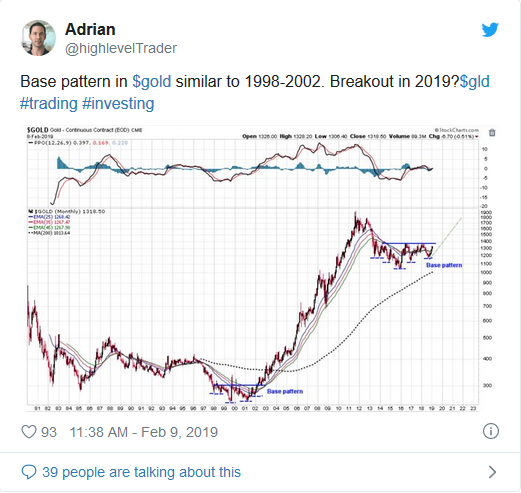
I’m on record for a quite bullish call in gold one year ago. As of today, gold trades approximately 20 % or 300 USD higher.
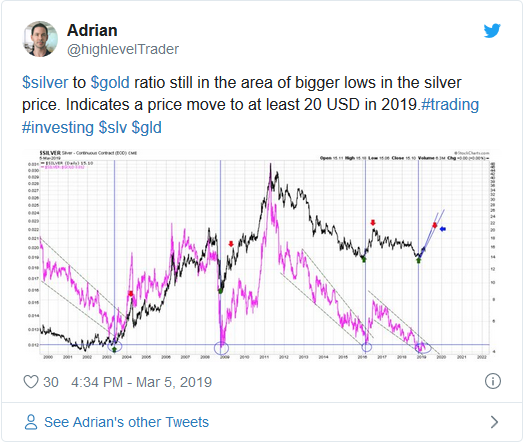
In March 2019, I also tweeted that the
silver/gold ratio probably made a low and that I expect silver to at
least reach 20 USD in 2019. I was slightly too optimistic, silver made
“only†30 % and hit 19.75 USD.
I have a new strong opinion I would like to share with you.
Silver is a precious metal with approximately 50% of the demand
coming from industrial uses. It is a “high beta†play on the gold price,
more sensitive to global growth and the inflation expectations.
The relationship to gold in more detail: at the beginning of a new
up cycle in precious metals, silver in general lags gold. Later in the
cycle (especially at the end of a certain cycle) silver massively
outperforms gold. After the peak, silver starts to underperform again.
After spending quite some time doing research, today’s situation in
silver looks similar like late 2003 (blue arrow). But here are my
observations:
“History doesn’t repeat itself, but it often rhymes.†– Mark Twain
The a-b-c is a typical bottoming process, with a retest of the lows
(c), a price compression and a well-defined breakout (blue trendline).
During this initial stage, silver rather underperforms gold (see 1 and 2
in the silver/gold ratio).
Later silver consolidates above the 200-week moving average (blue
box), pullbacks finding support at the moving average, exactly like in
2003. Meanwhile, the moving average flattens and even turned upward.
The silver/gold ratio also put in a possible bottom and is close to breaking the dashed blue trendline (yellow box).
If things repeat in a similar way, expect a huge up move in silver
soon. A repeat of 2003-2004 would imply roughly 50 % upside within this
year.
How I play it:
I already have a position in silver, I will increase the position if
silver is able to break and hold above 18.12 USD = higher low. (further
confirmation if gold miners break out and the silver/gold ratio breaks
the downward sloping trendline)
Below 17.48 USD I reduce my position and stay rather defensive until silver is showing strength again.
I personally use futures and I will probably add a call option
(strike 18 USD; March 2021). For most people, a ETF like SLV is probably
a good way to participate.
A word of caution:
First, bold predictions often fail. The above mentioned is just my opinion (as of today).
Further, history is only a guide. The move may take place later, is
not as explosive as in 2003-2004 or will not take place at all.
I see a possibility that the recent virus in China has a quite
negative impact on global growth and on inflation expectations
(S&P500 doesn’t believe it, but copper and oil do). A severe outcome
would probably delay this trade setup. Remember, silver is very
sensitive to inflation expectations.
As already stated, just my opinion and not investment advice. Please
do your own analysis. Investing/trading involves substantial risk of
loss and is not suitable for all people.