Posted by AGORACOM
at 3:32 PM on Friday, December 18th, 2020
Candente Copper (DNT:TSX) is currently focused on its 100% owned Cañariaco project, which includes the feasibility stage Cañariaco Norte deposit, a large, economic, copper deposit in Peru waiting to be mined.
Highlights are as follows.
100% owned feasibility-stage porphyry copper deposit; a single, contiguous, open-pit mineable deposit of:
7.5B pounds Measured and Indicated and can be mined for 22 years once in production.
Once in production Canariaco is in the lowest quartile of production costs for projects waiting to be developed.
Operating costs of US$0.988 per pound of copper
Capable of generating annual production of 262,000,000lbs of copper, 39,000 oz gold & 911,000 oz silver over initial mine life of 22 yrs(@ 95,000 tpd).
Posted by AGORACOM-JC
at 10:54 AM on Friday, December 18th, 2020
Peak Value of 4.0g/t Au in Auger
Within Broad 240m Wide Zone of Bedrock Gold Anomalism New Discovery with Potential Strike Length of 1,800m
VANCOUVER, BC , Dec. 18, 2020 – Tajiri Resources Corp. (the “Company”) (TSXV: TAJ) is excited to announce preliminary, yet outstanding results from a small, single line twelve hole, 25m spaced auger programme sampling the top 2 metres of saprolite at the Epeius Project. The program, tested the extrapolated strike extensions of known gold mineralisation currently undergoing resource definition drilling by Troy Resources Limited (ASX:TRY or ‘Troy’) at their Goldstar Prospect where initial drill and trench results reported to date demonstrate the potential for several sub parallel zones with highlights that include : RC drilling:6m @ 10.0g/t from 66m ; 17m @ 2.2g/t from 3m ; 16m @ 1.0 g/t from 31m , 16m @ 1.7g/t from 59mTrenches horizontal at surface: 13m @ 3.3g/t; 8m @ 3.0g/t, 7m @ 2.9g/t; 10m @ 1.0g/t; & 11m @ 1.5g/t.
The auger results reported today indicate potential for a significant zone of gold mineralisation, within a small portion of the Epeius Project, over a potential 1,800 metres of strike length (see Figure 2 ). The zone of potential extends 1,150 metres from the Project’s southern boundary which is contiguous with the Goldstar Prospect, through the auger holes and onward for 650m to the Project’s northern boundary,where weaker but persistent soil gold anomalism has been encountered by Troy.
The zone of gold anomalism outlined by the auger holes is ~230m wide @ >40ppb and includes the following higher gold in saprolite values of: 4,034 (4.03g/t), 702, 251, 276 & 113 ppb Au. Auger Holes were drilled at depths between 4 to 7 metres and the last two metres where saprock textures were visible was sampled and assayed by 1kg, 24 hour cyanide leach with an accelerant. The values are therefore in-situ bedrock values and the width of the zone of gold anomalism which topographically lies at the uppermost of a ridge that has not been substantially effected by mechanical lateral dispersion – more typical of gold in soil anomalies.
Mineralisation in this part of the Epeius Project is hosted by early Proterozoic greenstones of the Barama Mazaruni Supergroup and is associated with a NNW trending zone of regional shearing (the Gem Creek Corridor), which extends for at least 20km strike and which for most its known strike approximately follows the contact of a geochemically distinct basalt which displays high magnesium and chrome contents. This basalt has been identified by Troy as the same unit which hosts the Smarts and Hicks deposits (15.5Mt @ 2.3g/t of NI43-101 compliant M+I+I resources reported pre-mining 9 th September 2014 ) nine kilometres to the south.
Significantly, of the 1,150 metres of strike potential between the Company’s line of auger holes and Troy’s resource drilling the projected mineralisation is completely covered by alluvium for 600m of strike and partially covered for 400m of strike. As such the company’s auger holes were located in the first area on strike from Troy’s Goldstar Prospect where a transect of the full width of the mineralised trend projecting from Goldstar could be tested. Furthermore, all creeks in near vicinity of the auger holes have been worked repeatedly and extensively by artisanal miners and the area where the potential mineralisation is completely covered for 550m of strike, immediately adjacent to Goldstar, is the upstream starting point for a prodigious area of artisanal alluvial mining varying between 200 and 800 metres width and extending downstream along the flats of the West Kaburi and Kaburi Rivers for 15,000 metres. As such the scale of alluvial workings suggest that the Goldstar Prospect and its indicated strike extensions through the Epeius Project is a bedrock gold source of considerable, but yet to be determined size.
When received, the Company considered the auger results worthy of immediate follow-up and consequently an excavator commenced trenching at Epeius, December 3 rd 2020, along the line of auger holes and south over a strike of ~400m along strike, across projected areas of mineralisation where not covered by alluvium. To date approximately 600 linear metres has been excavated in seven trenches to a depth of ~ 4m to in situ saprolite exhibiting bedrock and mappable textures.
First assay results from the trench programme are expected within two weeks but examination of the trenches confirms several potentially mineralised zones similar to gold mineralisation described by Troy resources at Goldstar. These include possible gold mineralisation at the contacts between the high MgO basalt with small felsic intrusive bodies of (2- 15m width) and with small dolerite bodies of (4- 12m width) within the High MgO basalt. Potential gold mineralisation appears as both stock works and shallow dipping vein sets within the felsic intrusive bodies and dolerites and as highly oxidised, iron oxide rich “black coated” often boudinage quartz veins within highly strained MgO basalt. In particular, the peak 4.0g/t value from auger drilling corresponds with a 4- 12m wide dolerite which exhibits a well-developed stockwork of 1-30cm wide quartz-carbonate veins and the next highest value of 0.7g/t was located within a fine grained felsic intrusive of approximately 8m width which exhibited well developed NW striking, flat to 20 dipping quartz veins and minor stockwork veining and veinlets. (see plates 1, 2 & 3)
Background
The Epeius Project, comprised of 9,300 hectares of tenements granted for gold and precious metals is contiguous with the Company’s wholly owned Kaburi Project of 2,600 Ha. The combined projects are located in Guyana South America , 165km southwest of the country’s capital Georgetown and between 3.5 and 25 kilometres from the 1 Mtpa Karouni Mine Mill of Troy resources. 35 km to the ESE lies the Omai gold mine which produced 3.7Moz @ 1.3g/t. Results subject of today’s announcement are located 9 km north of the Karouni Mine Mill.
The Acquisition of the Epeius Project by execution of a binding LOI was announced 24 th June, 2020 and is pending share approval at the Company’s next AGM scheduled for 2 nd February, 2020. Sampling reported today has been undertaken as part of the company’s Due diligence on the Epeius Project.
The Chairman’s Comments
Executive Chairman, Dominic O’Sullivan observed: “Having worked extensively in and around the Kaburi and Epeius Projects over the past 14 years and having led the team which in part discovered and defined the two principal deposits of the Karouni Mine, I can say the results reported today present one of the better zones of saprolite gold anomalism in the district comparable to those that were returned by early saprolite auger drilling at the Smarts Deposit.
We took a big jump along strike from recently discovered mineralisation at Troy’s Goldstar Prospect and results have come up quite nicely for us right where the potential strike extensions of the Goldstar Prospect were projected to be. It doesn’t cost much to hand drill and assay 12 auger holes but Bang there you go a potential 1.2km mineralised zone demonstrated for a few thousand US dollars.
The trenching program in progress should also prove a low-cost way to further our understanding of mineralisation prior to drilling, of which a substantial portion will be through shallow alluvial cover.
We of course await the assay results of our trenches before we can say with confidence we have a truly significant gold mineralised zone, but I take early encouragement not only from the auger results but from a recent announcement by Troy that they are undertaking a 15 x 10 metre resource definition drilling program at Goldstar over a 500m strike from our boundary southwards ( 7 th December, 2020) and have already commenced construction of a haul road between Goldstar and the Karouni Mill.”
Qualified Person
The Qualified Person under National Instrument 43-101 – Standards of Disclosure for Mineral Projects for this news release is Dominic O’Sullivan a geologist, member of the AusIMM, Executive Chairman of Tajiri and who has reviewed and approved its contents.
On Behalf of the Board, Tajiri Resources Corp.
Graham Keevil , President & CEO
About Tajiri
Tajiri Resources Corp. is a junior gold exploration and development Company with exploration assets located in two of the worlds least explored and highly prospective greenstone belts of Burkina Faso , West Africa and Guyana , South America . Lead by a team of industry professionals with a combined 100 plus years experience the Company continues to generate shareholder value through exploration.
This news release may contain forward-looking statements based on assumptions and judgments of management regarding future events or results. Such statements are subject to a variety of risks and uncertainties which could cause actual events or results to differ materially from those reflected in the forward-looking statements. The Company disclaims any intention or obligation to revise or update such statements.
Neither the TSX Venture Exchange nor its Regulation Services Provider (as that term is defined in the policies of the TSX Venture Exchange) accepts responsibility for the adequacy or accuracy of this release.
Posted by AGORACOM
at 9:30 AM on Friday, December 18th, 2020
Vancouver, BC – TheNewswire – December 18, 2020 – Durango Resources Inc. (TSXV:DGO) (Frankfurt-86A1) (OT C :ATOXF), (the “ Company ” or “ Durango ”) is pleased to announce it has engaged an additional drill company for its exploration program on its wholly owned properties at Windfall Lake, Québec .
East Barry Property
Further to the news release of November 19, 2020, Durango has received drill permits for the East Barry claim block to test high priority targets coincident with high till anomalies of up to 2.19 g/t gold and pristine gold grains in till trend. Now that weather conditions are favourable for preparing access, a drill has been commissioned to test a geophysical anomaly which also coincides with an artificial intelligence (“ AI ”) target. The Company has hired Faubert & Fils from Val d’Or, Québec, to complete several initial exploration drill holes on its East Barry Property.
Trove Property
To date, 1,700m has been drilled in eight holes on the Trove Property at an average depth of 213m. Drilling is still continuing at the Trove Property with the drilling crew working on hole #9. As noted previously, the objective of the drill campaign is to test IP anomalies derived from previous exploration work.
The main lithologies observed in the drill holes are represented by mafic to intermediate volcanics, metasediments and felsic intrusives crosscut by quartz feldspar porphyry (“ QFP ”) and felsic dikes containing disseminated to semi-massive sulphides. Molybdenite, chalcopyrite and silver indicator alterations were also observed. The lithological contacts are marked by chlorite-epidote-carbonate alterations containing centimetric to decimetric mineralized quartz veins. The labs continue to be delayed and backed up due to extremely high quantities of samples they are receiving from multiple exploration companies and a shortage of personnel.
Durango’s high priority targets remain undrilled due the land condition caused by unseasonably warm weather, which has prevented the freezing required for access to the drill hole locations. Durango has 20 high priority holes planned for drilling on the Trove Property, between 200 and 800 meters deep, when the ground is sufficiently frozen to permit drill access.
Marcy Kiesman, CEO of Durango, stated, “The unseasonably warm weather has been challenging for our inaugural drill campaign on the Trove Property. We have completed initial drilling which will help our exploration team understand the local geology and structure in the area. As the weather in the area has recently become seasonably cold, we expect that our high priority targets will be drilled early in January. We are drilling in one of the best regions in Canada to find gold, we are fully financed and will continue to drill into 2021. We anticipate an exciting year ahead for Durango and our shareholders.”
The technical contents of this press release were approved by George Yordanov, professional geologist, an Independent Qualified Person as defined by National Instrument 43-101. The Trove Property has not yet been subject to an NI-43-101 report.
Trove Property, Québec
Durango owns 100% interest in the Trove claims, which are surrounded by Osisko Mining Inc. (TSX-OSK), in the Windfall Lake area between Val d’Or and Chibougamau, Québec. The 1,185 hectare property is compelling due to the coincidence of gold found in tills coinciding with magnetic highs, several Induced Polarization anomalies and two faults crosscutting the property. The fault systems north and south of the Trove, control gold mineralization elsewhere, indicating the Trove has excellent exploration potential. Durango received all the final drill permits for the Trove property in September 2019 and is currently undertaking its inaugural drill program.
East Barry Property, Québec
Durango owns 100% interest in the East Barry claims which run parallel to Trove claims. The East Barry block is over 7,740 hectares in size and borders the eastern perimeter of Osisko’s holdings and the southern perimeter of Bonterra’s holdings and is less than 4km south of the Gladiator deposit. The East Barry claims host a gold trend which covers approximately 10km in length and is subparallel to the main Barry Fault held by Osisko Mining. In 2018, a till sampling program was conducted by Durango and one of the till samples returned forty-two (42) pristine gold grains with reported gold values of 2.184 g/t Au. A high count of pristine gold grains indicates that the gold has travelled a very short distance from its source. The East Barry block underwent an Induced Polarization (“ IP ”) survey in 2018 which identified a high priority target coincident with the high count of pristine gold grains.
About Durango
Durango is a natural resources company engaged in the acquisition and exploration of mineral properties. The Company is positioned for discovery with a 100% interest in a strategically located group of properties in the Windfall Lake gold camp in the Abitibi region of Québec , Canada.
For further information on Durango, please refer to its SEDAR profile at www.sedar.com .
Posted by AGORACOM
at 9:31 AM on Wednesday, December 16th, 2020
1.078 gpt AuEq over 345.0 Meters Within 921.0 Meters of 0.821 gpt AuEq (Hole GS-20-83) at the Goldstorm Zone, Treaty Creek, Located in B.C.’s Golden Triangle
Cardston, Alberta–(Newsfile Corp. – December 16, 2020) – American Creek Resources Ltd. (TSXV: AMK) (“the Corporation”) is pleased to present results for the fifth set of diamond drill holes for the Goldstorm Zone at their flagship property, Treaty Creek. The project is located in the heart of the Golden Triangle of northwestern British Columbia and is on-trend from Seabridge’s KSM Project located five kilometers southwest of the Goldstorm Zone. Results from 12 diamond drill holes have recently been received from MSA Labs with final results from another 11 diamond drill holes pending. All drill holes have successfully intersected the Goldstorm System, expanding and defining the mineralization along the northeast and southeast axes, as well as to depth. The Goldstorm System 300 Horizon has now been traced for 1100 meters along the northeast axis and, as well, the CS-600 and DS-5 zones have been expanded to the northeast and to depth. All 39 drill holes completed at Goldstorm during the 2020 program have encountered significant precious metal mineralization. The 2020 Treaty Creek Diamond Drill Program was completed last week, and field personnel have winterized the camp. The track-components of two track-mounted diamond drills remain on site ready for start-up of the 2021 exploration season.
Tudor Gold’s Vice President of Project Development, Ken Konkin, P.Geo., states: “We are very pleased with the results obtained from all 39 drill holes completed this year to-date and we anticipate the release of the final 11 holes of the year within a few weeks. This brings the total to 50 drill holes that were completed this year at the Goldstorm Zone. These latest holes continued to expand the limits of the mineralized targets along the northeastern and the southeastern axes, and to depth. For a fifth consecutive press release, we have surpassed our best result from last years’ drill hole program (0.697 AuEq over 1081.5 meters in hole GS-19-47) with drill holes GS-20-83 and GS-20-94 as described in the headline. The final 11 drill holes represent over 9600 meters of drilling and we expect that MSA Labs will complete the analysis of these final samples as soon as possible.”
Treaty Creek Highlights include:
Twelve drill holes presented in this press release total 11,551.1 meters.
The best results were from GS-20-94, a near-surface 354.0 meter intercept (36.0-390 m) averaging 1.215 gpt AuEq and GS-20-82 with a 351m intercept (113.0-464.0 m) averaging 1.051 gpt AuEq. Both holes are located on Section 111+00 NE.
Equally impressive was drill hole GS-20-83 that also had a near-surface intercept over a similar 345.0 meters (73.5-418.5 m) that averaged 1.078 gpt AuEq on Section 112+50 NE.
More Core Drilling did an excellent job completing 50 HQ/NQ2 diamond drill holes totaling 43,972 meters at Goldstorm and 1,636 meters at the Perfect Storm Target with three drill holes.
The following three tables below provide the complete list of composited drill hole results as well as the drill hole data including hole location, elevation, depth, dip and azimuth.
Table l: Results Goldstorm Zone Press Release December 15th 2020
Section
Hole
Zone
From
To
Interval (m)
Au
Ag
Cu
AuEQ
114+00 NE
GS-20-80
300H + CS600
222.50
1349.00
1126.50
0.369
1.66
653
0.486
including 300H
398.00
695.50
297.50
0.488
1.98
135
0.531
and including CS600
831.50
1028.00
196.50
0.572
3.25
2703
1.011
115+50 NE
GS-20-81
300H + CS600 + DS5
558.40
1389.50
831.10
0.422
1.56
940
0.580
including 300H + CS600
558.40
957.50
399.10
0.529
1.96
1712
0.807
with 300H
558.40
636.50
78.10
1.047
1.52
139
1.086
and with CS600
704.00
957.50
253.50
0.481
2.37
2494
0.879
111+00 NE
GS-20-82
300H + CS600
113.00
1041.50
928.50
0.629
2.46
519
0.736
including 300H
113.00
464.00
351.00
0.969
3.56
263
1.051
with 300H
224.00
422.00
198.00
1.283
5.29
408
1.407
112+50 NE
GS-20-83
300H + CS600 + DS5
73.50
994.50
921.00
0.676
3.97
655
0.821
including 300H
73.50
418.50
345.00
1.008
3.48
191
1.078
and including CS600
566.45
727.50
161.05
0.426
3.90
2863
0.898
and including DS5
813.00
994.50
181.50
0.919
7.33
190
1.035
112+50 NE
GS-20-85
300H
66.50
692.00
625.50
0.748
3.80
275
0.834
CS600
752.00
989.00
237.00
0.241
2.23
1734
0.524
DS5
1118.00
1278.50
160.50
0.511
2.11
128
0.555
114+00 NE
GS-20-86
300H
118.50
577.50
459.00
0.712
3.43
263
0.792
CS600
730.50
942.00
211.50
0.469
2.49
2172
0.821
DS5
1014.00
1425.00
411.00
0.595
2.85
145
0.650
including
1192.50
1395.00
202.50
0.889
3.39
130
0.949
111+00 NE
GS-20-89*
300H
87.00
125.00
38.00
1.142
12.85
91
1.309
111+00 NE
GS-20-90
300H + CS600
63.00
847.50
784.50
0.646
2.89
465
0.750
including 300H
72.00
405.00
333.00
0.915
3.60
177
0.984
and including CS600
643.50
768.00
124.50
0.635
4.60
1632
0.932
110+00 NE
GS-20-93*
300H
20.50
237.50
217.00
0.535
3.40
152
0.599
incl.
20.50
131.00
110.50
0.850
5.49
206
0.946
111+00 NE
GS-20-94
300H
36.00
1261.50
1225.50
0.646
2.50
178
0.702
including
36.00
390.00
354.00
1.123
4.14
287
1.215
or including
36.00
820.50
784.50
0.856
3.45
239
0.933
108+00 NE
GS-20-96
300H
6.00
109.50
103.50
0.804
2.27
129
0.850
CS600
279.00
385.50
106.50
0.228
3.77
1235
0.457
110+00 NE
GS-20-97
300H
18.40
584.00
565.60
0.609
1.95
107
0.648
incl.
18.40
381.50
363.10
0.693
2.35
141
0.742
*lost drill hole in mineralization
All assay values are uncut, and intervals reflect drilled intercept lengths.
HQ and NQ2 diameter core samples were sawn in half and typically sampled at standard 1.5m intervals.
The following metal prices were used to calculate the Au Eq metal content: Gold $1322/oz, Ag: $15.91/oz, Cu: $2.86/lb. Calculations used the formula Au Eq g/t = (Au g/t) + (Ag g/t x 0.012) + (Cu% x 1.4835). All metals are reported in USD and calculations do not consider metal recoveries. True widths have not been determined as the mineralized body remains open in all directions. Further drilling is required to determine the mineralized body orientation and true widths.
Table ll: Drill Data for Holes in Press Release December 15th, 2020 Table II and Table III
Attached are Sections 108+00 NE, 110+00 NE, 111+00 NE, 112+50 NE, 114+00 NE and 115+50 NE showing holes traces with histogram plots for gold and copper results and a Plan Map showing the drill hole and section locations.
Walter Storm, President and CEO, stated: “We are very pleased to announce the safe successful completion of our 2020 diamond drill hole program. We completed over four times the amount of drilling from the previous year’s program, greatly advancing Tudor’s flagship Treaty Creek Property. We completed almost 44,000 meters of drilling at the Goldstorm System and over 1,600 meters of drilling at the Perfect Storm target. Once we receive the final results from the last eleven drill holes, we will then pass the data to our resource engineers and geoscientists for an initial resource estimate. Continued drilling is required for 2021 to locate the limits or edges of the mineralized system. Due to the size and robust nature of the mineralization, the Goldstorm System remains open on all fronts and to depth. We are proud of what we have achieved in these last two years of exploration and in-particular, the great effort to withstand the harsh winter elements during November and December at Treaty Creek to bring the 2020 drill campaign to a safe close. Our commitment is to continue to advance the project as quickly as possible. We have left the track-drill carriage components for two track-mounted drill rigs on-site so our team can get an early start to the 2021 drill season. We look forward to receiving the final results of the eleven drill holes from MSA Labs within a couple of weeks to complete the 2020 exploration season on schedule.”
Tudor Gold Corp and our associated service companies have taken extreme measures to maintain the highest professional standards while working within COVID-19 health and safety protocols.
Darren Blaney, CEO of American Creek, commented: “We are extremely impressed with the drill program our JV partner Tudor Gold has completed this year and with the significant potential deposit that it has revealed. The Goldstorm zone already appears to be world-scale in size and yet is still open from the northeast to the southeast and remarkably, also at depth. The Magnetotelluric survey done in 2016, which shows potential continuation of gold mineralization well beyond the extent of this year’s drilling of Goldstorm, has proven to be very accurate. That same survey data also shows tremendous potential at the Perfect Storm zone which, due to permitting restraints, was only able to have the outer halo drill tested this year, and yet the drilling still encountered gold mineralization.
“Recognition must be given to both Tudor Gold and More Core for initiating the drill program in early May and carrying through to December. This is no small feat in the Golden Triangle region. While bad weather and Covid-19 limited many projects within the area this season, Tudor and More Core delivered an incredible 45 km of drilling with every hole encountering significant gold mineralization.
“We look forward to the remaining holes, the metallurgical work, and ultimately the maiden resource calculation of the Goldstorm on Treaty Creek sometime in the new year.”
QA/QC
Drill core samples were prepared at MSA Labs’ Preparation Laboratory in Terrace, BC and assayed at MSA Labs’ Geochemical Laboratory in Langley, BC. Analytical accuracy and precision are monitored by the submission of blanks, certified standards and duplicate samples inserted at regular intervals into the sample stream by Tudor Gold personnel. MSA Laboratories quality system complies with the requirements for the Company. International Standards ISO 17025 and ISO 9001. MSA Labs is independent of the company.
Qualified Person
The Qualified Person for Tudor’s news release for the purposes of National Instrument 43-101 is Tudor’s Vice President of Project Development, Ken Konkin, P.Geo. He has read and approved the scientific and technical information that forms the basis for their disclosure contained in their news release.
The Qualified Person for this news release is James A. McCrea, P. Geo., for the purposes of National Instrument 43-101. While American Creek has not independently confirmed Tudor’s information, Mr. McCrea has read and approved the scientific and technical information that forms the basis for the disclosure contained in this news release.
Treaty Creek JV Partnership
The Treaty Creek Project is a Joint Venture with Tudor Gold owning 3/5th and acting as operator. American Creek and Teuton Resources each have a 1/5th interest in the project creating a 3:1 ownership relationship between Tudor Gold and American Creek. American Creek and Teuton are both fully carried until such time as a Production Notice is issued, at which time they are required to contribute their respective 20% share of development costs. Until such time, Tudor is required to fund all exploration and development costs while both American Creek and Teuton have “free rides”.
Treaty Creek Background
The Treaty Creek Project lies in the same hydrothermal system as Pretium’s Brucejack mine and Seabridge’s KSM deposits however, with far better logistics.
For a better understanding of the mineralized zones at the Goldstorm, please view this video (which shows the original 20,000m planned drill program opposed to the 40,000m+ drill program that has taken place).
American Creek is a Canadian junior mineral exploration company with a strong portfolio of gold and silver properties in British Columbia.
Three of those properties are located in the prolific “Golden Triangle”; the Treaty Creek JV with Tudor Gold/Walter Storm, the D-1 McBride, and the 100% owned past producing Dunwell Mine.
The Corporation also holds the Gold Hill, Austruck-Bonanza, Ample Goldmax, Silver Side, and Glitter King properties located in other prospective areas of the province.
See additional images of drill locations in this press release at www.americancreek.com.
For further information please contact Kelvin Burton at: Phone: 403 752-4040 or Email: [email protected]. Information relating to the Corporation is available on its website at www.americancreek.com.
Neither the TSX Venture Exchange nor its Regulation Services Provider (as that term is defined in the policies of the TSX Venture Exchange) accepts responsibility for the adequacy or accuracy of this release.
This news release contains forward-looking statements. These statements are based on current expectations and assumptions that are subject to risks and uncertainties. Readers should not place undue importance on forward-looking information and should not rely upon this information as of any other date. Actual results could differ materially because of factors discussed in the Corporation’s management discussion and analysis filed with applicable Canadian securities regulators, which can be found under the Corporation’s profile on www.sedar.com. The Corporation does not assume any obligation to update any forward-looking statements.
Posted by AGORACOM
at 11:05 AM on Tuesday, December 8th, 2020
VANCOUVER, BC, Dec 8, 2020 /CNW/ – Tajiri Resources Corp. (the “Company”) (TSXV: TAJ) is delighted to report initial results from first pass RC drilling at the Morley Prospect situated within the Company’s 1,162km2 Reo Gold Project, located at the confluence of the prolific Hounde, Boromo and Goren Greenstone Belts, Burkina Faso (Figure 1). The shallow, 23 hole program intercepted consistent gold mineralization including:
Results of all drill holes are given in the Table at the end of this document and shown in Figure 2.
The results reported today are the product of a drill program designed as a first test of Tajiri’s new model for the orientation of mineralisation at Morley. These results, when combined with historic drill intersections, largely confirm the new model and opens new and hitherto sparsely to completely unexplored strike and dip directions to expand Morley. Historic results include:
1All historic intercepts are from drilling at a variety of azimuths and dips to mineralisation and individual intersections may not be representative of true widths and may vary ~ 20 to 80% from true width. New results are interpreted as being within 80-90% of true widths.
Summary
Tajiri’s maiden drill program, importantly, confirms a new orientation model for gold mineralisation at Morley which is situated in a belt scale deformed granite and lies within 800m of the northern and 1,000m of the western granite-greenstone contact (Figure 1).
Exploration at Morley is still at an early stage- historically it has returned high grades from drill holes over widths that make it a high priority target but a coherent model of the orientations and structural controls of mineralisation was never previously established.
Our drilling shows the main mineralised zone at Morley has a WNW strike and dips -50˚ northeast. Strike is subparallel to a set of crosscutting shear zones which occur over a width of about 2km at Morley and are axial to a major 40˚ flexure in the strike of the granite-greenstone belt from ENE to NNE (Figure 6).
Most Importantly confirmation of the new model opens-up on strike and down dip potential into very sparsely explored or totally unexplored areas both immediately and further along strike (Figures 4,5 & 6).
A very favourable target is now in play: only 1,000m WNW along strike, the “Morley structure” cross cuts the ENE trending sheared granite-greenstone contact of the Morley host granite. Empirically, granite-greenstone contacts are a favoured location for high grade gold deposits in Burkina such as M1 South, Siou and Yaramoko (Figure 6).
This target area is under alluvial cover and has never been sampled and represents a first order opportunity for Tajiri.
At Morley mineralisation presents as high-grade narrower veins within broader halos of low-grade sericite + carbonate +/- pyrite shearing. It is expected that veins may have an orientation oblique to shearing and there may be at least two sets (Figure 3).
While drilling has broadly confirmed the strike and dip of the model it requires further work on the details to explain grade and thickness variations within the mineralised zones. This is likely the influence of a second structural direction on vein set orientation within the shear zones and/or the presence of intersections with other structures of different orientations.
Several lines of evidence point to the second structural control being either NNE or ENE with a likely 50˚-60˚ north dip. Strike of the second structural control is therefore subparallel to the major belt scale shear zones in the area.
Balance of evidence suggests the high-grade intersections returned in KRAC128 (8m @ 54.2g/t) and MTRC 022 (3m @ 30.9g/t), which we drilled as a scissor hole, are from a NNE striking vein which dips 50˚ to 60˚ to the west or it is the intersection of ENE and NNE vein sets with ~50˚ degree dips to the west. ENE strike projections of this vein have been adequately tested by historic drilling but not NNE directions as most N-S oriented RC drillholes are subparallel to this direction. Significantly this vein in RC chips appears to have a different character to those of other vein zones drilled during the program appearing to be more of a laminated style.
Historic close spaced (50m x 50m) auger drilling to sample top of saprolite in the immediate vicinity of the Prospect confirmed WNW, as well as NNE and ENE trends as anomalous and the close spaced auger anomaly remains open in all of those directions (Figure 4)
Historic scout drilling oriented on NW-SE lines, intersected thin or low-grade mineralisation on ENE and possibly NNE trends (Figure 4).
There is a good potential for Morley to be a stacked lode system with gross strike controlled by ENE or NNE bounding shears and main lodes in crosscutting WNW strike and NE dip orientations. This possibility remains poorly tested but could lead to Morley becoming a substantial stand-alone deposit (Figure 5).
Prospect has excellent opportunities to host high grade intersection shoots, but suspected plunge directions and best intersection structures still need to be determined.
Demonstrating that WNW structures are mineralised has important implications for exploration elsewhere within the Reo Project as historic sampling patterns are orthogonal to the NE trending main belt structures and thus poorly oriented to test potentially WNW mineralised structures
Given the above potential two structural controls, drilling has been paused temporarily to gather more structural data to optimise drill directions. To this end the company will embark on a focussed deep trenching program to gather structural data and vein orientation data before re-commencing drilling at the prospect scale. Trenching will commence early Q1 2021 after a contracted excavator finishes work at the K4-K5 Prospect, 20km to the south.
Close space power auger drilling is being planned to step out along potential strike directions in the immediate vicinity of Morley prior to further work
RAB/ Aircore rig options being investigated to test granite greenstone contact target WNW of Morley.
Chairman’s Comment
Executive Chairman, Dominic O’Sullivan remarked:
“I am simply thrilled that with the Company’s first modest expenditure in Burkina of about USD200,000, we have not only returned some great results but have also established several fairways along which Morley might grow from a modest sized prospect into a potentially much larger one.
We are developing our understanding of the deposit, starting from a rather higgledy piggledy set of drilling with holes and grades going in all directions, into a geologically cogent framework that demonstrates potential for a lot more at Morley. It fits our philosophy – find a poorly understood or overlooked discovery, in a Tier one address and do the hard yakka, looking at all the data from every angle, then follow-up with smart prudent focused exploration.
I’m particularly enthused about the on-strike potential generated by confirming that WNW oriented structures at Morley host gold mineralisation, especially just west of Morley, where the “Morley Structure,” smashes an 800m sinistral displacement into a sheared granite-greenstone contact which itself has a dextral reverse sense of movement. This creates a WNW trending granite-greenstone contact, hugged by the Morley structure for about 800m of strike. That spells a lot of dilation on favourable structures and lithological contrasts. What’s not to like about that? As it’s under cover, never seen before, I feel it’s a bit like a little Chrissy prezzie for us- still under the tree, all wrapped up and we can’t wait to open it.”
Details of the Morley Drill Program
Results reported today are Tajiri’s first steps in our exploration at Morley and as a necessary first precedent to further work it has focused on defining the orientation of mineralisation. Historically, the orientation of mineralisation has been poorly constrained, and several equivocal interpretations could fit historic data due to the following:
Drilling was conducted blind because of a thin veneer (3-10m thick) of cover overlying the Prospect;
Morley is hosted by a single relatively undifferentiated granite lithology and a lack of other lithologies meant models could only be constructed by grade interpolation;
Morley lies in a zone of considerable structural complexity, near the focus of a change in the gross strike of the granite-greenstone belt of 40˚ from ENE to NNE, and major and lessor shears of both orientations together with numerous WNW, NNW, EW and minor N-S orientations transect the area (see Figure 6);
all structures or their intersections could be potential fairways for mineralisation and all structural orientations can be associated with some form of gold anomalism, though the ENE- NNE orientations appear to dominate the distribution of gold anomalism on a regional scale;
drilling to date has been suboptimal to test all possible mineralised orientations and drilling has mostly been oriented either:
North-south and predominantly drilled to the south or
On NW-SE oriented scout drill lines of 200-400m spacing with alternate lines drilled to either the SE or NW.
In our new model, gold mineralisation which occurs as sheeted high grade quartz veins, within low grade sericite + carbonate +/- pyrite altered shear zones hosted by a syntectonic belt scale granitoid is comprised of several 1-20m thick, NW-WNW striking lodes which dip between 40˚and 55˚ to the NE. The best historically drilled lode, “the Main Lode” where current drilling has focused, has a known strike length of about 300m.
Results announced today are highly supportive of our new model and intersections mostly occur where the model predicted. Drill results returned to date demonstrate good apparent down-dip coherence with our model and continuity of between 100m and 150m (100m vertically below surface- base of current drilled depth). Zones remain open down dip. On the other-hand strike direction has only been broadly confirmed but it is beginning to resolve into a WNW rather than NW strike. Further work is required because:
Access to drill the central part of the main lode was restricted as it is the site of a small forest (Figure 2) and permission was not granted by the local community to drill within its confines. Investigation of mineralisation in this area will require deeper drilling, later, as it is beyond the capability of the contracted RC rig.
Mineralisation is abruptly interrupted on the section line comprised of holes MTRC007, 008, 18 and 009. Hole MTRC009 intersected a vein zone grading 2m @ 4.8g/t within 19m @ 1.3g/t from 59m and on-strike from mineralisation intersected in hole MTRC006 to the south (2m @ 4.6g/t from 55m; within 8m @ 1.3g/t from 51m) but only weak anomalism was intersected up dip by MTRC0018 and MTRC008. Based on a feature visible in ground magnetics, it is possible that a post mineralisation fault striking NNW, displaces the Main lode with an with apparent dextral throw of 50m. This interpretation fits with a WNW strike.
As this was a first pass program and the exact strike of mineralisation was unknown at the time of planning- being modelled as between WNW to NW, several holes appear to have collared in the footwall of the Main lode and did not intersect the expected Main lode near surface. These holes are MTRC003, 7, 10, 13 and 19 and the lack of mineralisation in those holes up dip from mineralisation strongly suggest that strike is closer to WNW than to NW (Figure 2).
Variation in the grades and thickness intersected also suggest that there is a second structural orientation that influences the mineralisation at Morley. This second structural control may be an upshot of vein sets having an orientation which is oblique to the orientation of the host shear zone, a common feature of this style of mineralisation but we also believe, based on the overall architecture of all data, that mineralisation is developed preferentially within the WNW structures at their intersection with either ENE or NNE structures that are also evident in ground magnetic images. Evidence for a second significant structural control is:
At the known north end of Morley main lode, it thickens and high-grade vein densities increase (Figure 3) where it is inferred to be intersected by an ENE trending shear zone of weaker mineralisation that was drilled over 400m of strike going west and which returned a peak value of 14m @ 1.1g/ (Figure 4).
All three structural orientations align with the overall shape of a gold in saprolite geochemical anomaly that overlies the Prospect (Figure 4), suggesting all three alignments may be mineralised. With lobes and high values extending along WNW, ENE and NNE orientations. This data was derived from a Newmont 2008, 50m x 50m auger program down to 10 m depth that covered an area of 1,000 x 850m and was conducted after air-core scout drilling had located the prospect.
All three structural orientations align with anomalous gold values returned by regional reconnaissance saprolite sampling auger data which was conducted on lines spaced 400-800m apart and samples collected every 100m (Figure 6).
Several fine scale structures visible in ground magnetics especially 1VD, 2VD and tilt filtered images coincide with all three orientations and higher grades in drilling can be tentatively associated with the intersection of the WNW striking lodes with both ENE and NNE trending structures.
The above brings the possibility of repeats of WNW oriented mineralisation along ENE or NNE directions in effect forming a large-stacked lode system. The orientation of Historic scout drilling outside of the main area of drilling at Morley has poorly tested this concept with scout drill lines oriented subparallel to the WNW strike of mineralisation and lines alternating between down dip and across dip directions. Better oriented north south holes are confined to the norther margins of the prospect. Potential is illustrated in Figure 5
Next steps at Morley
Given the evidence for a second structural control on mineralisation, we have temporarily paused our drill program to undertake deep trenching and pitting to gather structural data and map dominant vein orientations within the shear zones. Once this is done drill direction/s which is currently on NE-SW lines drilling to SW can be optimised to intersect vein sets within the shear zones to give representative grades and investigate potentially higher-grade plunging intersection shoots.
It is expected that trenching will commence early Q1 2021 after a contract excavator completes its work at K4-K5.
Close spaced auger power auger drilling is being planned to extend the Morley footprint in favourable directions.
Finally, options to contract a RAB/Aircore rig to drill the covered granite greenstone contact in the area where the “Morley Structure” intersects it, are being investigated.
Other Exploration
In Burkina
We have commenced trenching at K4-K5 to investigate areas where cover is thinner – in artisanal workings or where drilling shows mineralisation close to surface. Purpose of the program is to collect structural and lithological data and examine mineralisation near surface as previous drilling has been wide spaced and we are not sure if dominant trends are NNE or NE striking. This 2,000m program is expected to be completed by very early next year after which RC drilling will be commenced.
We are also in the advanced stages of planning closer spaced deep auger drilling at K4-K5 to define drill targets within the larger area of K4-K5 outside planned drill areas. The geochemical anomaly at K4-K5 is huge and extends over 7 x 6 km. Part of that program will cover extensions of drilling by Arrow Minerals (ASX:AMD) announced early this year which shows the eastern contact of the regional granite which hosts Morley is prospective. This program is expected to commence shortly.
In Guyana
We have recently completed a small auger program at Epeius to investigate the strike extensions of good results produced by Troy Resources (ASX:TRY) just across the projects southern boundary. Troy’s results include drill intersections of 10m @ 6g/t Au, 17m @2.2g/t Au and trench intersections of 13m @ 2.3g/t Au, 8m @ 2.3g/t Au & 11m @ 1.47g/t Au. An announcement will be made shortly and a follow-up trench program is already underway with 600m linear metres excavated to date.
Posted by AGORACOM
at 10:20 AM on Tuesday, December 8th, 2020
SPONSOR: Candente Copper owns 100% of the Canariaco copper project, which includes the Feasibility stage Canariaco Norte deposit. Canariaco is included in Goldman Sachs 84 Top Copper Projects Worldwide and Fortesque is a 19% owner of Candente.
Copper ore from La Viñita, Valle del Elqui, Chile. (Image by S. Rae, Wikimedia Commons)
Over 200 copper mines are expected to run out of ore before 2035, with not enough new mines in the pipeline to take their place.
In 2018, before the trade war between the US and China put the boots on copper demand, and covid-19 mine closures/ abandoned expansion plans crimped supply, we made a bold prediction: that copper supply is NOT going to be able to keep up with demand in the long-term. Even with expansions at existing mines and the ramp-up of the relatively few new copper mines like Cobre Panama, Radomiro Tomic and Toquepalain, it will not be enough to meet the onslaught of demand that is coming from China as it continues to modernize and urbanize, and electric vehicles, which use three times as much copper as regular ones. In 2016 Chinese automakers sold 28 million cars. If China follows through on its promise to go 100% electric, that would mean 2,380,000,000 kilograms of copper. At the current production rate of 20 million tonnes a year, that’s 119 years worth of copper! Just to produce enough copper for electric cars in China.
Do we expect 100% EV penetration? No. But the shift to electrification of our transportation system is real, it’s not going to go away or stop. Because it’s as real as the shift from wood to coal to fossil fuels and now to lithium. That means massive new copper supplies are needed just for Chinese EVs, whatever the EV penetration eventually turns out to be. And remember there’s the rest of the world to supply for EVs, charging infrastructure, and all of copper’s other uses.
Bottom line? We gotta find more copper.
‘Future-facing metals’
That sentiment is clearly shared by some of the world’s largest copper companies, who are doing everything they can to expand existing mines and acquire prospective new deposits, as they seek to replace their rapidly depleting copper reserves and resources.
In 2017 the Chilean government approved a $2.5 billion expansion of BHP’s Spence copper mine – the diversified miner’s second largest copper mine behind Escondida, the biggest copper operation in the world.
That followed closely behind BHP’s 2016 decision to raise its annual exploration budget by 29%, allocating nearly all of its $900 million budget to finding new copper and oil deposits – two commodities the world’s largest miner thinks it needs to bolster future growth. Potential acquisition targets include copper deposits in Peru, the US, Canada and South Australia.
In February of this year, chief executive Mike Henry said the company needs more “future-facing metals” such as copper. Last year, BHP became the top shareholder in SolGold, an Australian miner developing the Cascabel copper-gold project in Ecuador.
Last week, BHP announced it is ramping up work on the Spence mine expansion, to reach its production objective in the first half of 2021 (the project has been delayed due to covid-19 restrictions).
It’s interesting to note that BHP is planning to “go green” at Spence, with a focus on running the operation entirely on renewable energy by 2022. The Melbourne, Australia-based company also aims to stop drawing water from aquifers in Chile by 2030 – a reference to the problems mining companies are facing getting enough water in the bone-dry Atacama desert of northern Chile, the base of operations for several major copper and lithium mines.
The $2.5 billion expansion contemplates a concentrator plant to increase production, and extend the life of the deposit by about 20 years. The new mine will also feature an $800 million desalination plant located in the port city of Mejillones, about 60 km north of Antofagasta, that treats and pumps seawater at 1,000 liters per second.
BHP isn’t the only large mining firm taking a serious look at copper. Barrick Gold is interested in diversifying into the red metal from the yellow. CEO Mark Bristow sees Indonesia’s Grasberg, the second-largest copper mine in the world, as a potential buy-out target for Barrick. The company already owns the Porgera mine in Papua New Guinea, which borders Indonesia to the east, with China’s Zijin Mining. In May, Bristow told the Financial Times he was keen to expand in Asia, despite a recent dispute with the government of PNG over a renewal of Porgera’s license, which led Barrick and Zijin to shut the mine.
Meanwhile the CEO of Anglo American, another major diversified miner, indicated that South Africa would be a good jurisdiction to explore for base metals. “We will explore base metals across South Africa… We are already in Zambia and other places, we want to do more in South Africa so we are looking for adjustments in legislation there,” Mark Cutifani said during the 2020 Joburg Mining Indaba conference.
Copper, nickel, lead and zinc are among the base metals Anglo American is focusing its global discovery strategy in greenfield and brownfield projects.
Running out of ore
Why are major mining companies so intent on securing new supplies of copper? Quite simply, they’re running out of ore.
As we have reported, without new capital investments, Commodities Research Unit (CRU) predicts global copper mined production will drop from the current 20 million tonnes to below 12Mt by 2034, leading to a supply shortfall of more than 15Mt. Over 200 copper mines are expected to run out of ore before 2035, with not enough new mines in the pipeline to take their place.
Some of the largest copper mines are seeing their reserves dwindle; they are having to dramatically slow production due to major capital-intensive projects to move operations from open pit to underground.
Grasberg in Indonesia, the world’s second-largest copper mine, is emblematic of the problems copper miners are facing. The mine began as a large open pit but after decades of extracting the easy-to-reach ore is gone and future production is expected to come from a deep cave deposit known as the Deep Mill Level Zone. Copper concentrate exports have plunged dramatically as operations shift from open pit to underground.
Major South American copper miners have also been forced to cut production. State-owned Codelco has said it will scale back an ambitious $40-billion plan to upgrade its mines over the next decade, after reporting a drop in earnings, a prolonged strike at its Chuquicamata mine, and lower metals prices. The world’s largest copper company also said it will reduce spending through 2028 by 20%, or $8 billion.
Chuquicamata is expected to see a 40% fall in production by 2021. A $5 billion expansion, moving from open pit to underground, will take five years to reach full output of 300,000 tonnes per annum – this is not new production.
Shipments from BHP’s Escondida mine took a hit in 2019 due to operations moving from open pit to underground. The largest copper mine on the planet is expected to take until 2022 to re-gain full production, again not new production.
These cuts are significant to the global copper market because Chile is the world’s biggest copper-producing nation — supplying 30% of the world’s red metal. Adding insult to injury, for producers, copper grades have declined about 25% in Chile over the last decade, bringing less ore to market.
Country-wide protests over transit prices and perceived inequality have disrupted mining supply chains. The social unrest, along with a newly invigorated resource nationalism, has spooked would-be foreign investors in a country that only a few years ago was touted as an economic tiger.
Chile also has problems with water. The country’s underground reservoirs need to be recharged by rainfall and snowmelt from the Andes, but a study found more water was leaving the salars (salt flats) than returning, prompting water restrictions affecting both lithium and copper mines in the extremely arid Salar de Atacama, in northern Chile. In 2019 Chile’s water authority said it would double the number of areas off-limits to mining, from 30 to at least 70.
Escondida will stop drawing fresh water from the salt flat. Instead, the huge mine will bring desalinated water from the coast, where in 2018 BHP spent $3.4 billion on a desalination plant. Two pipelines transport water a steep 3,200m above sea level.
Antofagasta’s Zaldivar mine is nearing its mine life at 2029, and may be forced to close earlier if its water permits to draw water from the salar are not renewed.
A 2019 report by Moody’s Investors Service said that some of the worst droughts in half a century have led to tougher environmental regulations that are hiking miners’ costs and risks. Among the countries with mines exposed to decreasing water availability are Peru, Chile, Australia, South Africa and Mongolia.
On top of all this, there is the ongoing threat of strikes at South American copper mines which every year strip out some percentage of output. In a recent article, Bloomberg reports how a confluence of factors, including copper prices at a seven-year high, productivity gains (Chile is producing at similar levels to last year with fewer workers) and weak local currencies, are swelling industry margins, emboldening unions to down tools and ask for more pay/ benefits. Look for labor disruptions next year, when 31 contracts are due to expire in Chile, including at BHP’s Escondida, hit by a 44-day strike in 2017.
What about new copper mines? Surely mineral exploration companies are identifying new ore bodies, cueing up the next generation of copper producers?
Well, they are trying. Problem is, they are having to go further afield and dig deeper to find copper at the grades needed to economically produce copper products for end-users. This usually means riskier jurisdictions that are often ruled by shaky governments with an itchy trigger finger on the resource nationalism button. Combine that with production problems and you have the makings of a supply shortage.
In fact, new supply is concentrated in just five mines – Chile’s Escondida, Spence and Quebrada Blanca, Cobre Panama and the Kamoa-Kakula project in the DRC. And while these mines are expected to account for 80% of base-case output increases until 2022-23, their profitability depends on the copper price staying above $5,000 a tonne, according to analysts at Bank of America Merrill Lynch.
The current copper pipeline is the lowest it’s been in a century, and not improving. In 2018 Colin Hamilton, the director of commodities research at BMO Capital Markets, said that after the delivery of first copper from Cobre Panama (285-310,000t per year), BMO doesn’t see the next batch of +200,000-tonnes projects until 2022-23 — “when the likes of Kamoa (501,000t per year), Oyu Tolgoi Phase 2, and QB2 (316,000t per year) are likely to offer meaningful supply growth.”
Electrification 2.0
Copper’s widespread use in construction wiring & piping, and electrical transmission lines, make it a key metal for civil infrastructure renewal.
The continued move towards electric vehicles is a huge copper driver. In EVs, copper is a major component used in the electric motor, batteries, inverters, wiring and in charging stations. An average electric vehicle contains about 4X as much copper as regular vehicles. Electrification includes not only cars, but trucks, trains, delivery vans, construction equipment and two-wheeled vehicles like e-bikes and scooters.
The latest use for copper is in renewable energy, particularly in photovoltaic cells used for solar power, and wind turbines. The base metal is also a key component of the global 5G buildout. Even though 5G is wireless, its deployment involves a lot more fiber and copper cable to connect equipment.
The big question is, will there be enough copper for future electrification needs, globally? And remember, in addition to electrification, copper will still be required for all the standard uses, including copper wiring used in construction and telecommunications, copper piping, and copper needed for the core components of airplanes, trains, cars, trucks and boats.
The short answer is no, not without a massive acceleration of copper production worldwide.
A recent research report from Jefferies Research LLC concluded: “The copper market is heading into a multiyear period of deficits and high demand from deployment of renewable energy and electric vehicles. Secular demand driver in copper is electric passenger vehicles as the average EV is about four times as copper intensive as the average ICE automobile. Renewable power systems are at least five times more copper intensive than conventional power.”
President-elect Joe Biden plans a major shift away from fossil fuels to wind and solar power, and from gas/ diesel vehicles to EVs. In what would be a significant scale-up of President Obama’s 2009 plan to electrify the US transportation system, a kind of “electrification 2.0”, Biden aims to spend up to $1.7 trillion over 10 years on boosting renewable power and speeding introduction of electric vehicles.
Dubbed “Clean Energy Revolution”, the plan calls for installation of 500,000 electric vehicle charging stations by 2030, and would provide $400 billion for R&D in clean technology.
One of the largest manufacturers of public charging stations, ChargePoint, is targeting a 50-fold increase in its global network of loading spots by the mid-2020s. The group in which German companies BMW, Daimler and Siemens hold stakes, aims to operate 2.5 million charging points by 2025, from 53,000 in 2018. A Level 2 charging station requires 7 kg of copper, a direct current fast charger (DCFC) or Level 3 station uses 25 kg.
BloombergNEF forecasts by 2040 there will be a need for 12 million charging points, each requiring about 10 kg of copper. The number of EV charging stations recently passed the one million mark.
Biden has also promised a $1.3 trillion infrastructure improvement plan, including: a $50 billion investment in repairs to roads and bridges; $10 billion for transit construction in poor areas of the country; a doubling of BUILD and INFRA grants, and more funding for the US Army Corps of Engineers.
The plan includes investments in high-speed rail, public transit, bicycling, school construction, expansion of rural broadband, and replacement of pipes and other water infrastructure — all of which will require millions more tonnes of copper, along with other infrastructure metals such as nickel, zinc and aluminum.
Is this going to happen for the US? Well if it is, it isn’t going to come cheap, as existing metal sources run dry. Across the Atlantic, the UK government has set a target of replacing all of its 31.5 million cars with electrics by 2050. A team of scientists led by the Natural History Museum’s head of earth sciences, Professor Richard Herrington, took the government to task and calculated how much raw materials that number of EVs would require.
The researchers found that to build 31.5 million EVs would take a jaw-dropping 207,900 tonnes of cobalt, 264,600 tonnes of lithium carbonate, at least 7,200 tonnes of neodymium and dysprosium, and 2,362,500 tonnes of copper — about 10% of global production. Just mining the amount of raw materials required to replace 2 billion cars globally would require four times the United Kingdom’s total annual electrical output.
Prof. Herrington told AutoExpress that, while there is urgency in cutting carbon dioxide emissions, “society needs to understand that there is a raw material cost of going green”.
US and UK copper needs, of course, have to be put in context with global demand for the essential base metal.Total copper mine production worldwide from 2006 to 2019 (in 1,000 metric tons)
According to BloombergNEF, there are currently about 7 million electric vehicles in the world today. By 2040, they estimate around 30% of the world’s passenger cars will be electric. To me that’s a conservative and reasonable number. It means 500 million EVs will be on the road in 20 years, out of a total vehicle fleet of 1.6 billion. If each EV contains 85 kg of copper, that is 42,500,000,000 kg, or 42,500,000 tonnes of copper, roughly twice the current volume of copper produced by all of the world’s copper mines.
Just so we’re clear — in 20 years, BloombergNEF says copper miners need to double the amount of global copper production (20Mt), just to meet the demand for a 30% penetration rate of electric vehicles. That means an extra million tonnes a year, over and above what we mine now, every year for the next 20 years! The world’s copper miners need to discover the equivalent of two Kamoas, at 500,000t, each and every year, while keeping current production at 20Mt.
Remember we still need to cover all the copper demanded by electrical, construction, power generation, charging stations, renewable energy, 5G, high-speed rail, etc., plus infrastructure maintenance/ buildout of new infrastructure.
That might be another 5-7Mt. So not only is there a 20Mt increase in copper usage required for a 30% EV penetration, but another (we estimate) 5-7Mt increase to meet demand for all of copper’s other applications. To keep up, the industry will need to find an additional two to three Kamoas a year, each producing 500,000t, for the next 20 years! Remember – Over 200 copper mines are expected to run out of ore before 2035, with not enough new mines in the pipeline to take their place. It’s going to be hard enough to keep up the current 20mt per year let alone add so much more production.
Where is this new, and replacement, supply going to come from? When copper becomes so rare it hits $10,000 a tonne, what’s going to happen to 30% EV penetration? High-speed rail? 5G? We suggest that without new copper deposits, these well-intentioned plans are in jeopardy.
Did we mention China’s Belt and Road Initiative (BRI), consisting of a vast network of railways, pipelines, highways and ports that would extend west through the mountainous former Soviet republics and south to Pakistan, India and southeast Asia?
Research by the International Copper Association found BRI is likely to increase demand for copper in over 60 Eurasian countries to 6.5 million tonnes by 2027, a 22% increase from 2017 levels.
Another report by Roskill forecasts total copper consumption will exceed 43 million tonnes by 2035, driven by population and GDP growth, urbanization and electricity demand. Remember total world mine production in 2019 was only 20Mt. In many countries it takes 20 years to go from discovery through permitting to mining.
Copper goes critical
But there’s a weird thing happening. The message of a looming copper shortage that could bring the global electrification shift to a screeching halt, and/or make copper so dear that only the rich can afford to buy finished products made from it, like EVs, isn’t getting through to the mining audience, because copper is not considered a critical mineral.
That term is reserved for minerals like lithium, cobalt, graphite, rare earths etc., which despite their presumed rarity, are actually fairly common. What makes them critical, is the fact that North America (and Europe) have virtually no domestic supply; without mines and a pipeline of deposits under development, and the smelters and know-how to process them, we are hopelessly reliant on foreign countries. Our supply chains are vulnerable and can be exploited at will by the countries that dominate production, through policies like domestic ore beneficiation, export restrictions, tariffs and quotas.
For years North America didn’t bother to explore for these minerals and build mines. Globalization brought with it the mentality that all countries are free traders, and friends. Dirty mining and processing? NIMBY. Let China do it, let the DRC do it, let whoever do it. This has to change, if the US and Canada are to regain control of their critical minerals stockpiles.
For example, according to the US Geological Survey, of the 7 million tonnes of cobalt reserves available globally, nearly half — 3.6Mt — are in the Democratic Republic of the Congo (DRC). The DRC is the world’s leading cobalt supplier by far, in 2019 producing 100,000 tonnes of the EV battery ingredient. China locked up supply from the DRC with infrastructure for off-take, brings it home and refines it to sell to the world. But there is a lot of cobalt found elsewhere. Australia has 310,000 JORC-compliant tons of cobalt but only mined 5,100t last year. Canada has a reserve of 300,000t but only produced 3,000t. Of the 55,000 tonnes of cobalt reserves identified in the US, only 0.01% was mined in 2019, or 550t.
North America is well endowed with huge, quality rare earth deposits, enough to supply us with decades and decades of production. Examples include Commerce Resources’ (TSXV:CCE) Ashram rare earths deposit in Quebec, and Ucore Rare Metals’ (TSXV:UCU) Bokan Mountain REE project in Alaska. Graphite One (TSX.V:GPH) has an excellent graphite project in Alaska.
What we lack is processing and larger-scale manufacturing, ie. nearly all of the world’s mined rare earth oxides are processed in China; only very recently has REE processing started happening outside that country:
Mountain Pass in California expects to start processing REEs by the end of 2020.
Lynas signed a joint venture agreement with Blue Line Corp. to build a rare earths processing plant in Texas.
Saskatchewan is setting up a processing facility.
(Europe is also starting to get smart and deal with its lack of critical minerals mined and processed on the continent. The EU recently launched the European Raw Materials Alliance, a partnership of over 300 companies, business associations and governments, that will focus on breaking Europe’s dependence on imports from China and other resource-rich countries. Analysts estimate the group of 29 nations will need about 60 times more lithium and 15 times more cobalt for EV batteries and energy storage by 2050.)
Graphite is another mineral that is mined and processed under a near monopoly by China but exists in large quantities elsewhere. According to the USGS, China in 2019 produced nearly three-quarters of the world’s graphite — 700,000 tonnes of the 1.1Mt total. The country indeed has a large proportion of global graphite reserves, 73Mt out of 300Mt. But China doesn’t host the majority of the world’s graphite. In fact Turkey has more, 90Mt, yet last year only mined 2,000t. 25 million tonnes are held by Mozambique but the African country only produced 100,000t. Brazil has nearly as much graphite as China, 72Mt, but in 2019, produced just 96,000 tonnes, about 13% of China’s mine production. Other countries with significant graphite reserves, are India (8Mt), Madagascar (1.6Mt), Mexico (3.Mt), Tanzania (18Mt) and Vietnam (7.6Mt).
Certainly the above-mentioned metals, and the rest of the 23 mineral commodities identifed by the US Department of the Interior, are critical, in that they are all important to the country’s economic and military security. You cannot, for example, make a lithium-ion battery without lithium, graphite and cobalt. But most of these metals are labeled critical because so much quantity comes from China, Russia or the DRC. Too much supply is coming from one country and China is where most of the refining is done. When we start mining and processing here in the West, or work with our mining country allies, some degree of ‘criticality’ will be removed. Why can’t we start mining all these minerals here? We have these materials in North America, South America, Australia and to a lesser extent, Europe. The next step is unfettered access and the creation of strong supply chains to get these metals from mine to market.
Copper, however, is different. Arguably, the red metal is the most critical of all critical metals, because of its necessity in electrification, and the fact that there is an actual shortage of copper coming.
There is no shift from fossil fuels to green energy without the red metal, which has no substitutes for its uses in EVs (electric motors and wiring, batteries, inverters, charging stations) wind and solar energy, and 5G.
Even with a 30% penetration of EVs, a relatively conservative estimate, we need to find another 20 million tonnes per year over 20 years.
On Tuesday, Nov. 24 copper prices hit a fresh 2020 pinnacle of $3.52 per pound on the Comex in New York. The red metal’s best performance in seven years was on the strength of Chinese manufacturing and construction expanding at its fastest in a decade. The country’s manufacturing PMI for November, seen as a leading indicator of copper usage, rose to 52.1 while the Caixin manufacturing PMI, which includes both large and small firms, jumped to a 10-year high of 54.9. The construction index leapt from 59.8 in October to 60.5.
Iron ore has also been on a tear of late. The steelmaking ingredient hit $132.13 a tonne last Tuesday, a six-year high.
The numbers are so good, some market observers are pulling up charts from the “mining supercycle”. Reuters quotes Goldman Sachs predicting a return to the “structural bull market” of the 2000s, when most mined commodity prices got a lift due to demand (especially in China and India) outstripping available supplies. In a report the investment bank states:
“Covid is already ushering in a new era of policies aimed at social need instead of financial stability [which] will likely create cyclically stronger, more commodity-intensive economic growth, that should create the elusive cyclical upswing in demand.”
Metal traders say copper is looking like it did at the start of the ’03 supercycle start, having surged this year on a wave of bullish factors including a weakened dollar, optimism over covid vaccines, a move toward low-carbon power sources, and virus-related supply disruptions in the key copper-producing countries of Chile, Peru and Mexico. Prices are up more than 70% from a mid-March low, and Morgan Stanley predicts a substantial increase next year, to an average $7,716 a ton ($3.85/lb) in the fourth quarter.
However unlike the previous supercycle, which depended on China, Goldman says the next structural bull market will be driven by spending on green energy, for which copper is a key ingredient:
“Spending on green infrastructure could be as significant as the BRIC (Brazil-Russia-India-China) investment boom of that decade while the redistributive push in developed markets “is likely to lead to a large boost to consumer spending, comparable to the lending-fuelled consumption increase in the 2000s”.
The path of least resistance to the price of copper is, imo, higher.
Posted by AGORACOM
at 11:58 AM on Monday, December 7th, 2020
On Friday December 4th, Seabridge Gold (SEA) announced its intentions to purchase the Snowfield deposit from Pretium Resources (PVG), details here. As a result, we experienced a high volume of emails and calls as to how this may affect Treaty Creek. In our opinion, we think it’s a positive move for all three projects located in the Sulphurets Hydrothermal System. Our analysis of the transaction and the associated benefits is as follows:
Below is an image created by Seabridge showing the KSM and Snowfield deposits and the relative gold grades/value of those deposits. Technically, the Snowfield is the top part of the Mitchell deposit, which it sits beside.
On its own, the Snowfield added no present value to Pretium in the near term for a few reasons: The Snowfield has a very low-grade halo that on its own, at present gold values, isn’t profitable to produce. It has a higher-grade core but that core isn’t large enough to justify the costs to get it out at today’s gold price. Logistics. Because the Snowfield is located upslope above the Mitchell deposit in the Mitchell valley, mine construction would have been very difficult due to the terrain combined with the proximity to the Mitchell deposit located below owned by Seabridge. Access. Even if the gold grades were higher and there was room to develop the Snowfield on its own, there appears to be no feasible way to get the ore to market except through the proposed Mitchell Teigen Tunnels (MTT) which (if built) would be owned by Seabridge. The above, and perhaps some other reasons as well, is why the Snowfield deposit has been sitting there with no progression for many years, which in its present state added zero value to Pretium. It could be argued that a sale worth $3 USD per ounce in the ground is a lot better than $0 per ounce while it sits dormant. We think this was a great deal for PVG as they get: $100m up front in working capital $20m down the road A Net Smelter Royalty (NSR) of 1.5% down the road
By combining the Snowfield with the KSM, SEA removed the “higher grade core isn’t big enough on its own” problem, the “no room” problem, and the “access” problem. We think this was a great deal for SEA as it helps them accomplish their goals:
Improve their ounces/share ratio
Improve the NPV and IRR on the KSM
Allow them to defer underground operations until later in the production schedule
Pay down the Cap-X for the KSM quicker
We think this a great deal for Treaty Creek (TC) shareholders (TUD, AMK, TUO) because anything that improves Seabridge’s chances of going into production is potentially beneficial to us:
The only route for the KSM to go into production is through the use of the MTT which closely follows both the Kyba Line and the Sulphurets Thrust Fault through most of TC (this is the most heavily mineralized trend though TC including the Perfect Storm (PSZ), the Goldstorm (GS), and orpiment (GS2) zones as seen on the image above.
If SEA is able to find a route through TC without disturbing potential deposits then it will build important infrastructure (bridge, roads, power, etc.) right onto TC.
If SEA isn’t able to find a route through TC without disturbing potential deposits then SEA potentially will form an agreement with TC owners (benefiting TC shareholders) followed by building important infrastructure right onto TC.
A second mine, especially one of this magnitude, going into production within the Sulphurets Hydrothermal System will undoubtedly capture the attention of investors and mining companies and shine a spotlight on the third project advancing in the same system; Treaty Creek.
The $3 USD per ounce paid for the Snowfield was a good deal for both companies and has no real bearing on potential insitu gold deposits and associated valuations at TC. It’s all a question of grade, logistics, and potential buyers. The Snowfield has low grade, horrible logistics (to be developed on its own) and potential for only one buyer (SEA). TC sits “on the right side of the mountain” only 20km away down a valley from the highway and the cheapest power in the world. The Goldstorm zone also has its highest gold grades right at surface (300 zone) over a very extended area opposed to dipping steeply into the ground. The logistics, and therefor potential Cap-X and Op-X, are completely different at TC vs both the Snowfield and the KSM.
In conclusion, we believe that the Snowfield purchase by Seabridge will positively impact every company located within the Sulphurets Hydrothermal System. We view this as another very positive development in the rapid progression of Treaty Creek’s development.
Posted by AGORACOM-JC
at 9:23 PM on Sunday, December 6th, 2020
When Goldman Sachs Says your copper deposit is one of the top 80 projects waiting to be developed worldwide, investors should pay very close attention.
That’s especially true when copper is trading at $USD 3.50/pound, a level not seen since 2013, when Candente Copper (DNT:TSX) was valued at $250 million.
Candente owns Cañariaco Norte, a large, economic, copper ore body in Peru waiting to be mined.
Highlights are as follows.
100% owned feasibility-stage porphyry copper deposit; a single, contiguous, open-pit mineable deposit of:
7.5B pounds Measured and Indicated and can be mined for 22 years once in production.
Once in production Canariaco is in the lowest quartile of production costs for projects waiting to be developed.
Operating costs of US$0.988 per pound of copper
Capable of generating annual production of 262,000,000lbs of copper, 39,000 oz gold & 911,000 oz silver over initial mine life of 22 yrs(@ 95,000 tpd).
WHO ELSE BELIEVES IN CANDENTE?
Fortescue is one of the largest global iron ore producers in the world and recently increased its strategic ownership in Candente to 19.9%.
With a market cap of just $20 million, Candente is now beginning the process of reclaiming its former glory with plans to put Cañariaco Norte into production.
Watch this great interview with Candente CEO Joanne Freeze.
Posted by AGORACOM
at 12:01 PM on Thursday, December 3rd, 2020
SPONSOR: Candente Copper owns 100% of the Canariaco copper project, which includes the Feasibility stage Canariaco Norte deposit. Canariaco is included in Goldman Sachs 84 Top Copper Projects Worldwide and Fortesque is a 19% owner of Candente.
Industrial metal boosted by China’s economic rebound and ‘green stimulus’ expectations
(Bloomberg) — Copper powered to a seven-year high as the rush for growth played out in metals markets, with traditional haven gold dropping amid growing optimism for an end to the coronavirus pandemic.
Bullion extended losses below $1,800 an ounce and copper added to a four-week surge on bets the looming roll-out of Covid-19 vaccines will help drive an economic recovery. The moves deepen a wider pivot into risk assets in November, with global stocks heading for a record month.
“Robust price rallies in industrial commodities like copper point to an ongoing rotation from a risk-averse to risk-on asset market regime,” Citigroup Inc. analysts including Aakash Doshi wrote in an emailed note. Gold faces a “more uncertain path in 2021” as global growth prospects improve, they said.
The latest boost for risk appetite came over the weekend, when two of America’s top health officials said a vaccine will be deployed across the U.S. before the end of the year. Elsewhere, an index of China’s manufacturing sector rose to a three-year high on Monday and the country is taking steps to boost domestic consumption, including of autos and home appliances.
“Macro factors are driving copper trading,” Chinese brokerage Jinrui Futures Co. wrote in note on Monday. “The market sentiment is really bullish right now amid a combination of vaccines, economic recovery, and a smooth U.S. presidential transition.”
Copper rose as much as 2.6% to $7,692.50 a ton, the highest since March 2013. The metal traded at $7,634 by 9:55 a.m. London time and is heading for the biggest monthly gain since 2016.
Iron ore also joined the rally, with Singapore futures up 1.3% and heading for a monthly gain of more than 11%. Prices briefly spiked more than 9% to touch $140 a ton, the highest since futures began trading in 2013, before swiftly paring gains.
Gold fell 0.8% to $1,773.59 an ounce, on track for a fourth straight monthly loss. Silver dropped 1.8%.
Bullion is suffering as investors reverse this year’s hunt for havens amid deep economic ruptures and a fractious U.S. general election. But other factors that favor gold — ultra-dovish monetary policy and the risk of steeper inflation — remain in place.
”The current weakness of gold is all the more remarkable given that the U.S. dollar is likewise weak,” Carsten Fritsch, an analyst at Commerzbank AG, said in an emailed note. “After the price fell below the support level at $1,800 on Friday, the technical picture became even more gloomy, which no doubt has prompted further short-term-oriented investors to withdraw.”
Posted by AGORACOM
at 8:23 AM on Monday, November 30th, 2020
VANCOUVER, British Columbia, Nov. 30, 2020 (GLOBE NEWSWIRE) — Candente Copper Corp. (TSX:DNT, BVL:DNT) (“Candente Copper”, “Company”) is pleased to announce that the Company has entered into an Assignment Agreement (“AA”) with Forte Copper Corp. (“Forte Copper”), on the Don Gregorio copper-gold porphyry project.
The Company entered into an Option Agreement on the Don Gregorio project with Forte Copper (previously known as Plan B Minerals) in 2017. The recently signed Assignment Agreement allows Forte Copper to move ahead with applications for drilling permits.
Under the Assignment and Option Agreements Forte Copper has the right to earn a 60% interest in the Don Gregorio property by completing the following terms:
Making payments of US$500,000 to Candente; and
Drilling 10,000 metres within three years of receiving drilling permits of which 5,000 metres must be drilled within two years; Forte Copper may pay $100/metre cash in lieu of metres not drilled.
The Assignment Agreement is for 5 years such that if the 10,000 metres have not been drilled (including cash paid in lieu), then the property must be returned to Candente Copper Corp.
To date, the Company has received payments totalling: US$100,000 and reimbursements for fees for annual mineral rights totalling US$41,540.
Candente Copper acquired the Don Gregorio from the Peruvian government in a competitive auction in 2008. Don Gregorio covers a mineralized (copper-gold) porphyry system, that occurs within the same geological trend as Yanacocha, Cerro Corona and Cañariaco.
Don Gregorio (previously referred to as La Huaca) was discovered by Ingemmet (Peruvian government geological survey) in 1974 during a regional exploration program. In 1977, 8 holes were drilled to a maximum of 107 metres (“m”) and intersected o.22 to o.56% Cu over 15m to 100m, averaging 50m and bottoming in mineralization. These holes were not analysed for gold.
In 1992, a Newmont Buenaventura Joint Venture (“JV”) discovered a gold (“Au”) zone in surface samples covering 200m by 700m coincident with copper (“Cu”) previously delineated in a north-northwesterly trending zone. In 1995, the Newmont-Buenaventura JV drilled 4 holes in 800m. These 4 holes were also mineralized to final depths.
The 12 holes totalling 1,642m drilled to date indicate copper and gold mineralization occurs over a minimum of 400m vertically from 2,600 to 2,200 metres in elevation.
Mineral intercepts in the historic drilling include 153.3m of 0.394 percent (“%”) Cu & 0.18 grams per tonne (“g/t “) Au.
Surface samples collected to date include assays of:
20m of 1.23% Cu and 0.26 g/t Au
9m at 1.13% Cu and 0.90 g/t Au
3m at 1.36% Cu and 0.84 g/t Au
About Candente Copper Candente Copper is a mineral exploration company engaged in the acquisition, exploration, and development of mineral properties. The Company is currently focused on its 100% owned Cañariaco project, which includes the Feasibility stage Cañariaco Norte deposit as well as the Cañariaco Sur deposit and Quebrada Verde prospect, located within the western Cordillera of the Peruvian Andes in the Department of Lambayeque in Northern Peru.
About Forte Copper Forte Copper is a private company that announced a go public RTO transaction with Collingwood Resources on August 18, 2020. Through its wholly owned Peruvian subsidiaries, Forte either owns, controls or, has an option to control three prospective gold and copper exploration projects in Peru. Forte Copper’s business strategy is focused on exploration target development, testing and resolution, and resource development within prominent and under-explored copper and gold regions of Peru.
Joanne C. Freeze, P.Geo., CEO, is the Qualified Persons as defined by National Instrument 43-101 for the projects discussed above. She has reviewed and approved the contents of this release.
This news release may contain forward-looking statements including but not limited to comments regarding timing and content of upcoming work programs, geological interpretations, receipt of property titles, potential mineral recovery processes, etc. Forward-looking statements address future events and conditions and therefore involve inherent risks and uncertainties. Actual results may differ materially from those currently anticipated in such statements. Candente Copper relies upon litigation protection for forward-looking statements.
On behalf of the Board of Candente Copper Corp.
“Joanne C. Freeze” P.Geo. President, CEO and Director ___________________________________ For further information please contact:


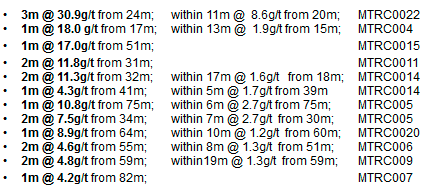
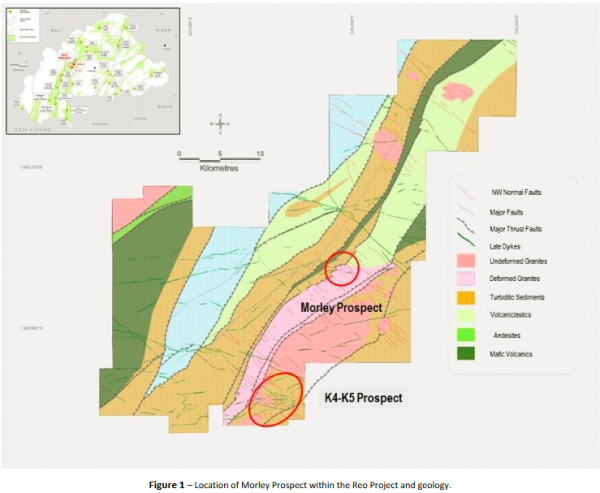
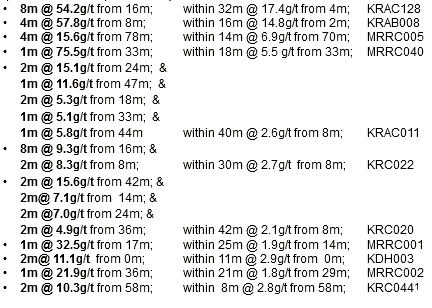
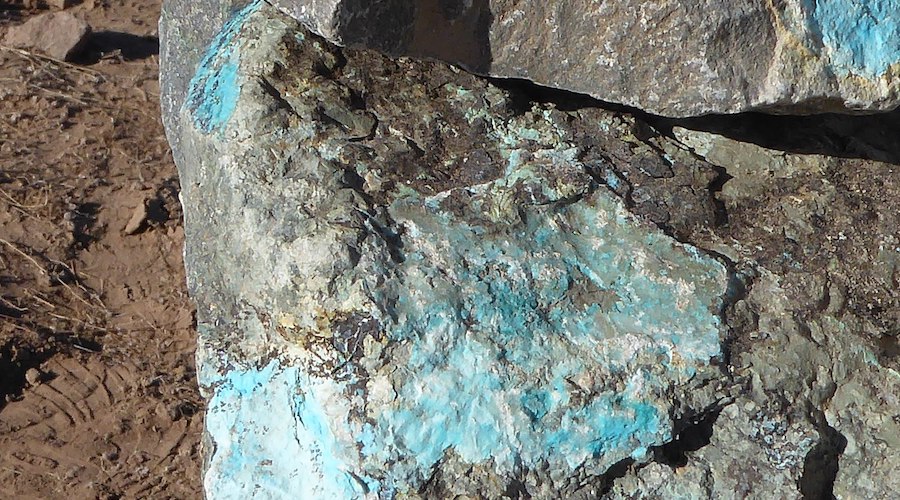
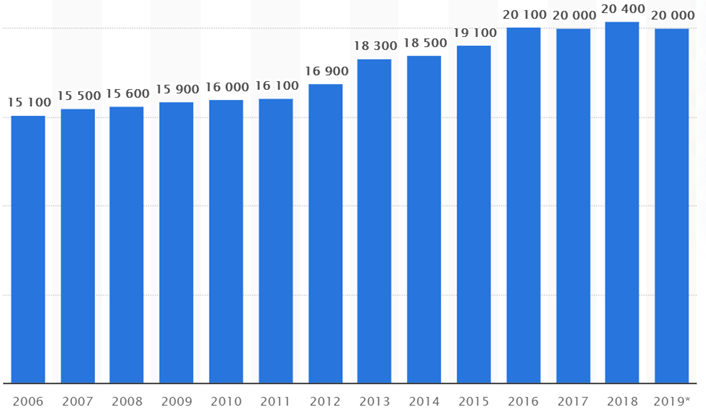 Total copper mine production worldwide from 2006 to 2019 (in 1,000 metric tons)
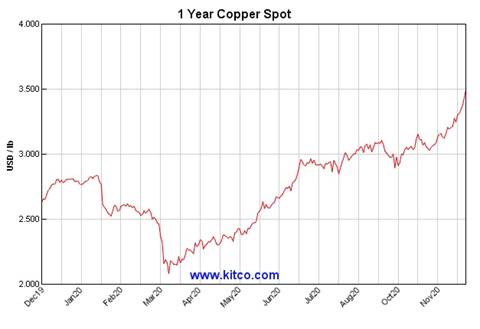
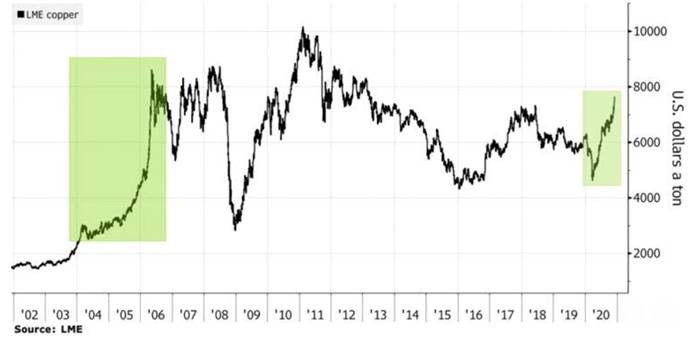


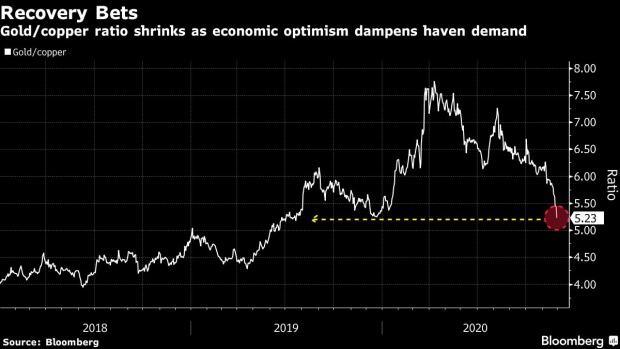
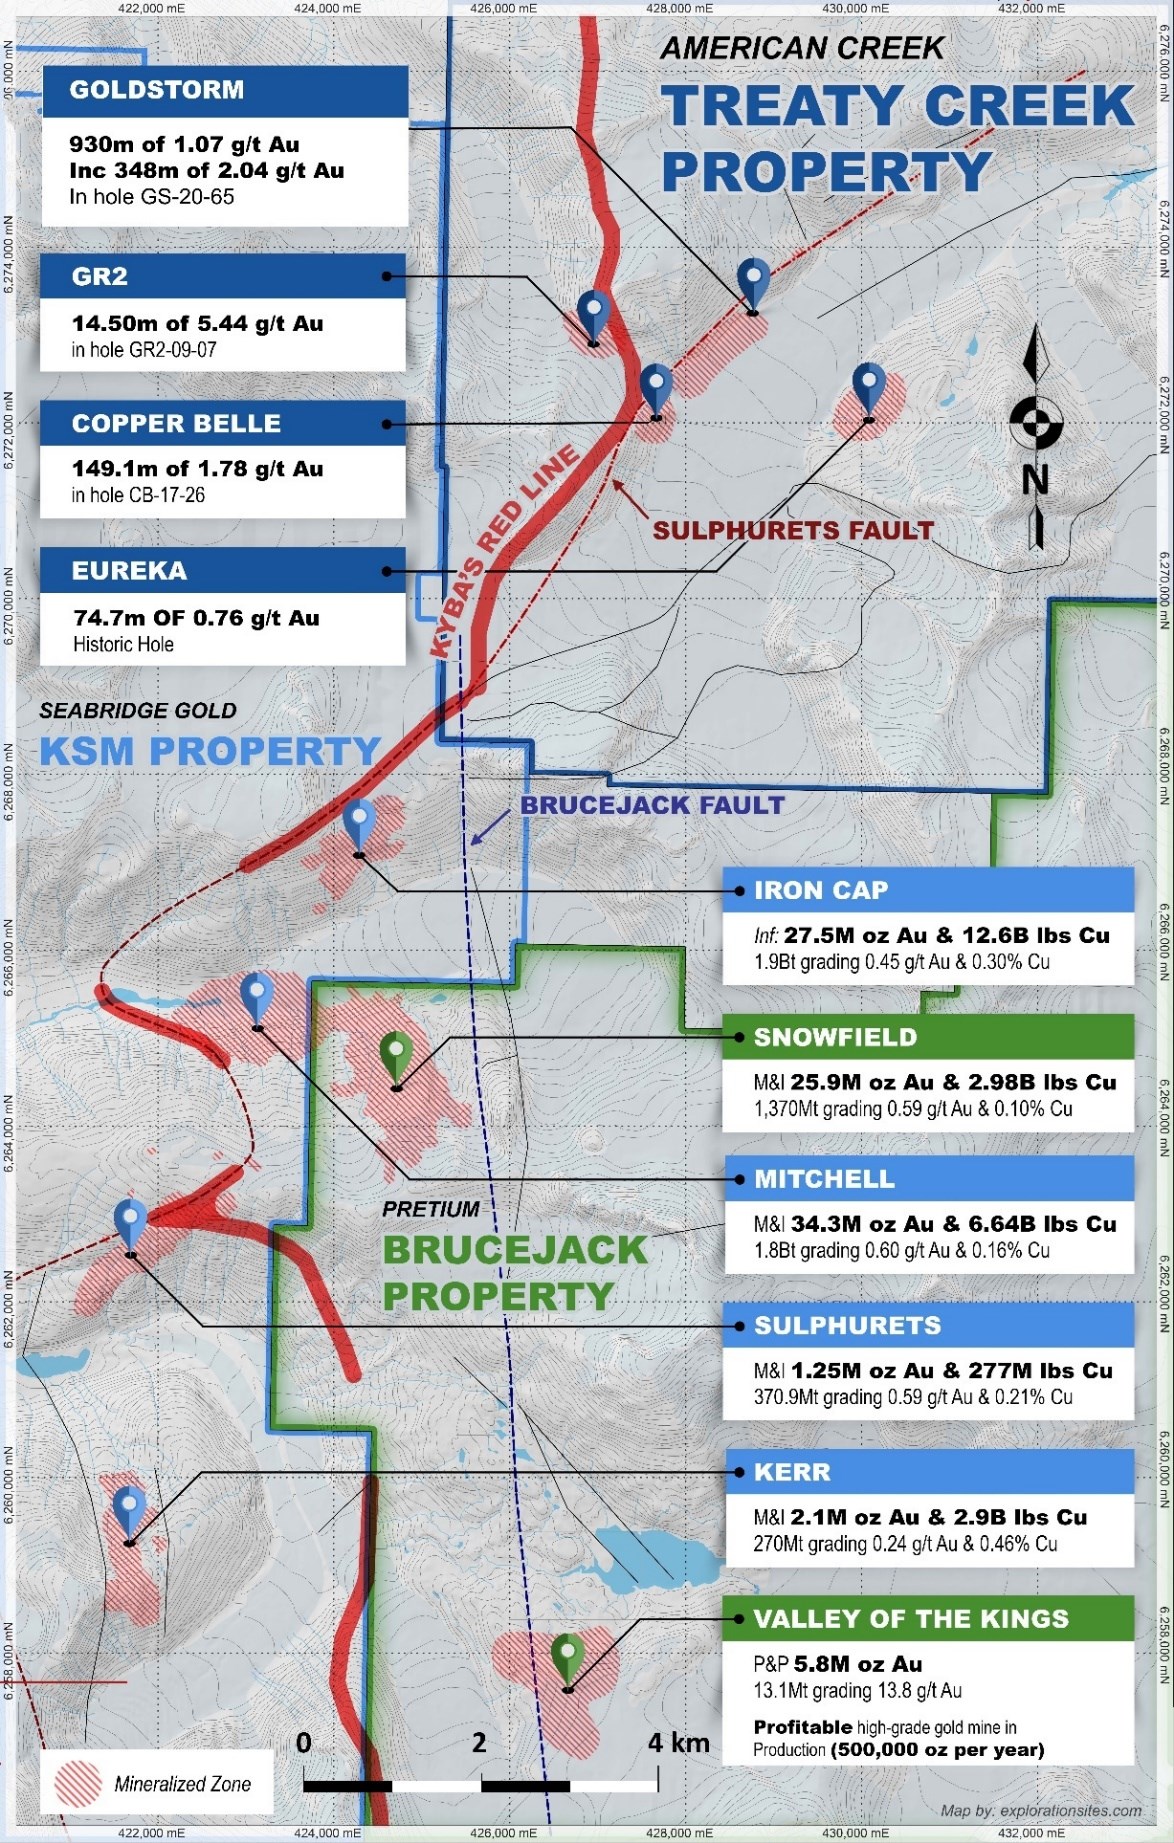
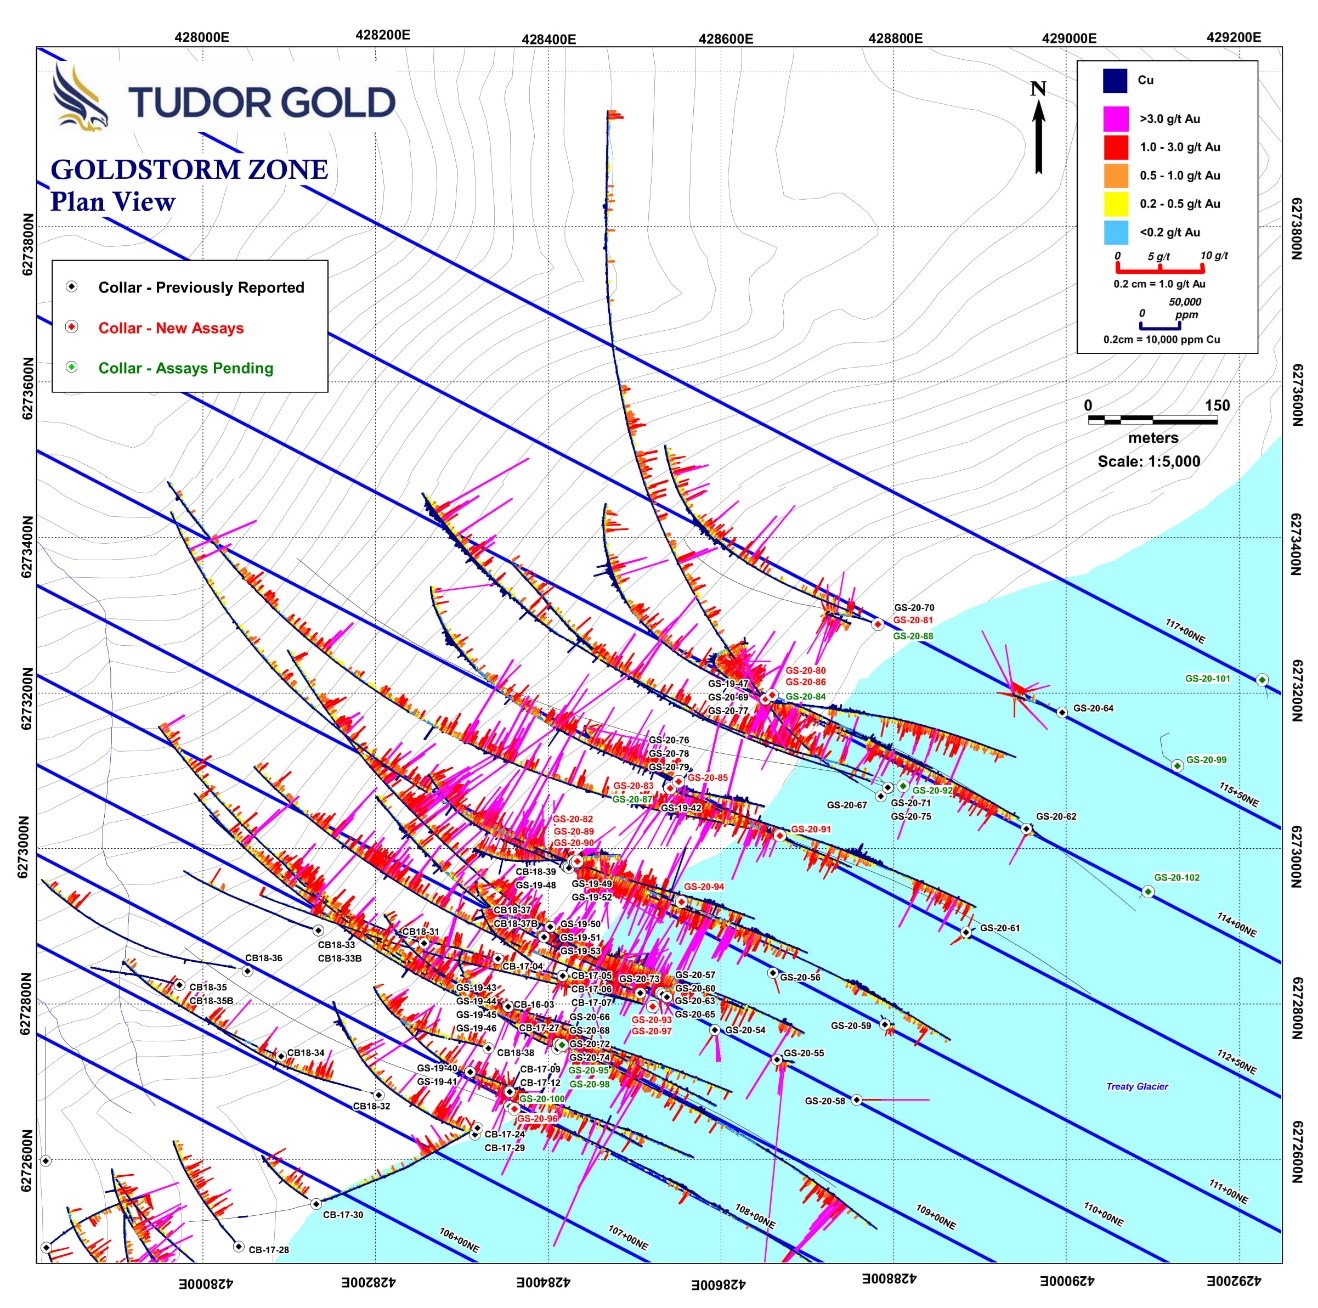
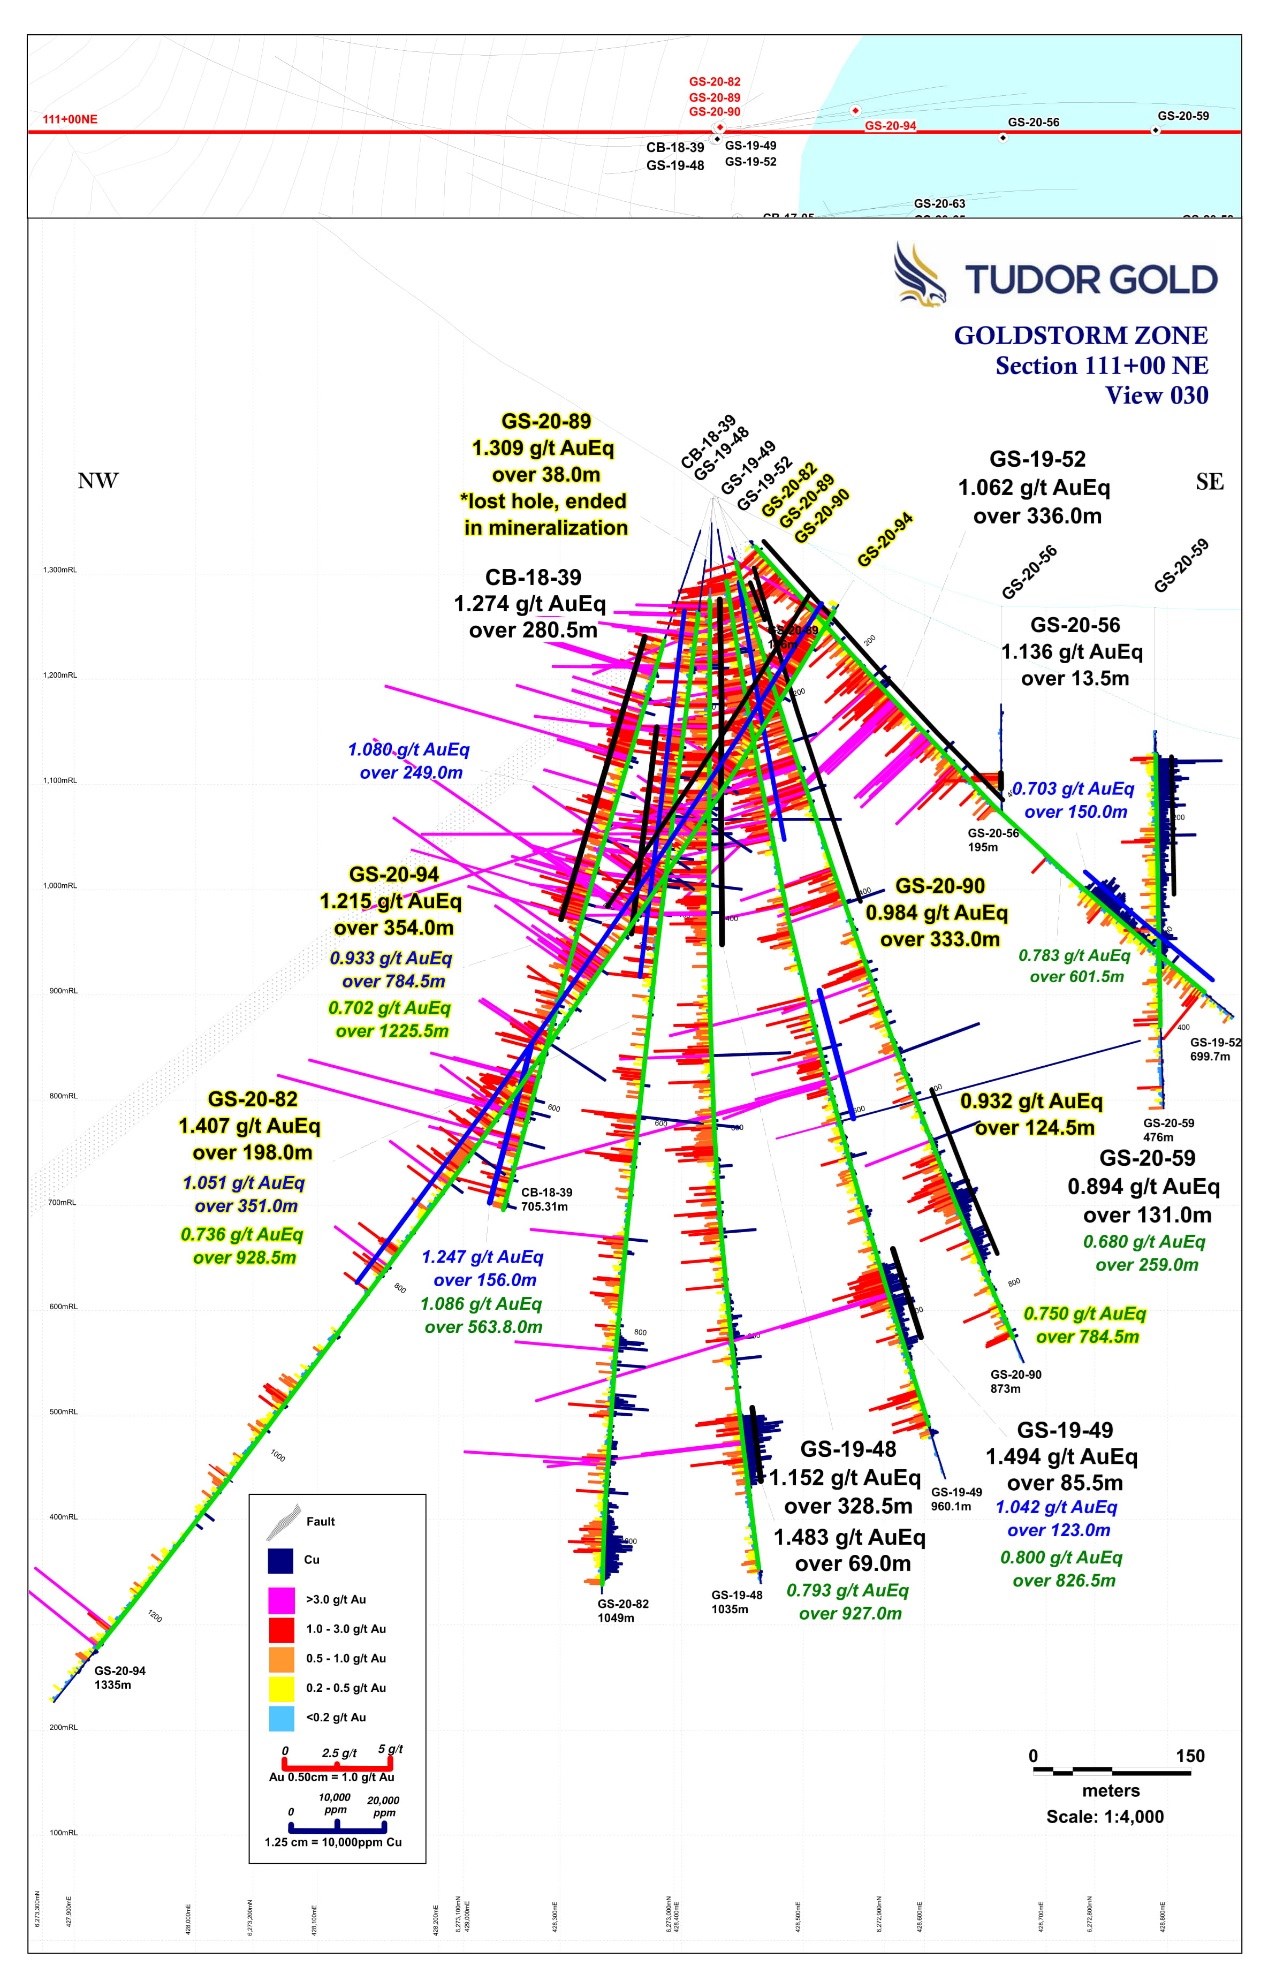
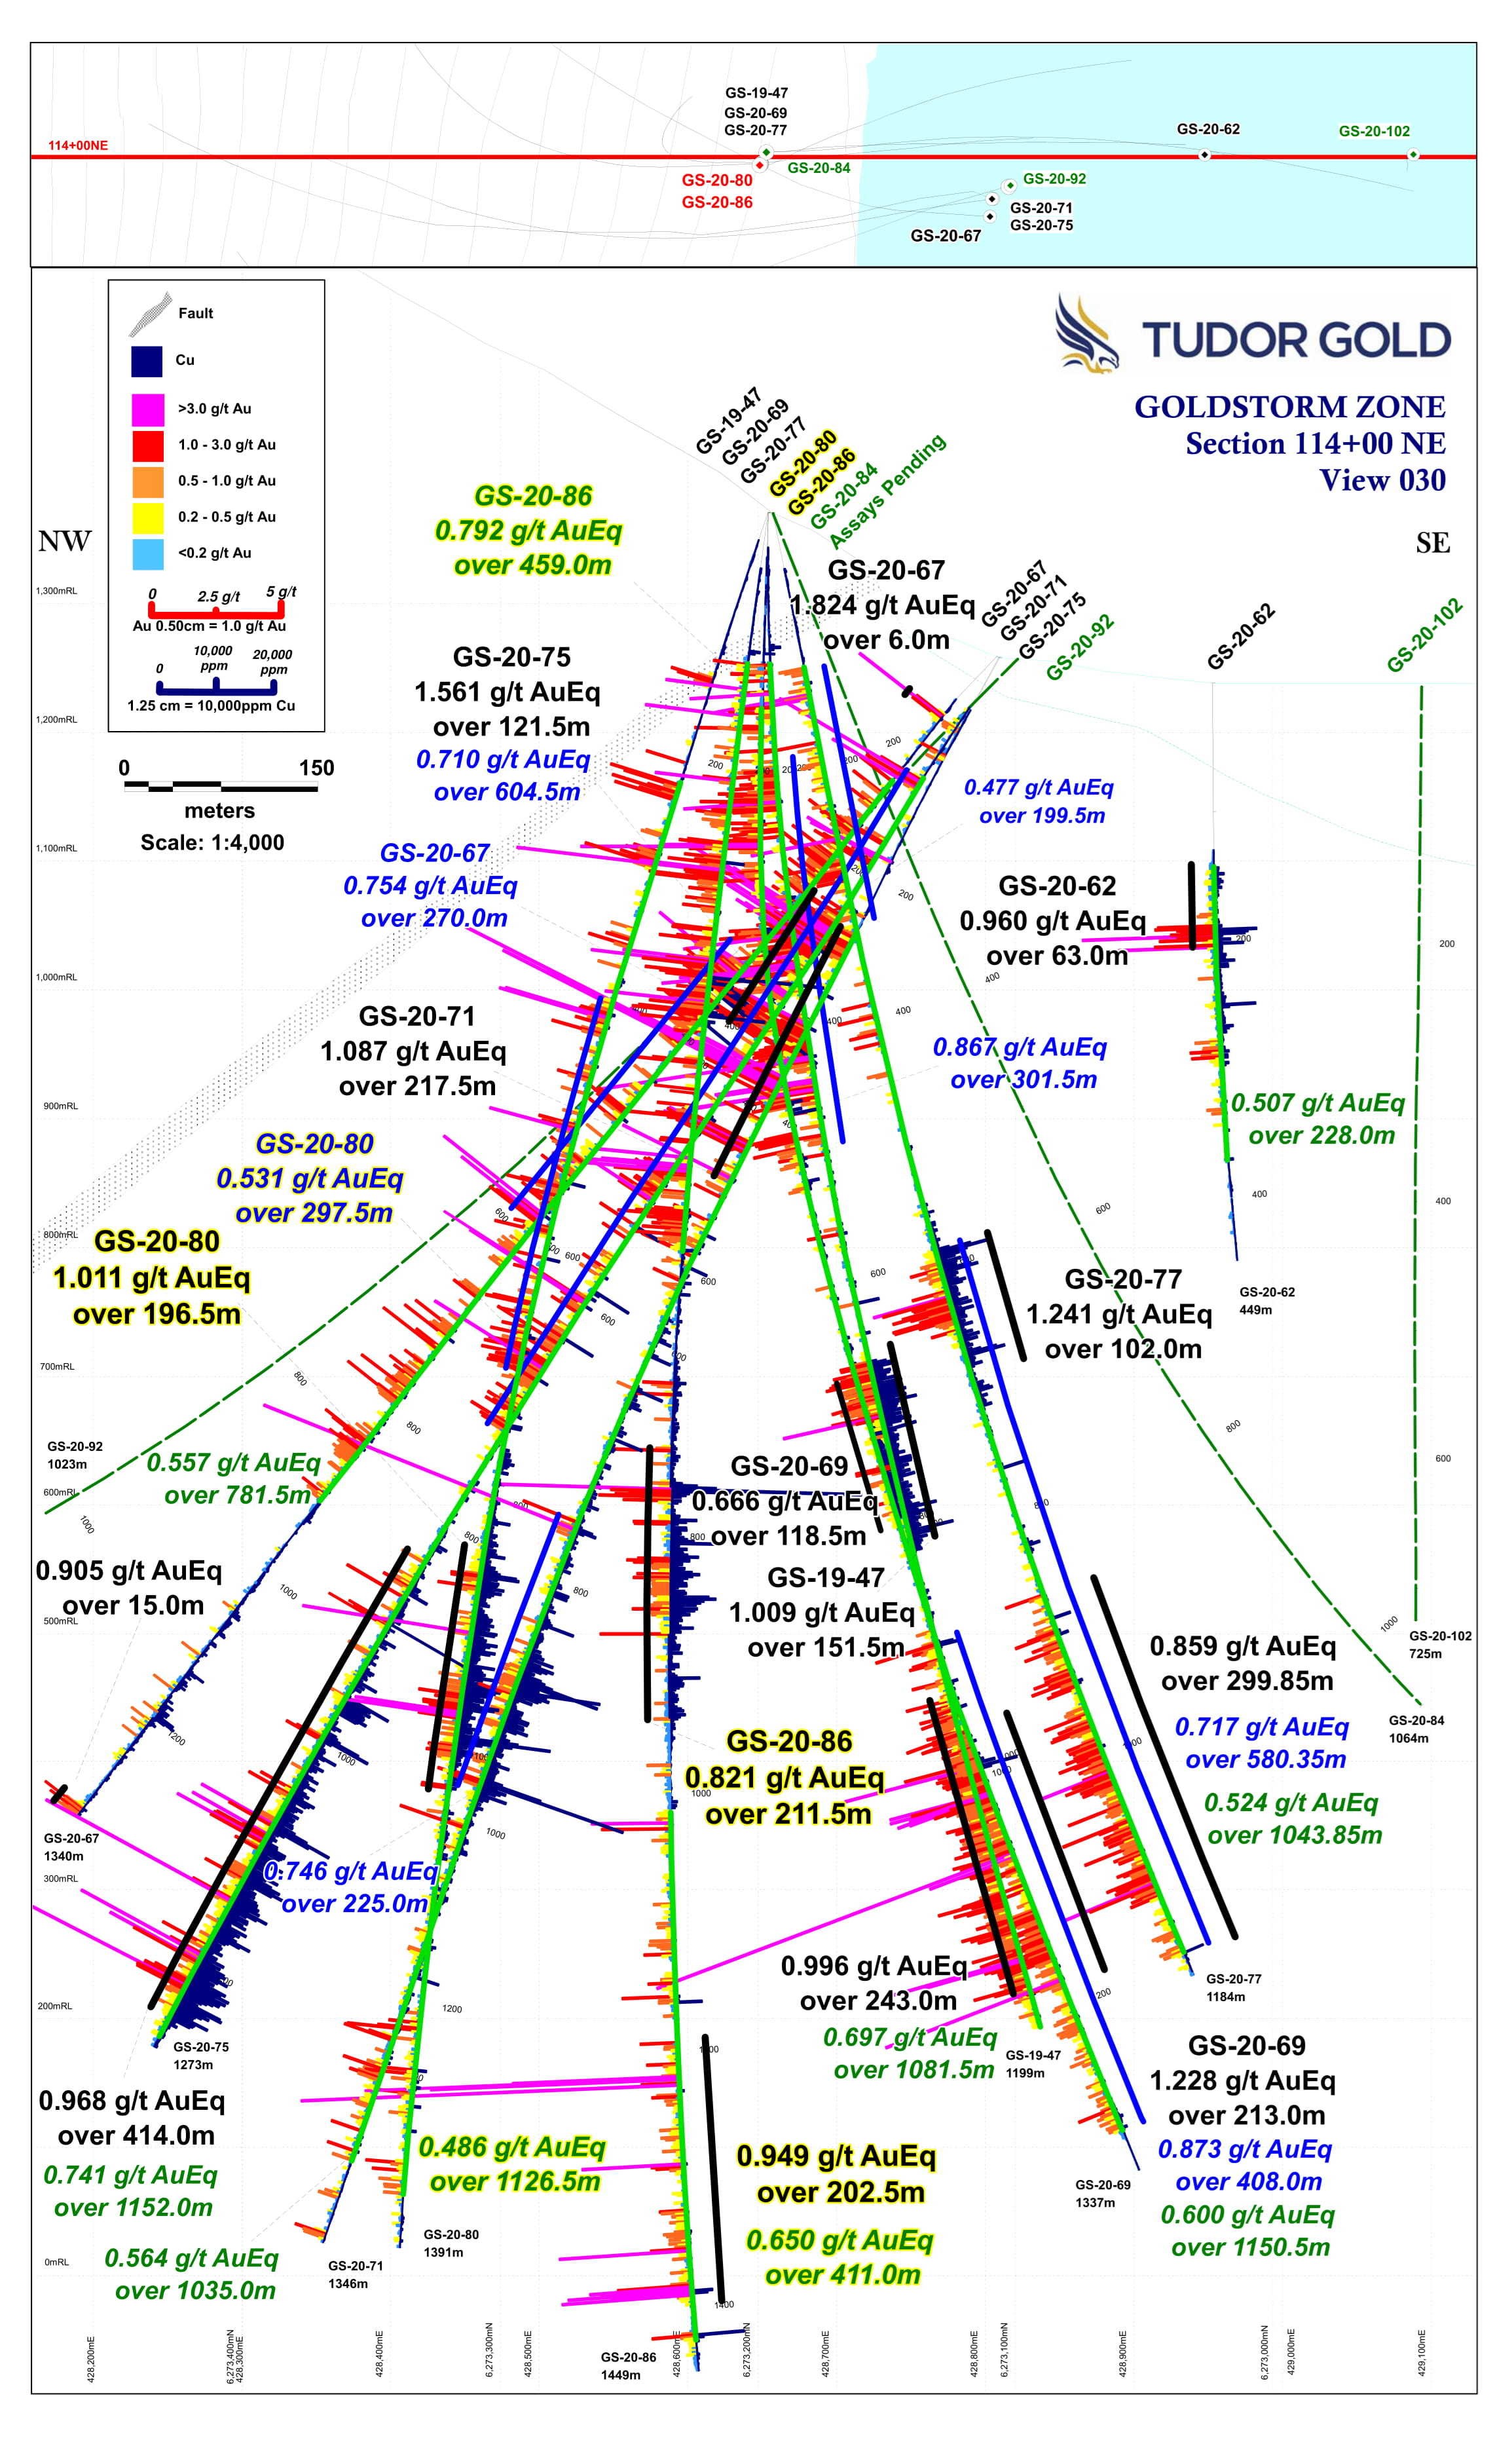
.jpg)