
Montreal, Quebec–(Newsfile Corp. – September 30, 2020) – Beauce Gold Fields (Champs D’Or en Beauce) (TSXV: BGF), (“BGF”), is pleased to announce that the Company has paid in full the principal and interest on a mortgage for 176 acres of real estate and bought back a 1.5% Net Smelter Royalty (NSR) held over the historical placer gold deposit in the municipality of Saint-Simon-les-Mines in the Beauce region of Quebec.
Patrick Levasseur, President and CEO of Beauce Gold Fields said, “The reimbursement of the mortgage represents a significant savings to shareholders. Moreover, with respect to the NSR, our predecessor company (Uragold) was granted certificates of authorization in 2013 for trial mining a section of the placer gold channel. In the event of a potential mining operation, the NSR we purchased will represent another significant saving as well.”
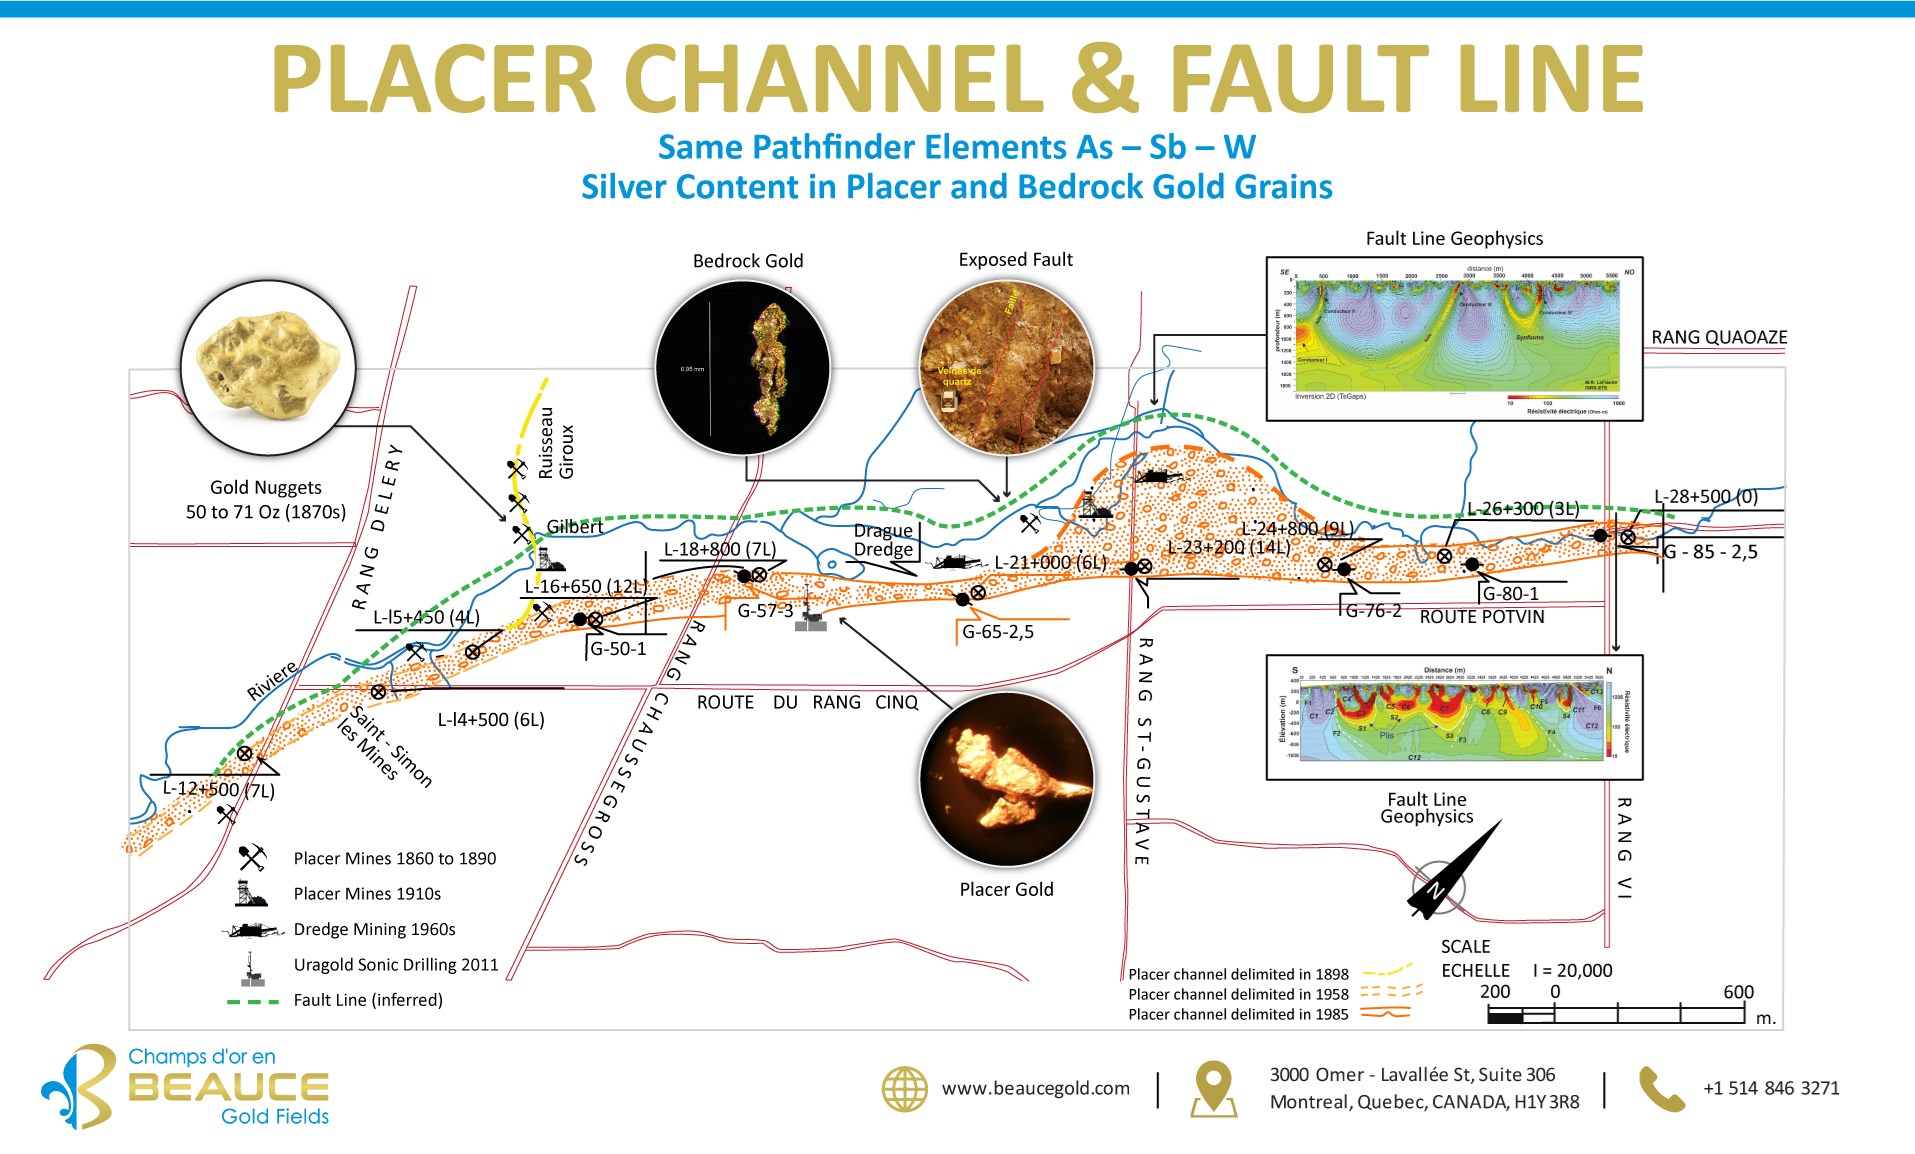
Placer Channel & Fault Line
To view an enhanced version of this graphic, please visit:
https://orders.newsfilecorp.com/files/6198/64966_b35c3b39c418fa68_001full.jpg
Reference to the historical placer gold deposit does not comply with the CIM reporting standards National Instrument 43-101 for mineral resources or reserves and should not be relied upon. While the Company considers historical estimates and the calculated Gold Exploration Target* for the entire historical placer channel to be relevant to investors as it may indicate the presence of mineralization, the Company is not treating these historical estimates as a current mineral resource.
During December 2018, the Company signed a real estate mortgage of $180,000, secured by the land with a net carrying amount of $204,346, bearing interest at compound rate of 18 % annually. On September 4, 2020, the Company reimbursed principal and interest.
The Company also had assumed the payment to a third party of a royalty of 1.5% of which, at the option of the company, 1% was redeemable for an amount of $1,000,000. The 1.5% royalty will be redeemed by the Company from the holder thereof by means of the issuance of 700,000 common shares of its capital stock representing the redemption price of $108,500. This transaction is subject to the TSX Venture Exchange approval
Modification To Stock Option Plan
Beauce Gold Fields Inc. announces that its Board of Directors has approved the modification of the total number of shares that may be issued pursuant to its stock option plan, increasing it by 1,480,000 shares from 1,900,000 shares to 3,380,000 shares and, as a result, the consolidation of its current stock options plan into the new 2020 stock options plan. The maximum number of common of shares that may be issued under the plan shall be equivalent to less than 10% of the issued and outstanding common shares of the Corporation. The modification is subject to regulatory approval and TSX Venture Exchange approval.
About Beauce Gold Fields
Beauce Gold Fields is a gold exploration company focused on placer to hard rock exploration in the Beauce region of Southern Quebec. The Company’s flagship property is the St-Simon-les-Mines Gold project site of Canada’s first gold rush that pre-dates the Yukon Klondike. The Beauce region hosted some of the largest historical placer gold mines in Eastern North America that were active from 1860s to the 1960s. It produced the largest gold nuggets in Canadian mining history (50oz to 71oz).
Comprising 152 contiguous claims and 7 real estate lots, the project area contains a six kilometer long placer channel consisting of an unconsolidated gold-bearing auriferous units of a lower saprolite and an upper brown diamictite. The Company has calculated a Gold Exploration Target for the entire historical placer channel ranges between 61,000 ounces (2,200,000 m3 @ 0.87g Au/m3) and 366,000 ounces* (2,200,000 m3 @ 5.22 g Au/m3).
*Source: Beauce July 4th 2018[43-101 Report.
The Company has identified a major Fault Line that coincides with an interpreted fault structure across the property. Evidence suggests the erosion of the Fault Line as a probable source of the historical placer gold channel.
Beauce Gold Fields website www.beaucegold.com


