
- Advises shareholders that it has received confirmation from the TSX Venture Exchange that effective at the opening on Monday, February 4, 2019,
- the common shares of Beauce Gold Fields Inc. will commence trading on TSX Venture Exchange under the symbol BGF.
MONTREAL, Feb. 01, 2019 — HPQ Silicon Resources Inc. (HPQ) (TSX VENTURE:HPQ)(FRANKFURT:UGE)(OTC PINK:URAGF) is pleased to advise shareholders that it has received confirmation from the TSX Venture Exchange that effective at the opening on Monday, February 4, 2019, the common shares of Beauce Gold Fields Inc. (the “Company†or “BGFâ€) will commence trading on TSX Venture Exchange (the “Exchangeâ€) under the symbol BGF.
BGF was incorporated under the Canada Business Corporation Act on August 1, 2016, primarily for the purpose of carrying out a spinout by way of a plan of arrangement (the “Arrangementâ€) with HPQ Silicon Resources Inc. (TSXV: HPQ) (“HPQâ€), of which the certificate of arrangement was issued on November 23, 2018.
Pursuant to the Arrangement, HPQ completed the disposition of its gold assets (the “Transferred Assetsâ€) to BGFI in consideration of the issuance of an aggregate of 13,350,000 BGFI common shares (the “BGFI Sharesâ€), of which 10,680,000 BGFI Shares were distributed to the shareholders of HPQ. HPQ distribution notice was accepted pursuant to the Exchange bulletin dated December 18, 2018.
On the day of listing, HPQ will own 2,870,133 shares of BGF, or 15.3% of the outstanding float of BGF.
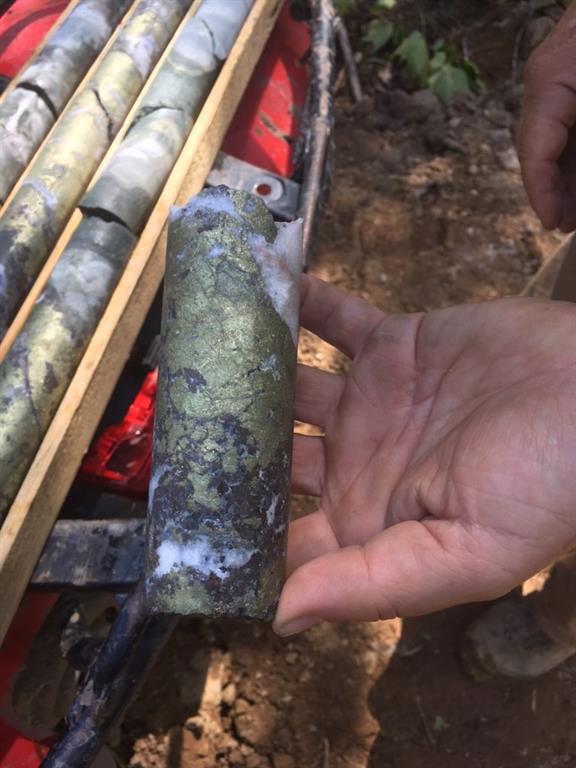
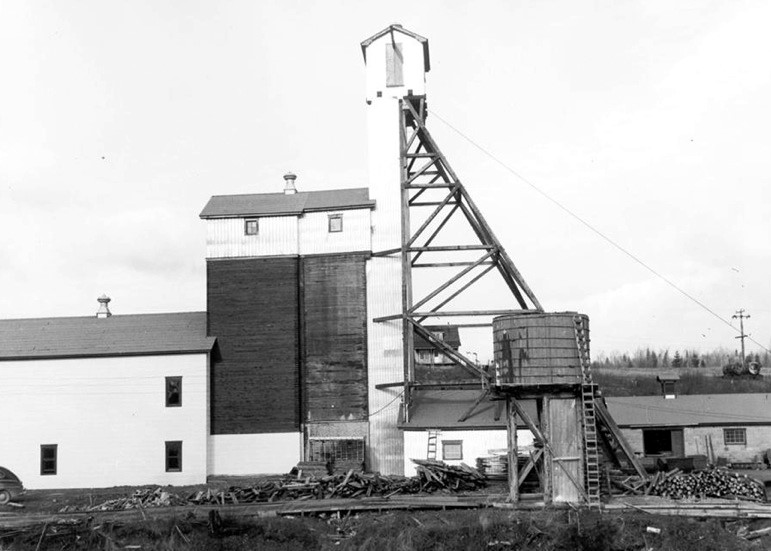
Mr. Bernard Tourillon, President and CEO of HPQ Silicon Resources Inc stated, “The listing of Beauce Gold Fields on the TSX Venture Exchange is the final step in HPQ plan of arrangement spin out, and we are now happy to have completed this milestone that provided HPQ shareholders shares in BGF, a Company created to showcase the Beauce Gold project, a fantastic but overlooked historical placer gold district. The Beauce is Canada’s last underexplored historical placer mining camp. It’s similar to the White Gold projects in the Yukon or the Cariboo district in B.C., that were both placer gold mining camps as well, but recently had major gold discoveries as placer to hard rock exploration projects.â€
For further information, please refer to the news releases of HPQ-Silicon dated March 11, 2016, May 4, 2016, Sept. 7, 2016, Sept. 16, 2016, March 31, 2017, Feb. 8, 2018, June 13, 2018, Aug. 17, 2018, Oct. 4, 2018, Oct. 11, 2018, Dec. 12, 2018, Dec. 17, 2018, and Dec. 18, 2018.
This News Release is available on the company’s CEO Verified Discussion Forum, a moderated social media platform that enables civilized discussion and Q&A between Management and Shareholders.
About HPQ Silicon
HPQ Silicon Resources Inc. is a TSX-V listed resource company focuses on becoming a vertically integrated and diversified High Purity, Solar Grade Silicon Metal (SoG Si) producer and a manufacturer of multi and monocrystalline solar cells of the P and N types, required for production of high performance photovoltaic conversion.
HPQ’s goal is to develop, in collaboration with industry leaders, PyroGenesis (TSX-V: PYR) and Apollon Solar, that are experts in their fields of interest, the innovative PUREVAPTM “Quartz Reduction Reactors (QRR)â€, a truly 2.0 Carbothermic process (patent pending), which will permit the transformation and purification of quartz (SiO2) into high purity silicon metal (Si) in one step and reduce by a factor of at least two-thirds (2/3) the costs associated with the transformation of quartz (SiO2) into SoG Si. The pilot plant equipment that will validate the commercial potential of the process is on schedule to start mid-2019.
Disclaimers:
This press release contains certain forward-looking statements, including, without limitation, statements containing the words “may”, “plan”, “will”, “estimate”, “continue”, “anticipate”, “intend”, “expect”, “in the process” and other similar expressions which constitute “forward-looking information” within the meaning of applicable securities laws. Forward-looking statements reflect the Company’s current expectation and assumptions, and are subject to a number of risks and uncertainties that could cause actual results to differ materially from those anticipated. These forward-looking statements involve risks and uncertainties including, but not limited to, our expectations regarding the acceptance of our products by the market, our strategy to develop new products and enhance the capabilities of existing products, our strategy with respect to research and development, the impact of competitive products and pricing, new product development, and uncertainties related to the regulatory approval process. Such statements reflect the current views of the Company with respect to future events and are subject to certain risks and uncertainties and other risks detailed from time-to-time in the Company’s on-going filings with the securities regulatory authorities, which filings can be found at www.sedar.com. Actual results, events, and performance may differ materially. Readers are cautioned not to place undue reliance on these forward-looking statements. The Company undertakes no obligation to publicly update or revise any forward-looking statements either as a result of new information, future events or otherwise, except as required by applicable securities laws.
Neither the TSX Venture Exchange nor its Regulation Services Provider (as that term is defined in the policies of the TSX Venture Exchange) accepts responsibility for the adequacy or accuracy of this release.
For further information, contact
Bernard J. Tourillon, Chairman and CEO Tel (514) 907-1011
Patrick Levasseur, President and COO Tel: (514) 262-9239
www.HPQSilicon.com
Shares outstanding: 222,284,053


