Posted by AGORACOM-JC
at 4:00 PM on Friday, January 22nd, 2021
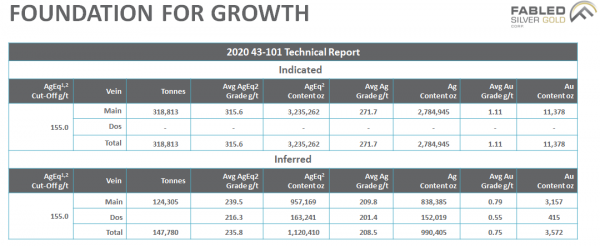
Fabled Silver Gold controls 100% of the Santa Maria Gold and Silver property in Mexico. It is a high grade underground mine with a rich mining history and a Silver Equivalent 43-101 with 3.2million ounces Indicated and 1.1m inferred.
Now as far as silver projects go 3.2M ounces isn’t very big but when serial mine finder and industry stalwart Peter Hawley was presented with it in 2016, he came out of retirement saying “it was almost too good to be true” and “this is the one I’ve been looking for.
Santa Maria’s best historical intercept to date, reported 11meters of 1,672 g/t Silver & 3.74 g/t gold and ending in mineralization. Moreover, a 2018 PEA is very supportive at current market prices.
Santa Maria has never been systematically, or explored thoroughly with modern methods, until now. FCO is currently conducting their first drill program to support the 43-101 and expects results to start flowing right into June.
It is definitely in a great “neighbourhood” in the mining friendly jurisdiction of Parral which has produced over 250M oz silver. Moreover, multiple major operators in the vicinity, including three toll mills within a 20 km distance.
Watch this great first of many anticipated interviews with CEO Peter Hawley.
Posted by AGORACOM
at 7:42 AM on Wednesday, January 6th, 2021
Fabled Silver Gold Corp. (TSXV: FCO) (FSE: 7NQ) (“Fabled” or the “Company“) is pleased to announce the completion of the first ever follow up ground sampling program to evaluate the IP geophysical anomalies on the Santa Maria Property in Parral, Mexico. Fabled is also pleased to provide an update on progress made on its initial 8,000 meter drill program.
Peter J. Hawley, CEO and President, remarks, “The results of the follow up sampling of the IP anomalies have provided favorable silver results over all on anomalies sampled, of which certain results were a pleasant confirmation of not only the location of the IP anomaly but also exhibiting silver grades on surface even though the anomaly is at depth. It is not common to sample almost one ounce of silver over a buried IP Anomaly.”
Of particular interest are two areas to the west and outside the new resource area. The first is anomaly IPSM-10 at the western sector of the property, where sample #816013 reported 29.8 g/t Ag. The anomaly is thought to represent the intersection of the northeast trending Peneto Vein located to the south west of the property and the intersection of the Santa Maria vein structures. Geophysical interpretation suggests it represents a shallow, thin body (“vein type”) response.
The second is located between IPSM-10 and the new resource trend and identified by IP anomaly IPSM-12 and sample #816007 which reported 14.2 g/t Ag and is thought to be the contact between the Santa Maria Vein trends and a felsic mineralized dike contact. Geophysical interpretation suggests a deep seated (>100 m) vein type response.
A total of 11 first priority IP targets have been delineated property wide (see Figure 1 below), which are in a generalized east – west direction. The geological team collected a total of 26 surface samples over all anomalies and nearby areas.
Figure 1: IP Anomalies on the Santa Maria Property with surface sample assay values and locations.
Drilling Update
The Company has completed two drill holes SM20-01 – 02 for a total of 396 metres. Holes 01 and 02 have been sampled and submitted to ALS Chihuahua Laboratory for analysis. Hole SM 20-03 is in progress. The focus of the program is to determine the true potential of the property, which is expected to take several months to complete.
Option Grants
Fabled also is pleased to announce that pursuant to its stock option plan it has granted 200,000 stock options to a consultant for the Company, each exercisable to acquire one common share of Fabled at an exercise price of $0.10 per common share until January 06, 2031. The stock options vest as to 25% on the date of grant, and as to 25% every 6 months until fully vested.
QA QC Procedure
Analytical results of sampling reported by Fabled Silver Gold represent surface rock samples submitted by Fabled Silver Gold staff directly to ALS Chemex, Chihuahua, Chihuahua, Mexico. Samples were crushed, split, and pulverized as per ALS Chemex method PREP-31, then analyzed for ME-ICP61 33 element package by four acid digestion with ICP-AES Finish. ME-GRA21 method for Au and Ag by fire assay and gravimetric finish, 30g nominal sample weight.
Over Limit Methods
For samples triggering precious metal over-limit thresholds of 10g/t Au or 200g/t Ag, the following is being used:
Au-GRA21 Au by fire assay and gravimetric finish with 30g sample.
Ag-GRA21 Ag by fire assay and gravimetric finish.
Fabled Silver Gold monitors QA/QC using commercially sourced standards and locally sourced blank materials inserted within the sample sequence at regular intervals.
About Fabled Silver Gold Corp.
Fabled is focused on acquiring, exploring and operating properties that yield near-term metal production. The Company has an experienced management team with multiple years of involvement in mining and exploration in Mexico. The Company’s mandate is to focus on acquiring precious metal properties in Mexico with blue-sky exploration potential.
The Company has entered into an agreement with Golden Minerals Company to acquire the Santa Maria project, a high-grade silver-gold property situated in the center of the Mexican epithermal silver-gold belt. The belt has been recognized as a significant metallogenic province, which has reportedly produced more silver than any other equivalent area in the world.
For further information please contact:
Mr. Peter J. Hawley, President and C.E.O. Fabled Silver Gold Corp. Phone: (819) 316-0919 [email protected]
Tags: Discovery, Drilling, Epithermal, gold, Mexico, silver, tsx Posted in All Recent Posts, Fabled Silver Gold | Comments Off on Fabled Silver Gold $FCO.ca Announces Surface Sampling Over IP Anomalies Results In Three Areas of Highly Anomalous Silver Values and Update on Current Drilling $GGD.ca $EDR.ca $RDU.ca $KTN.ca
Posted by AGORACOM
at 1:16 PM on Wednesday, December 30th, 2020
SPONSOR: Fabled’s mandate is on acquiring precious metals properties in Mexico with blue-sky exploration potential. Fabled is actively developing the Santa Maria property, a high-grade silver-gold property situated in the center of the Mexican epithermal silver-gold belt. The Santa Maria property has never been systematically explored. Click Here For More Info
The End Game
Dear Investors:
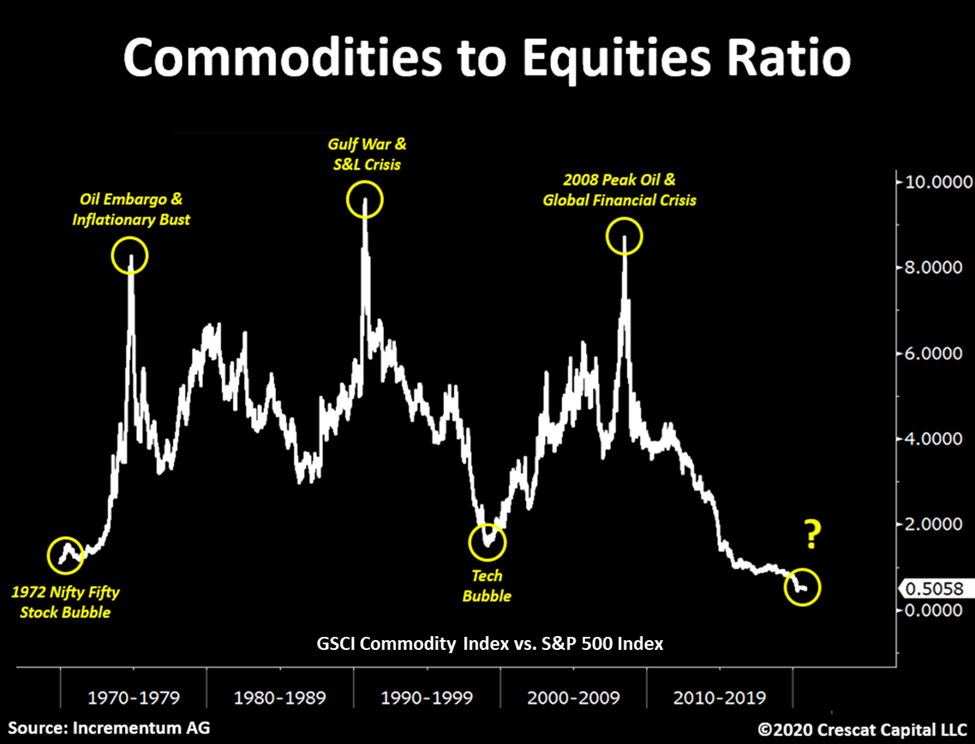
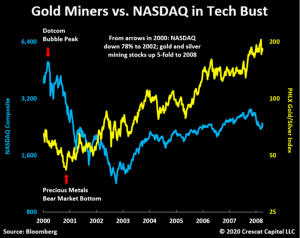
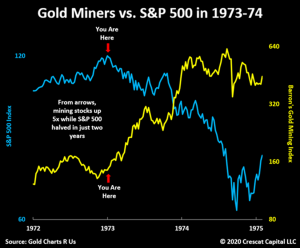
Markets are cyclical. Today, stocks trade at record high valuations while commodities are historically undervalued in relation. The setup is in place for a macro pivot in the relative performance of these two asset classes. Comparable conditions were present with the 1972 Nifty Fifty and 2000 Dotcom bubbles as we show in the chart below.
As capital seeks to redeploy towards the highest growth and lowest valuation opportunities, we expect analytically minded investors will soon be rotating, if not stampeding, out of expensive deflation-era growth equities and fixed income securities and into cheap hard assets, creating a reversal in the 30-year declining trend of money velocity.
Today’s Modern Monetary Theory world with its double barreled fiscal and monetary stimulus is crashing head on with an accumulation of years of declining investment in the basic industries such as materials, energy, and agriculture. In our analysis, the “end game” for the Fed’s twin asset bubbles in stocks and bonds is inflation. We can already see it developing on the commodity front.
The scarcity of jobs and abundance of debt were factors preventing the economy from reaching its full growth potential even before Covid-19. Such have been the concepts underlying the output gap, the theoretical paradox that is thought to have held inflation in check over the course of the last business cycle. But based on comparable historic periods, the macro setup for inflation is more likely to be kicked off by an input gap, i.e., shortages in the primary resources needed for both a strong reserve currency and economic growth at the same time as policy makers pull out their biggest bazookas yet to boost aggregate demand. We expect a new wave of rising commodity prices, set up by past underinvestment in basic resources, to soon ripple through the global supply chain creating a headwind for real living standards. Welcome to the Great Reset.
The global economy is at risk of commodity supply shock inflation, something we have not experienced since the 1970s. Both the Bloomberg Commodities Index and the US 30-year inflation expectations are now re-testing a 12-year resistance line. A significant breakout from here would be a big shift in the macro investing landscape. Yes, the aging demographics problem and significant technological advancements are deflationary tailwinds. But in our view, the key reason why consumer prices have not gone higher is due to a long-standing period of depressed commodity prices, a trend which we think is about to change.
The Constrained Supply for Gold
When it comes to scarce commodities, at Crescat, we have an affinity first and foremost for gold and silver, the monetary metals that are among the most supply constrained resources on the planet. Coincidentally, they are facing a new surge of investor demand.
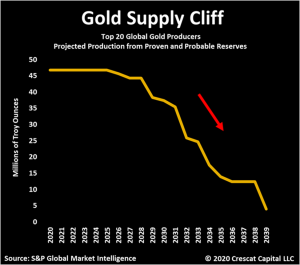
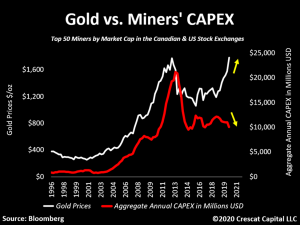
On the supply side, in the disinflationary environment since the precious metals mining industry’s prior peak in 2011, gold and silver miners have been criticized by investors as being capital destroyers. As a result, the industry’s spending discipline in the last decade has swung completely the other way. The majors have underinvested in replacing their reserves creating a supply cliff for the industry while also substantially boosting free cash flow.
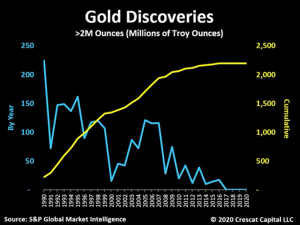
Contributing to the supply shortage, the number of major new gold discoveries by year, i.e., greater than 2 million Troy ounces, has been in a declining secular trend for 30 years including the cyclical boost between 2000 and 2007. At Crescat, we have been building an activist portfolio of gold and silver mining exploration companies that we believe will kick off a new cyclical surge in discoveries over the next several years from today’s depressed levels.
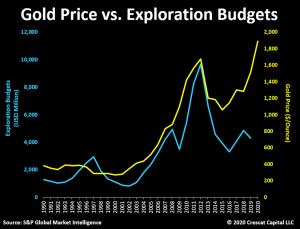
Gold mining exploration expense industrywide, down sharply since 2012, has been one of the issues adding to the supply problems today. Crescat is providing capital to the industry to help reverse this trend.
Since 2012, there has also been a declining trend of capital expenditures toward developing new mines. From a macro standpoint, gold prices are likely to be supported by this lack of past investment until these trends are dramatically reversed over the next several years. Credit availability for gold and silver mining companies completely dried up over the last decade. Companies were forced to buckle up and apply strict capital controls to financially survive during that period. Investors demanded significant reductions in debt and equity issuances while miners had to effectively tighten up operational costs, cut back investment, and prioritize the quality of their balance sheet assets.
It is important to consider that the last times this industry had been acting in a similarly conservative fashion, metal prices were at historically low-price levels. This time, however, we are seeing corporate discipline with gold prices remaining near all-time highs. As a result, the major producers today have surprisingly swung into being cash flow machines. They are enjoying more free cash flow than they had in the past 25 years, an incredibly bullish setup for the entire industry, especially the smaller exploration focused players that Crescat is overweight in today. The majors are in a great position to harvest cash for the next few years. But they are also facing a supply cliff because they have not replaced their reserves. Over the next several years, they will need to make acquisitions in the exploration segment to rebuild them.
The Demand Side for Gold
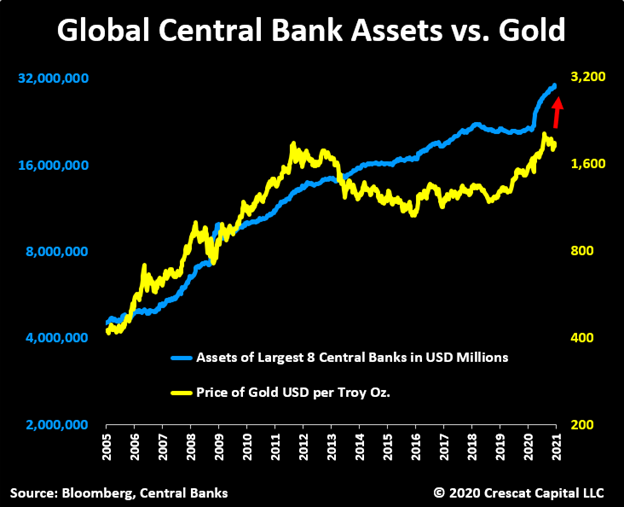
On the demand side, the first key macro driver for the price of gold is central bank debt monetization, which drives increasing inflation expectations and investor demand for inflation protection for accumulated savings. Today, money printing through central bank balance sheet expansion is widely accepted and embraced. It is the only viable policy as a way out of the otherwise deflationary global debt burden, at a historic high of 365% of worldwide GDP. With deficits at World War II levels in the US, we expect money printing to be the path of least resistance among policy makers towards easing debt burdens and reconciling many of today’s economic imbalances, though it will likely come at a cost to savers who are invested in overvalued traditional financial assets.
As we show in the chart below, gold underperformed the pace of global money printing from 2011 to 2018. But since the Repo Crisis in 2019 and the coronavirus led recession that followed, global QE has been accelerating to the upside once again. Gold is being pulled up with it. Our near-term target price for gold is north of $3,000 per Troy oz. based on our macro model shown below that plots the price of gold vs. the aggregation of the top eight central bank balance sheets. This target will almost certainly be rising in the near-term with $5.8 trillion just in US Treasuries alone maturing in 2021 and much of that needing to be rolled over and funded by the lender of last resort.
The Fed, the printer of the world reserve currency, has given itself, and by extension its central bank counterparts around the world, the green light to err on the side of inflation. The US central bank has declared that it can exceed its 2% inflation target temporarily abandoning one side of its dual mandate to favor the other side of it which is full employment. So, err on the side of inflation, the Fed almost certainly will.
Inflation is a toothpaste that sovereign Treasuries and their central banks throughout history have struggled putting back in the tube once they have let it out. In practice, inflation is driven in large part by the expectations and actions of consumers and investors which are hard to predict and occur with lags and unknown multiplier effects in relation to monetary policies. When consumer and investor psychology shifts toward recognizing and acting upon rising inflation, it becomes highly reflexive, i.e., circular and self-reinforcing.
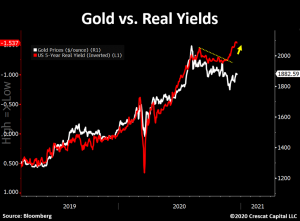
The second key macro driver for upward trending gold prices on the demand side today is declining real interest rates, which are a combined reflection of central bank interest rate suppression tactics and investors’ rising inflation expectations. The recent plunge lower in real yields (shown inverted in the chart below) has diverged from the price of gold signaling a strong impending move upward again in the metal.
The outlook for gold all ties back to the bigger macro imbalances we see in the US economy today. The Federal Reserve is crippled in its ability to prevent inflation and instead has become the funding mechanism through its massive purchases of US Treasuries that enables the US government to run a large fiscal deficit. The Fed essentially has no independence in the matter. It must fund the government’s fiscal stimulus programs as the lender of last resort. And as the repo crisis showed, the liquidity is also necessary in the short run to prevent the equity and corporate bond markets from collapsing, but this is very shortsighted because rising commodity prices and real-world inflation, that is the byproduct of the newly printed money, is the killer of record overvalued financial assets.
Three Comparable Macro Setups in History
We expect inflation expectations to continue to rise at a faster rate than nominal interest rates. This is ultimately a self-reinforcing catalyst to drive investors out of overvalued stocks and credit and into scarce commodities including precious metals and oil, which is exactly what happened in three similar macro setups to today:
1. During the dotcom bust at the turn of the century, the NASDAQ Composite declined 78% over two and a half years, a period during which gold stocks diverged to the upside to begin a five-fold march upward over the next seven years, while energy and industrial commodities also caught fire.
2. In the 1974-74 bear market, the S&P 500 declined 50% in two years while gold mining stocks increased five-fold at the same time as oil prices skyrocketed during the 1973 Arab Oil Embargo and a decade of stagflation was born.
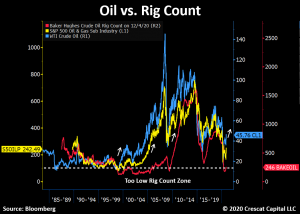
We showed the supply cliff setup for gold earlier, but it is important to note that there could also be a supply shortage in oil setting up for the next several years after the most drastic capex cuts in infrastructure and exploration we have seen in the history of this industry. In that vein, the rig count cyclicality has been an incredibly reliable contrarian forward looking indicator for oil prices. As shown in the chart, prior historical dips also preceded key market bottoms in WTI prices and the oil and gas industry.
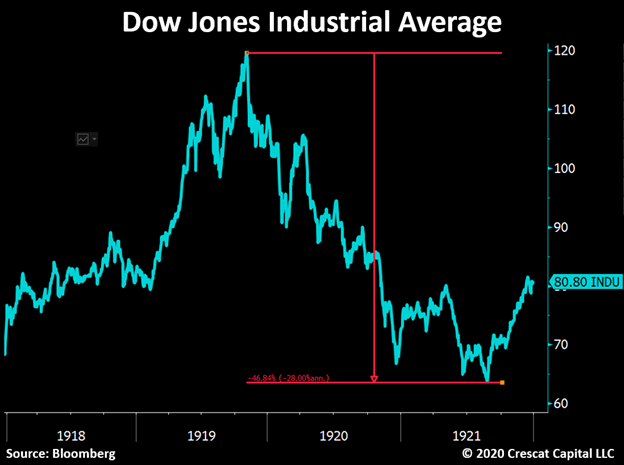
3. The third comparable period, also highly apt for today, was coming out of the Spanish flu pandemic of 1918 and 1919. At that time, the health crisis had severely limited the industrial capacity of the economy, leading to major supply shortages of raw materials and causing commodity inflation at the same time as the world began to heal. The rise in wholesale prices became a global phenomenon. Grocery stores began hoarding inventories to sell at higher prices, forcing governments to intervene and criminalize these actions to avoid an even larger hit to the consumer. The cost of living surged and prompted major labor union protests on the streets demanding higher wages and salaries only exacerbating the problem. Inflation spiked above 20% in 1920 and the Dow Jones Industrial Average began a decline of 47% from peak to trough from 1920 to 1921 while the world emerged from the pandemic. We will not go there in depth now, but this was the same time that a whole different kind of inflation was arising in Germany from newly printed money to pay off accumulated war debts.
The Opportunity for Activist Gold Exploration
As we showed above, the underinvestment in most of the last decade in the gold mining industry will soon send the majors scrambling to invest their near term soaring free cash flow in the most prospective new gold and silver deposits being explored today. These properties are in the hands of the extremely undervalued and ultra-depressed small cap segment of the mining industry, the junior explorers, a group that has been through a brutal, capital starved bear market that effectively lasted ten years. The whole industry completed a double-bottom retest by successfully holding above its 2015 lows and rebounding sharply to lead all industries in stock price performance coming off the March 2020 correction. We think there is much more performance ahead for this industry as it is still in the early stages of a new secular bull market.
We are confident that within the precious metals mining industry, the most value for shareholders will be created from the small cap exploration segment over the next several years. We think Crescat’s Precious Metals Fund and SMA strategies have already started to demonstrate that potential in 2020.
By working with world-renowned exploration geologist, Quinton Hennigh as Crescat’s geologic and technical advisor, Crescat has already created an activist portfolio of over 50 companies where we are among the largest shareholders of a targeted 200 million ounces new high-grade gold equivalent discoveries. We plan to continue to grow these targeted ounces while getting the needed investment capital to our companies to prove out these economic deposits through drilling and discovery.
Crescat’s activist fund is a large and significant capital deployment opportunity. We are currently seeking a select group of right-minded institutional partners who can understand and appreciate the focus, scale, and timeliness of what we have set out to accomplish in this fund.
Our activist portfolio is positioned ahead of a likely major new wave of M&A by the large and mid-tier producers which is still to come as they necessarily must replace their reserves through acquisition. We also have a handful of holdings that we call keepers, the cream of the crop companies that control the unquestionably new world class, high grade gold and silver deposits that will catapult them into the next great mid and large cap gold producers in the industry over the course of the new secular bull market.
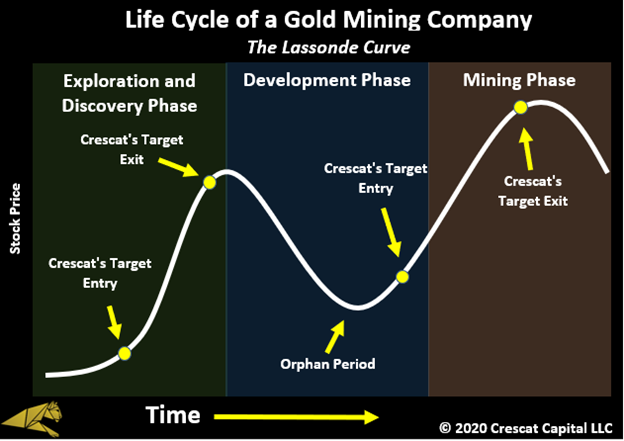
To be frank, buying gold or silver is not a contrarian investment position today. There are enough people in agreement with the idea that all government backed fiat currencies are doomed to some level of devaluation through inflation due to the level of fiscal and monetary imprudence and unsustainable debt imbalances in the financial system. Naturally, with a constructive view on precious metals, the next step for most investors is to start dipping their toes into well-known and established mining companies. Despite their past reputation of being capital destroyers, investors today are warming up to the idea of buying the “Newmonts and Barricks” of the world or even ETFs such as GDX and GDXJ. What we see as contrarian, however, is a much bigger opportunity to unlock value through a well targeted activist strategy in the exploration segment of the industry. No doubt, many are skeptical of the gold exploration business, given its poor performance during the last downturn in the industry at large, but the biggest gains today in the industry are likely to come from what are the smaller cap names. Between Crescat and its 21 years of money management experience and Quinton Hennigh with his 30+ years of gold mining exploration experience to serve as Crescat’s geologic and technical advisor, we believe we have the expertise and preparedness to navigate this incredible opportunity before us. We hope you will join us as we seek to exploit the mispriced opportunities on the exploration and discovery side of the Lassonde Curve that is still in the early stages of what is likely to be a new rip-roaring secular bull market for precious metals.
Posted by AGORACOM
at 7:32 AM on Friday, December 18th, 2020
Vancouver, British Columbia–(Newsfile Corp. – December 18, 2020) – Fabled Silver Gold Corp. (TSXV: FCO) (FSE: 7NQ) (“Fabled” or the “Company“) is pleased to announce the listing of its common shares for trading on the Frankfurt Stock Exchange (“FSE”) under the symbol “7NQ” and WKN # “A2QKYJ “.
The FSE is the world’s third largest organized exchange-trading market in terms of turnover and dealings in securities. With over 3,000 international companies listed on the FSE and investors directly connected to the FSE, the FSE represent 35% of the world’s investment capital.
The Company’s shares will now be cross-listed on the TSX Venture Exchange and the Frankfurt Stock Exchange. Fabled expects the FSE listing will help increase trading liquidity and facilitate investment in the Company by institutional and retail investors across Europe. This listing does not impact the total number of common shares outstanding in the Company.
Mr. Peter Hawley, President and CEO of Fabled, commented: “Fabled is committed to building shareholder value and the Frankfurt Stock Exchange listing will enable international investors to participate in the Company’s growth and development. We feel this is a great opportunity to introduce Fabled to a European investing audience at a time when Fabled is actively drilling at the Santa Maria project.”
Option Grants
Fabled also is pleased to announce that pursuant to its stock option plan it has granted an aggregate of 3,850,000 stock options to certain directors, officers and consultants, each exercisable to acquire one common share of Fabled at an exercise price of $0.08 per common share until December 18, 2030. The stock options vest as to 25% on the date of grant, and as to 25% every 6 months until fully vested.
About Fabled Silver Gold Corp.
Fabled is focused on acquiring, exploring and operating properties that yield near-term metal production. The company has an experienced management team with multiple years of involvement in mining and exploration in Mexico. The company’s mandate is to focus on acquiring precious metal properties in Mexico with blue-sky exploration potential.
The company has entered into an agreement with Golden Minerals Company to acquire the Santa Maria project, a high-grade silver-gold property situated in the centre of the Mexican epithermal silver-gold belt. The belt has been recognized as a significant metallogenic province, which has reportedly produced more silver than any other equivalent area in the world.
For further information please contact:
Mr. Peter J. Hawley, President and C.E.O. Fabled Silver Gold Corp. Phone: (819) 316-0919 [email protected]
Posted by AGORACOM
at 4:32 PM on Monday, December 14th, 2020
Fabled Silver Gold Corp. (TSXV: FCO)The Santa María Property is an under-explored, high-grade silver-gold project with significant exploration potential to expand mineral resources and identify new discoveries.
Fabled Silver Gold Company Highlights:
Commenced drilling on 100% option at Santa Maria Mine in Mexico
2020 NI 43-101 Resource of 3.2Moz Indicated and 1.1Moz Inferred in two primary veins
Two distinct Epithermal veins have been partially explored
Santa María Property is an under-explored, high-grade silver-gold project with significant exploration potential
19 significant vein structures exists within the property and provides future virgin exploration opportunities
Geophysical survey on the property and has successfully identified multiple targets for exploration and drilling
Santa Maria Deposit
High Grade silver-gold property located in mining friendly jurisdiction of Parrall, Mexico
The Parral mining district is situated in the center of the Mexican Silver belt, a district of epithermal silver gold mineralization
The belt has been recognized as producing more silver than any other equivalent are in the world
2018 PEA very supportive at current market prices
2 Mettalurgical Studies completed
Santa Maria vein structures provide many promising exploration and possibly future mining possibilities
The Santa Maria mine has never been systematically, or explored thoroughly with modern methods
The Asset: Santa Maria Mine 43-101
3.2Moz Indicated and 1.1Moz Inferred in two primary veins
High grade silver-gold property located in the mining friendly jurisdiction of Parrall, Chihuahua, Mexico.
The Parral mining district is situated in the centre of the Mexican silver belt epithermal silver-gold vein districts. The belt has been recognized as a significant metallogenic province, which has reportedly produced more silver than any other equivalent area in the world.
43-101 Technical Report completed on December 02, 2020 by Mineral Resources Engineering.
Significant vein structures within the property provides future exploration and mining opportunities.
Posted by AGORACOM
at 8:25 AM on Monday, December 14th, 2020
Vancouver, British Columbia–(Newsfile Corp. – December 14, 2020) – Fabled Silver Gold Corp. (TSXV: FCO) (“Fabled” or the “Company“) is pleased to announce the completion of the first ever ground geophysical survey on the Santa Maria Property, in Parral, Mexico and subsequent commencement of drilling. Fabled’s management team strongly believes that the Santa María Property is an under-explored, high-grade silver-gold project with significant exploration potential to expand mineral resources and identify new discoveries.
The first phase of drilling will consist of a minimum of 8,000 meters of HQ size core with a Versadrill 1.4 mount track. Drilling is expected to define the Santa Maria veining at depth and to the east and west using the IP anomalies as a target. This will be followed by pure exploration to test virgin IP targets to the north of the property, as identified by the recent survey. Fabled has awarded the surface diamond drill contract to Maza Diamond Drilling SA DE CV.
Peter J. Hawley, CEO and President remarks: “This is the first ever detailed geophysical survey on the property and has successfully identified multiple targets for exploration and drilling, which continues to support our theory of not only multi phases of mineralization but the relationship to structural controls. The results have been incorporated into surfacing mapping, sampling and underground and surface drilling resulting in a new theory of mineralizing events which should enhance our exploration success. Over four years past owners have only drilled approximately 9,600 meters and we are embarking on an initial 8,000-meter program to determine the true potential of the property, which is expected to take five months to complete.”
A video summary of today’s news release is available here.
Geophysical Interpretation and Survey Results
A 3-Dimensional Instantaneous Potential, (“IP”) survey covered the entire property at 50-meter line spacing and was 16 blocks in size with penetration to -500 meters minimum. The complete survey resulted in pseudo sections with 2D inversion for each line, a property plan map for chargeability and resistivity; and interpretative map with axis of anomalies and a Voxel 3-Dimensional model.
In addition, 27 kilometers of ground magnetics was completed over the property resulting in a final product consisting of a topographic plan map, total field, first derivative and reduced to the pole and 3D inversion magnetics.
A total of 11 first priority IP targets have been delineated property wide (see Figure 1 below), which are in a generalized east – west direction. Anomaly IPSM-1 located 400 meters to the east of the last surface expression of the Santa Maria Veins is defined as sub-cropping, (very shallow) and an extension of the Santa Maria veining. All other IP anomalies define new trends in the northern sector and range from shallow in depth to deep seated, +/- 100-150 meters in depth. The deeper anomalies are described as wide bodies in the areas where they intersect the secondary mineralized north – south veining. The geological team has collected 26 surface samples over all anomalies, and these have been submitted to ALS Chihuahua Laboratory for analysis.
Fabled’s reinterpretation of the age and mineralizing events and structures on the Santa Maria property finds that the Santa Maria and Santa Maria dos veins are hosted in a primary generalized east – west trending rhyolite zone and mineralization consists of silver and gold only. Younger Parral formation, post mineralization, sediments overlay the vein trends to the west, east, and in the north of the property.
These sediments have been structurally stressed / sheared in a generalized north – south trend as a result of the San Rafael graben northeast of the property, a major tectonic feature that has a regional effect of the placement of mineralization. These structures not only slightly offset the east – west trending Santa Maria Veins but wide zones of hydrothermal breccias are encountered where the intersection occurs. These north – south trending structures are interfiled with calc silicate veining which surface sampling has determined they not only contain silver – gold values but also lead, zinc, and copper. This has been interpreted to be a second mineralizing event.
Structure on structure creating dialization zones consisting of hydrothermal breccias have been reported in drill hole SM18-03 which reported 43.35 meters grading 0.78 g/t Au, 232.89 g/t Ag including a section reporting 3.35 g/t Au, 1,1012.63 silver over 8.94 meters.
About Fabled Silver Gold Corp.
Fabled is focused on acquiring, exploring and operating properties that yield near-term metal production. The company has an experienced management team with multiple years of involvement in mining and exploration in Mexico. The company’s mandate is to focus on acquiring precious metal properties in Mexico with blue-sky exploration potential.
The company has entered into an agreement with Golden Minerals Company to acquire the Santa Maria project, a high-grade silver-gold property situated in the centre of the Mexican epithermal silver-gold belt. The belt has been recognized as a significant metallogenic province, which has reportedly produced more silver than any other equivalent area in the world.
For further information please contact:
Mr. Peter J. Hawley, President and C.E.O. Fabled Silver Gold Corp. Phone: (819) 316-0919 [email protected]
Posted by AGORACOM
at 2:33 PM on Wednesday, November 27th, 2019
Kamloops,
British Columbia–(Newsfile Corp. – November 27, 2019) – Advance Gold
Corp. (TSXV: AAX) (“Advance Gold” or “the Company”) is pleased to
announce drilling has started to test the large chargeability anomaly
identified in recent 3D Induced Polarization (IP) geophysical surveys on
its Tabasquena project in Zacatecas, Mexico. Two phases of IP surveys
identified a 1000 metres by 500 metres continuous chargeability anomaly.
The anomaly remains open to the north and to the south and at depth.
Allan Barry Laboucan, President and CEO of Advance Gold Corp. commented: “We
are very excited to drill this large chargeability anomaly as these
kinds of targets are not easily found, especially in regions well known
for big mines. What makes it particularly stand out is that the high
chargeability is consistent from east to west on each survey line, and
from line to line over the entire grid. One always has to be aware of
possible false positives, such as the possibility of disseminated
magnetite causing the chargeability anomaly. However, in this case there
has been no magnetite found in the area and an historical magnetic
geophysical survey by the Geological Survey of Mexico showed no magnetic
anomaly. There are a few potential explanations for the anomaly of this
size from mines in Zacatecas. At the Real de Angeles mine and the mine
at Fresnillo there were large stockwork vein systems. Previous drilling
at Tabasquena has found a near surface network of epithermal veins with
widespread gold and silver mineralization, although the IP survey did
not pick up that network of drilled veins. Another possibility is a
porphyry intrusion that are known to be below epithermal vein systems.
Finally, volcanogenic massive sulphide deposits (VMS) are known to occur
in clusters, so far, there is only one found in the area, Teck’s San
Nicolas VMS deposit. The San Nicolas discovery was found with the first
drill hole into a large IP chargeability anomaly. For a small company
like Advance Gold to have such a significant anomaly, in a prolific
region for mines is exceptional, now we are drilling to better
understand what we have at the Tabasquena project.”
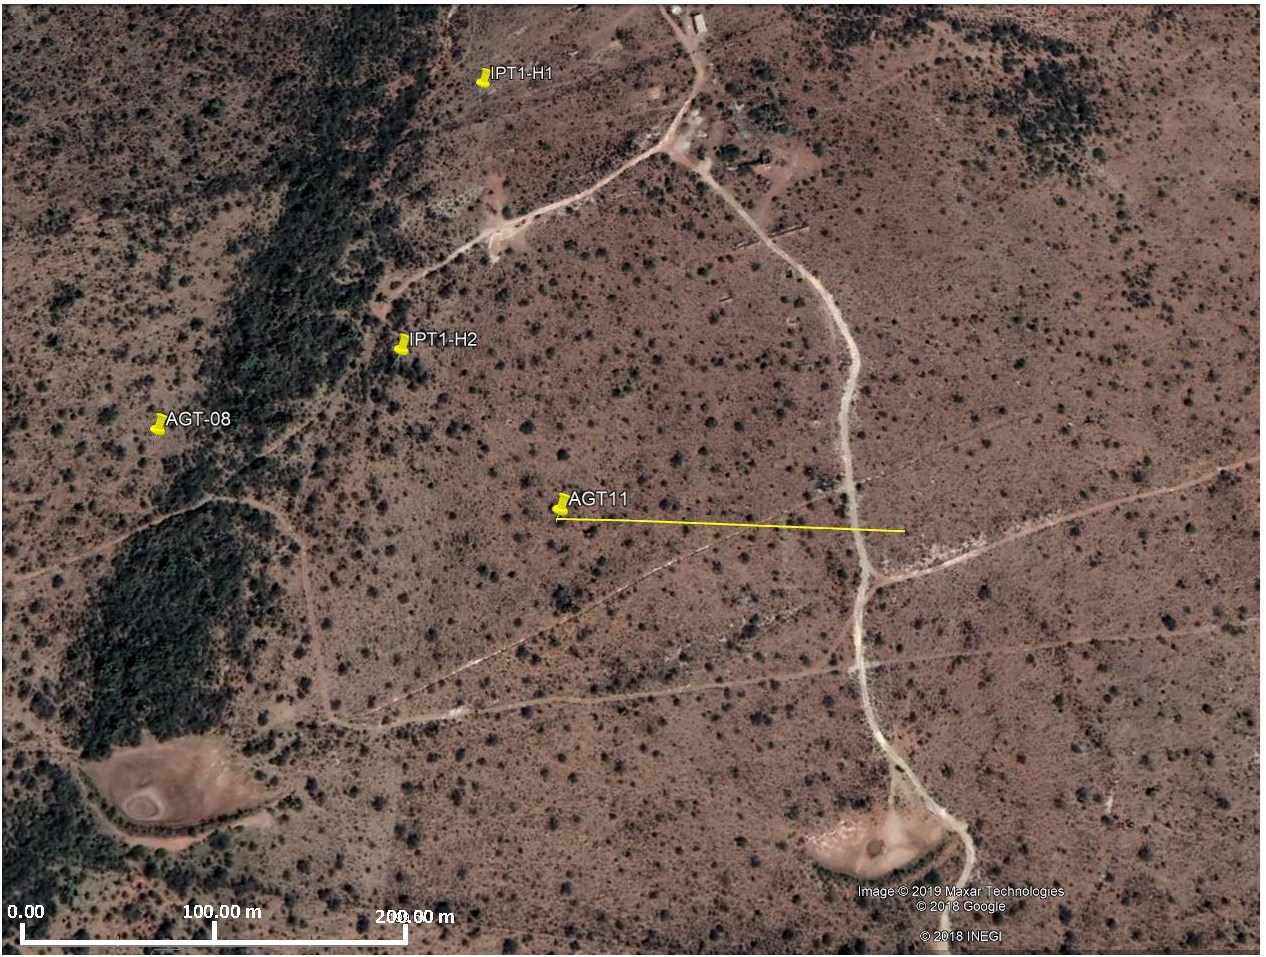
The
first drill hole to test the chargeability anomaly will be
approximately in the middle of the anomaly. It will be drilled at a 65
degree angle, from west to east. The first image below shows the collar
location and direction of the hole. In the north part of the image, you
can see the Tabasquena shaft area, where historical mining was done in
the oxide zone of the Tabasquena vein, and just off the image to the
south is the Tesorito shaft also used historically to mine the
Tabasquena vein in the oxides.
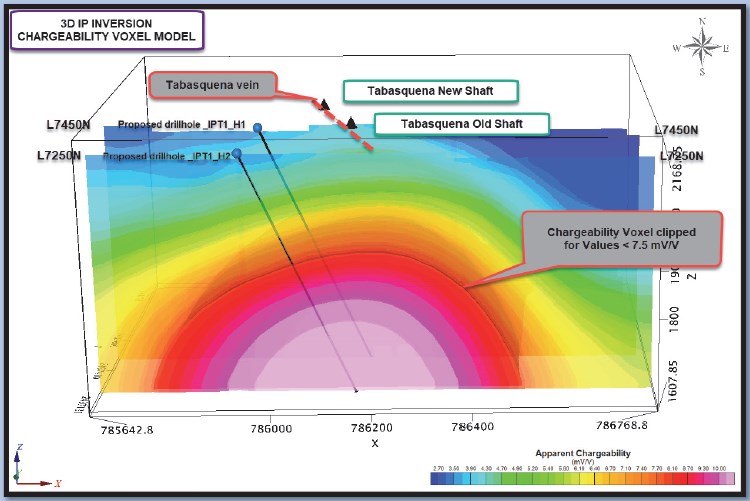
The
image below is a plan view, with past drill holes outside the purple
area which is the projected chargeability anomaly to surface. Those
drill holes intersected a series of veins, with widespread gold and
silver mineralization. None of the holes reached the chargeability
anomaly.
The
final image below, is a cross section of the new drill hole, which has
been designed to cover approximately 100 metres from west to east, plus
go down to 500 metres and hit the middle of the chargeability anomaly.
The anomaly remains open at depth beyond the planned 500 metres and a
decision will be made during drilling to extend it.
Julio
Pinto Linares is a QP, Doctor in Geological Sciences with specialty in
Economic Geology and Qualified Professional No. 01365 by MMSA., and QP
for Advance Gold and is the qualified person as defined by National
Instrument 43-101 and he has read and approved the accuracy of technical
information contained in this news release.
About Advance Gold Corp. (TSXV: AAX)
Advance
Gold is a TSX-V listed junior exploration company focused on acquiring
and exploring mineral properties containing precious metals. The Company
acquired a 100% interest in the Tabasquena Silver Mine in Zacatecas,
Mexico in 2017, and the Venaditas project, also in Zacatecas state, in
April, 2018.
The
Tabasquena project is located near the Milagros silver mine near the
city of Ojocaliente, Mexico. Benefits at Tabasquena include road access
to the claims, power to the claims, a 100-metre underground shaft and
underground workings, plus it is a fully permitted mine.
Venaditas
is well located adjacent to Teck’s San Nicolas mine, a VMS deposit, and
it is approximately 11km to the east of the Tabasquena project, along a
paved road.
In
addition, Advance Gold holds a 13.23% interest on strategic claims in
the Liranda Corridor in Kenya, East Africa. The remaining 86.77% of the
Kakamega project is held by Barrick Gold Corporation.
For further information, please contact:
Allan Barry Laboucan, President and CEO Phone: (604) 505-4753 Email: [email protected]Reply
Posted by AGORACOM
at 3:21 PM on Tuesday, November 26th, 2019
SPONSOR: Advance Gold AAX.v – Advance Gold controls 100% interest in the Tabasquena Silver Mine in Zacatecas, Mexico. A cluster of 30 Epithermal veins have been discovered, with recent emphasis on exploring a large anomaly to drill. Advance also owns 13.5% of the Kakamega JV attached to Barrick Takeover Offer for Acacia Mining. Click Here For More Info
Gold mining stocks have soared approximately 30% so far in 2019, based on the performance of the NYSE Arca Gold Miners Index (GDM) as of November 15.1 Over the last 12 months, the sector is up nearly 50%. Some investors may assume that gold stocks have run their course. On the contrary, we think that the gold mining equities still have a great deal of upside to offer.
In brief, we think we’re in the early stages of a prolonged bull market for gold. While the relationship between the prices for gold bullion and gold stocks isn’t a linear one, rising demand for the yellow metal commodity has historically driven stock performance. Moreover, despite the recent rally, gold mining stocks have yet to recover from the beating they suffered starting in 2011. Still, recent outperformance — coupled with improving fundamentals — creates momentum, a key factor in many quantitative strategies.
Gold has been a store of value since the beginning of civilization, and yet the nuances of investing in gold — be it the metal or miners — is still a source of confusion. As we see it, that also means opportunity.
Here are five reasons to consider investing in gold equities now.
REASON #1. Rising Gold Prices Drive Demand
Figure 1. Gold Bull Market is Just Getting Started
Source: Bloomberg as of 11/15/19. Gold was $1,514 on 11/1/19, and $1,468 as of 11/15/19.
Gold recently broke past $1,500 an ounce for the first time since 2013 (Figure 1), as global political and macroeconomic trends are driving demand for the yellow metal. Along with other strategists, we think gold bullion could surpass its all-time high of $1,900 within the next couple of years. Key factors driving long-term demand for gold as a store of value and defensive asset, especially among central banks and institutions, include low-to-negative interest rates, rising debt levels, trade tensions and intensifying geopolitical risk.
Price movements for physical gold and gold-mining stocks aren’t perfectly in sync, but the relationship between them is strong and persistent, across economic cycles.
Historically, rising (and falling) gold prices have a three-times multiplier effect on gold stocks: If the value of gold bullion increases by 10%, mining stocks tend to increase by 30%, and vice versa. The reason: Miners have significant fixed operating costs and high operating leverage, meaning big swings in physical gold prices have a larger impact on miners’ profitability.
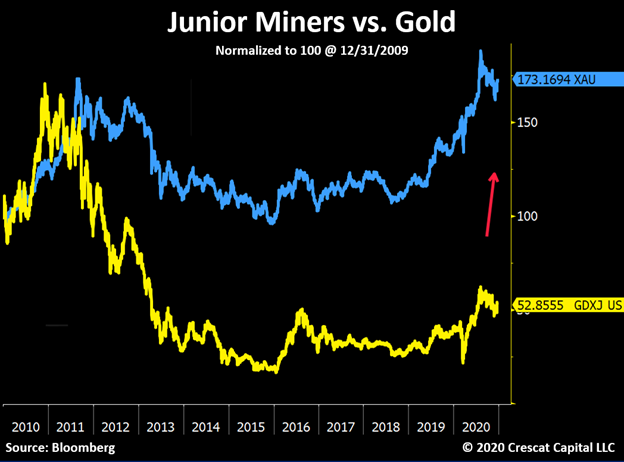
This relationship cuts both ways, as we saw after physical gold prices peaked in late 2011. As the value of gold subsequently declined (Figure 2), the value of gold stocks plummeted even more. Between 2011 and 2018, the sector posted negative returns in six out of eight calendar years. Even with recent gains, gold mining stocks have yet to recover relative to historical valuations. Since the sector peak in April 2011, gold mining equities are still off by more than 60%.
Figure 2. Gold Mining Equities are Very Undervalued
Source: Bloomberg as of 11/12/19.
Figure 3. Gold Demand Has Rebounded: Purchases by Central Banks
Central banks have been net buyers of gold over the past 10 years. Gold plays an important part in central banks’ reserves management, and they are significant holders of gold. According to the World Gold Council: “Today, central banks own almost 34,000 tonnes (t) of gold, making it the third-largest reserve asset in the world. The increase in central bank demand for gold reflects current geopolitical, political and economic conditions, as well as structural changes in the global economy. Gold is both a liquid, counter-cyclical asset and a long-term store of value. As such, it can help central banks meet their core objectives of safety, liquidity and return.â€
Source: Metals Focus, Refinitiv GFMS, World Gold Council. As of June 30, 2019.
REASON #2. Gold Stocks are Severely Undervalued
Given the amplified volatility of gold stocks relative to gold, investors need to go in with their eyes wide open. Nevertheless, multi-year declines may now set the stage for significant upside.
While miners as a group still trade below their net asset values, the discounts of smaller, “junior†miners are especially extreme, as much of the recent rally has been driven by the largest, “senior†gold miners. In fact, the valuation gap between North American junior and senior gold miners is the widest it’s ever been.
Figure 4. The Valuation Gap Between Senior and Juniors is at Historic Extremes
Source: BMO Capital Markets, FactSet. North American senior vs. junior gold miners. As of 7/19/19.
Reason #3. Supplies are Limited
Most investors grasp the importance of investing in companies whose business models are protected by “competitive moats.†Gold miners have this in spades, as it can take 15 years from discovery of a new gold mine to successful ore production. The barriers to entry are enormous for newcomers in this sector, given the need for expensive and specialized equipment, environmental regulations and political considerations.
Meanwhile, the supply of gold is finite and there have been increasingly fewer gold discoveries in recent years. This dynamic — combined with depressed valuations of junior gold miners — is driving consolidation in the industry. It is far cheaper for senior miners to buy new gold production than to “build†capacity themselves. In fact, based on an analysis of recent transactions, there is a 35% discount for buying ounces in the market via acquisitions versus discovering new ounces (according to Scotiabank).
Figure 5. Major Gold Discoveries have Declined Significantly
Investors love momentum — following positive trends in prices, earnings and other factors — and the rise of quantitative strategies has made this market phenomenon even more pervasive. For the last eight years, momentum has largely worked against the gold mining sector, but now there are signs the wind is shifting, and that momentum could soon work in its favor.
Analysts covering the sector have understandably been conservative in their estimates and may soon be playing catch up, given higher gold prices and a leveling off of mining costs. Any improvements in earnings outlooks could potentially accelerate positive momentum for the sector. As my colleague Paul Wong wrote earlier this month in The Sweet Spot for Gold Equities: â€At this stage in the gold cycle, we are in the sweet spot for gold mining company earnings. A starting low gold price base will result in earnings changes with a high percentage increase when measured quarter-over-quarter or year-over-year.â€
In Figure 6, we highlight the progression of 2020E EPS (estimates of earnings-per-share) revisions for the top-10 gold mining companies in SGDM2 versus the average 2020E EPS for the top-20 companies in the S&P 500 Index.3 Since January 2019, the average 2020E EPS for the top-10 gold mining companies had increased from $0.65 to $0.98 by the end of October, representing a 50% jump, compared to a decline of 9% for the S&P 500. After the Q3 reporting season, we would expect that 2020E EPS for gold miners will be revised even higher.
Figure 6. Sweet Spot for Gold Mining Company Earnings
Source: Bloomberg as of 10/31/19.
REASON #5. Gold Stocks Play a Different Role than Bullion
As with any investment, it’s important to think about the role of gold stocks in the context of a broader portfolio. One common misconception is that gold stocks and physical gold are two sides of the same coin. While their fates are certainly correlated, as asset classes they could not be more different.
Physical gold, whether it’s in the form of coin, bar or a trust (for example, Sprott Physical Gold Trust, NYSE Arca: PHYS), should be viewed as a stable store of value. It’s counter-cyclical and has proven over millennia to be an effective hedge against market turbulence and volatility.
As such, we recommend that investors allocate between 5% to 10% of their assets to physical gold and precious metals.
Gold stocks, conversely, should be viewed in the context of an investor’s overall equity portfolio; the size of the allocation will depend on many factors, including risk tolerance. Strategists advocate owning gold stocks continuously, in part because they have low correlations to the broader market. However, most investors view gold stocks as tactical investments. When valuations are severely depressed, as they are now, gold stocks may have the potential to outperform.
At Sprott, we believe that it may be time to consider investing in gold stocks, in addition to physical gold.
Posted by AGORACOM
at 11:28 AM on Monday, November 18th, 2019
A 3D Induced Polarization (IP) geophysical survey on its Tabasquena project in Zacatecas, Mexico has outlined a significant continuous chargeability anomaly.
This anomaly now has an east-west width of approximately 400 to 500 metres and an apparent strike length of over 1000 metres.
The anomaly remains open to the north and to the south and at depth.
Drilling to commence once the IP survey has been completed.
The
chargeability anomaly is approximately 250 metres below historical
mining and was designed for 500 to 550 metres of vertical depth
investigation.
The IP data also clearly shows that the large polarisable body/target
is apparently quickly deepening northward and getting closer to surface
southward. The IP anomaly starts at around 100 metres below the past
drill hole intersections that contained widespread gold and silver
mineralization in epithermal veins.
Tabasquena
Previous drilling found a network of veins with widespread gold and silver mineralization.
The
first phase geophysical survey revealed a large chargeability anomaly
right below these veins and is getting nearer to the surface as it
trends south.
Geophysical advisor described the anomaly as ‘quite remarkable in its size and continuity.
Advance is in a region with very large mines, including the El Coronel open pit, 12 miles to the south of Tabasquena.
Posted by AGORACOM
at 7:56 PM on Tuesday, November 5th, 2019
SPONSOR: Advance Gold AAX.v – Advance Gold controls 100% interest in the Tabasquena Silver Mine in Zacatecas, Mexico. A cluster of 30 Epithermal veins have been discovered, with recent emphasis on exploring a large anomaly to drill. Advance also owns 15% of the Kakamega JV attached to Barrick Takeover Offer for Acacia Mining. Click Here For More Info
Exchange-traded fund inflows shot higher by the largest amount since the first quarter of 2016, in what the council attributed to accommodative monetary policies, safe-haven and momentum buying. During the third quarter, the Federal Reserve cut interest rates twice, and the European Central Bank cut interest rates in a package of easing measures.
Leading gold ETFs include the SPDR Gold Trust GLD, +0.01%, iShares Gold Trust IAU, +0.07% and the Aberdeen Standard Physical Swiss Gold Shares ETF SGOL, -1.51%.
Overall gold demand rose just 3% during the quarter, as jewelry demand shrank by 16% as the yellow metal’s prices rose.
Gold futures GC00, -1.67% were holding above the $1,500 an ounce level on Tuesday and have climbed by 19% over the last 12 months.
Central-bank buying fell by 38%, as the third quarter of 2018 featured the highest amount of buying on record. Bar and coin demand dropped by half.
The gold supply rose by 4%, helped by a 10% increase in recycling.