Agoracom Blog Home

Posts Tagged ‘#mining’

FEATURE: Explor $EXS.ca Flagship Hosts NI 43-101 Resource – 609K Oz Indicated, 470K Oz Inferred #Gold $EXN.ca $HBE.ca $OSK.ca

Posted by AGORACOM-JC at 2:46 PM on Wednesday, July 4th, 2018

Why Explor Resources?

  • Flagship Property Offers The Following:
  • NI 43-101 Resource – 609,000 oz Indicated / 470,000 Inferred Gold
  • Property Is 13 KM From Downtown Timmins
  • Preliminary Metallurgical Testing on the low grade near surface gold ore completed
    • A representative sample from diamond drill holes in the area of the potential open pit
    • 45 kilogram composite sample of mineralized diamond drill core was sent to SGS Minerals Services for metallurgical test-work

FULL DISCLOSURE: Explor Resources is an advertising client of AGORA Internet Relations Corp.

FEATURE: Monarques Gold $MQR.ca Estimates Pit-Constrained Resource on its Swanson #Gold Project $GDX.ca $ECR.ca $MZZ.ca $QMX.ca $IMG.ca $IAG $MUX

Posted by AGORACOM-JC at 11:21 AM on Wednesday, July 4th, 2018

MQR: TSX-V

  • Pit-constrained Indicated resource of 90,319 ounces and Inferred resource of 941 ounces, and an underground Indicated resource of 7,732 ounces and Inferred resource of 5,975 ounces
  • Advantageous location of the Swanson deposit, some 100 metres from a railway track, provides easy access to the Beacon mill
  • Company holds a mining lease on the Swanson property, enabling it to put the deposit into production more rapidly
  • Continues to increase its combined Measured and Indicated resources to more than 3.1 million ounces of gold
Indicated Resource Inferred Resource
Zone Tonnage Grade
(g/t Au)
Ounces Tonnage Grade
(g/t Au)
Ounces
Pit-constrained 1,568,000 1.79 90,319 12,000 2.44 941
Underground 75,000 3.21 7,732 60,000 3.10 5,975
Total 1,643,000 1.86 98,051 72,000 2.99 6,917

FULL DISCLOSURE: Monarques Gold Corp. is an advertising client of AGORA Internet Relations Corp.

FEATURE: Tartisan Nickel $TN.ca Kenbridge Property Hosts M&I Resource of 7.14 Million Tonnes at 0.62% Nickel, 0.33% Copper $NI.ca $GP.ca

Posted by AGORACOM-JC at 2:11 PM on Tuesday, July 3rd, 2018

TN:CSE

Investment Highlights

  • Acquisition of Canadian Arrow Mines Limited includes two Ontario-based nickel-copper-(cobalt) properties
  • Canadian Arrow’s Kenbridge property has a measured and indicated resource of 7.14 million tonnes at 0.62% nickel, 0.33% copper
  • 20 percent equity stake in Eloro Resources and 2 percent NSR in their La Victoria property with drill program in progress
  • Strong management team with proven experience in advancing projects to production readiness and increasing shareholder value
  • Tightly held share structure with 50 percent owned by approximately 10 investors

Kenbridge Ni Project (ON, Canada)

  • Advanced  stage  deposit  remains open  in  three  directions,  is  equipped with a 623m  deep  shaft  and  has  never  been  mined.
  • Preliminary  Economic Assessment completed in   2008   and later updated returned robust project
    economics and operating costs including  a  NPV  of  C$253M  and  cash costs of US$3.47/lb of nickel net of
    copper credits.
  • Plans for Kenbridge include updating the 2008 PEA, advancing the project through to feasibility and exploring
    the open mineralization at depth

FULL DISCLOSURE: Tartisan Nickel Corp. is an advertising client of AGORA Internet Relations Corp.

#Lithium demand from battery makers to almost double by 2027 $NAM.ca $LIC.ca $LIX.ca

Posted by AGORACOM-JC at 12:01 PM on Thursday, June 28th, 2018
  • Outlook for lithium continues to shine, with demand from companies that produce batteries to power electric cars, laptops and other high-tech devices, expected to increase 650% by 2027
  • Overall lithium demand forecast to rise more than threefold over that period, a new study shows

Cecilia Jamasmie

The outlook for lithium continues to shine, with demand from companies that produce batteries to power electric cars, laptops and other high-tech devices, expected to increase 650% by 2027, with overall lithium demand forecast to rise more than threefold over that period, a new study shows.

While the next nine years will drain less than 1% of the reserves in the ground, battery makers will need more lithium to support their production, which will boost demand for the key metal almost 16% to reach 1 million tonnes, according to Roskill’s 15th edition market outlook report.

Expected supply, however, is far from the astronomical figure forecast by the research firm, with Canada’s Bank of Montreal expecting between 80,000 and 91,500 tonnes of lithium coming from mines by 2025. And BMO’s numbers include recently up-sized expansion plans by the market leaders, Chile’s SQM, China’s Tianqi Lithium, Albemarle and FMC, as well as Nemaska Lithium’s plans to build a spodumene mine in northwestern Quebec, Canada.

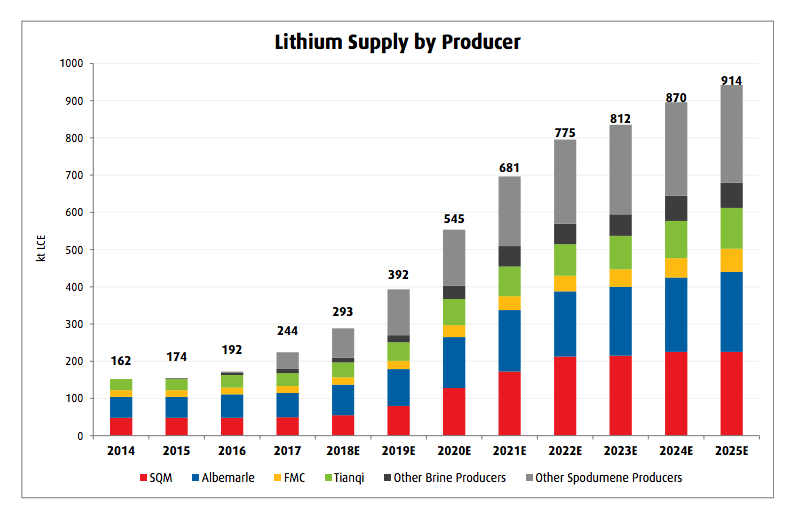
Wave of much-needed spodumene based supply coming online. (Source: BMO Capital Markets, companies reports.)

Roskill estimates that demand from lithium-ion battery manufacturers will grow from 46% last year to 83% by 2027. Use of lithium hydroxide, in turn, is also forecast to become more prevalent, increasing from 25% of lithium compounds used in rechargeable batteries in 2021 to 55% by 2027.

The analysts expect the market for battery-grade lithium compounds to remain tight, however, as installing new battery grade capacity has proven complex and forecast demand growth is greatest for these products.

In terms of lithium prices, they are expected to peak in 2018, as greater supply availability of mined and refined lithium will enter the market in coming years, causing prices to briefly fall back in 2019, with a floor of $11,000/t battery grade lithium carbonate, Roskill says.

Beyond 2021, the research firm expects lithium prices to rise  above 2018 levels again, as continued demand growth for battery grade lithium compounds will apply greater demand-side pressure on prices.

Source: http://www.mining.com/lithium-demand-battery-makers-almost-double-2027/

$GGX.ca GGX Gold Intersects 8.71 g/t Gold, 114 g/t Silver and 67.8 g/t Tellurium – Over 0.86 meters, Gold Drop Property, Southern British Columbia $K.ca $GZD.ca

Posted by AGORACOM at 9:34 AM on Wednesday, June 27th, 2018

https://s3.amazonaws.com/s3.agoracom.com/public/companies/logos/564602/hub/ggx_large.png

  • Analytical results have been received for drill holes DDCOD18-7 to DDCOD18-16, targeting the COD vein
  • DDEVE18-1 to DDEVE18-4 targeting the Everest vein, both within the Gold Drop Southwest Zone
  • DDCOD 18-11 returned 8.71 g/t gold, 114 g/t silver and 67.8 g/t tellurium over 0.86m
  • DDCOD18-7 at the COD Vein 7.53 g/t gold, 70.9 g/t silver and 45.1 g/t tellurium over 0.76 meter core

Vancouver, British Columbia (FSCwire)GGX Gold Corp. (TSXV: GGX) (the “Company” or “GGX”) is pleased to announce drill core analytical results from this winter’s Phase III diamond drilling program on the Gold Drop Property, located near Greenwood, BC. Analytical results have been received for drill holes DDCOD18-7 to DDCOD18-16, targeting the COD vein and DDEVE18-1 to DDEVE18-4 targeting the Everest vein, both within the Gold Drop Southwest Zone. Highlights include 8.71 g/t gold, 114 g/t silver and 67.8 g/t tellurium over 0.86 meter core length in DDCOD18-11 and 7.53 g/t gold, 70.9 g/t silver and 45.1 g/t tellurium over 0.76 meter core length in DDCOD18-7 at the COD Vein. The best COD Vein intercept to date from the 2018 drill program is 14.6 g/t gold, 150 g/t silver and 102 g/t tellurium over 2.1 meter core length in DDCOD-18-3 (News Release of May 29, 2018).


To view the graphic in its original size, please click here

The ongoing diamond drill program is designed to test and further define the COD Vein, a Dentonia/Jewel style quartz vein, located in the Gold Drop Southwest Zone. Trenching during 2017 has exposed the northeast – southwest striking COD Vein for over 160 meter strike length. Drilling is also testing the Everest Vein in the area of a 2017 trench, located approximately 600 meters southwest of the COD Vein. Chip samples collected in 2017 across the approximate 0.4 meter wide vein exposure returned up to 52.8 g/t gold and 377 g/t silver while a grab sample of a quartz vein boulder broken off the outcrop by the excavator returned 81.8 g/t gold and 630 g/t silver (News Release of August 21, 2017). During 2017 forty meters of trenching was completed on the newly discovered Everest gold bearing quartz vein.

The analytical results reported in this News Release are highlights from holes 7 through 16 of the 2018 drilling program on the COD Vein, and holes 1 through 4 on the Everest Vein. Since true widths cannot be accurately determined from the information available the core lengths (meters) are reported. The gold and silver analyses are reported in grams per tonne (g/t). The intervals listed in the following table are from the gold and silver bearing vein and / or adjacent low grade mineralized host rock.


Hole ID From (m) To (m) Interval Length (m) Au (g/t) Ag (g/t) Te (g/t)
COD18-7 24.97 26.21 1.24 1.14 11.2 8.37
COD18-7 26.21 26.97 0.76 7.53 70.9 45.1
COD18-8 26.71 27.35 0.64 1.78 15.1 11
COD18-8 27.35 28.25 0.9 0.23 2.47 2.32
COD18-8 28.25 29.06 0.81 1.3 7.02 4.87
COD18-9 31.42 32.41 0.99 2.48 19.15 14.15
COD18-11 42.7 43.56 0.86 8.71 114 67.8
COD18-12 65.84 66.42 0.58 1.23 7.89 5.93
COD18-14 17.9 18.71 0.81 0.86 7.12 5.19
COD18-14 18.71 19.4 0.69 5.54 47.1 34.1
COD18-15 12.85 13.87 1.02 1.18 12.05 8.08
COD18-15 25.85 26.75 0.9 5.89 77.6 60.3
COD18-16 32.2 32.61 0.41 3.13 18.9 14.35
COD18-16 32.61 33.1 0.49 1.89 19.55 18.45
COD18-16 36.43 37.2 0.77 0.92 5.34 5.34
EVE18-2 20.9 21.4 0.5 2.04 18.85 14.05
EVE18-2 21.4 22.2 0.8 0.84 7.31 5.66
EVE18-2 22.2 23 0.8 1.3 11.25 8.64
EVE18-3 43.82 44.6 0.78 1 9.64 6.24
The most significant gold mineralization is found in the COD Dentonia/Jewel style quartz vein (including 26.21-26.97 meters in DDCOD18-7, 42.70-43.56 meters in DDCOD18-11, 18.71-19.40 meters in DDCOD18-14, and 25.85-26.75 meters in DDCOD18-15).  The vein is mineralized with pyrite and trace chalcopyrite and telluride minerals. Surrounding alteration is a magnetite destructive silicification and chlorite alteration. Strong fine disseminated pyrite is often found in these alteration zones. Significant gold mineralization occurs locally in the altered host rock such as 12.85-13.87 meters in DDCOD18-15 and 21.4-23.0 meters in Everest hole DDEVI18-2 (adjacent to the gold bearing vein at 20.9-21.4 meters).

To view the graphic in its original size, please click here


Hole ID Dip Azimuth Depth (m)
COD18-7 52 354 47.55
COD18-8 65 354 62.79
COD18-9 75 354 93.27
COD18-10 55 338 71.34
COD18-11 45 280 65.84
COD18-12 55 291 87.17
COD18-13 45 261 68.89
COD18-14 45 351 41.45
COD18-15 55 351 50.6
COD18-16 65 351 50.6
EVE18-1 50 85 47.85
EVE18-2 45 68 47.85
EVE18-3 55 68 66.14
EVE18-4 46 45 56.39
Observed core vein contact angles indicate the COD vein is sub-vertical being structurally controlled by the host rock. The predominant host rock for the COD vein is a massive and competent medium grain granodiorite of the Antsey Pluton. Faulting does occur however the general north south trend of the vein is predictable.


To view the graphic in its original size, please click here


To view the graphic in its original size, please click here


Drill core is being geologically logged and sampled at the Greenwood facility. Drill core is sawn in half with half core samples submitted for analysis and remaining half core stored in a secure location. Core samples were delivered to the ALS Minerals laboratory in Vancouver to be analyzed for gold by Fire Assay – AA. The samples are also being analyzed for 48 Elements by Four Acid and ICP-AES / ICP-MS. Quality control (QC) samples are inserted at regular intervals.

David Martin, P.Geo., a Qualified Person as defined by NI 43-101, is responsible for the technical information contained in this News Release.

On Behalf of the Board of Directors,

Barry Brown, Director

604-488-3900

Investor Relations: 

Mr.  Jack Singh: 604-488-3900     E-mail: [email protected]

“ We don’t have to do this, we get to do this ” 

The Crew

$GR.ca Great Atlantic Collects Sample for Preliminary Tungsten Sorting Studies on Its 100% Owned South Quarry Tungsten Property, Newfoundland

Posted by AGORACOM at 9:16 AM on Monday, June 25th, 2018

https://s3.amazonaws.com/s3.agoracom.com/public/companies/logos/564603/hub/GREATATLANTIC_LOGO_TESTER-e1480712241913.jpg

  • Collected a bench scale metallurgical sample of tungsten bearing vein material from its South Quarry Tungsten Property
  • Sample processed utilizing ore sorting technologies to evaluate viability of processing the tungsten bearing veins on the Property.
  • The Property hosts tungsten mineralization in multiple areas, including high grade pegmatite veins in the area of two quarries in the northern region of the Property

Vancouver, British Columbia (FSCwire)GREAT ATLANTIC RESOURCES CORP. (TSXV.GR) (the “Company” or “Great Atlantic”) is pleased to announce it has collected a bench scale metallurgical sample of tungsten bearing vein material from its South Quarry Tungsten Property, located in east-central Newfoundland. The sample will be processed utilizing ore sorting technologies to evaluate the viability of such technologies for processing the tungsten bearing veins on the Property. The Property hosts tungsten mineralization in multiple areas, including high grade pegmatite veins in the area of two quarries in the northern region of the Property. Previous grab samples collected by Great Atlantic from the two quarries exceeded 1% WO3 with some samples exceeding 5% WO3 (News Release of November 19, 2015).


To view the graphic in its original size, please click here


Tungsten bearing pegmatite veins occur in the northern region of the property including at a quarry referred to as the South Quarry and an adjacent smaller quarry. The veins were first reported in the area of these quarries during the 1980s. Great Atlantic confirmed high grade tungsten mineralization (scheelite) in veins in rubble and bedrock at the two quarries during 2015 (News Release of November 19, 2015). Eleven rubble grab samples exceeded 5% WO3 (W % x 1.26 equals WO3%). A 20 cm long channel sample along a 15cm wide vein in the small quarry returned 2.96% WO3 while a grab sample from a 0.25 meter wide vein in the South Quarry returned 11.94% WO3.


Great Atlantic recently collected a bench scale sample of tungsten bearing vein material from the South Quarry for preliminary metallurgical studies. The sample will be processed utilizing ore sorting technologies to evaluate the viability of such technologies for processing the tungsten bearing veins on the Property. Great Atlantic is currently discussing ore sorting options with various processing companies.


Tungsten Bearing Pegmatite Veins at South Quarry

To view the graphic in its original size, please click here


A qualified person verified the 2015 sample data. The qualified person supervised the 2015 sampling. The 2015 samples (and lab-inserted blank, duplicate and standard samples) were analyzed at ALS Minerals in Sudbury, Ontario (ALS Minerals is independent of Great Atlantic Resources). Tungsten analysis was by lithium metaborate fusion followed by acid dissolution and ICP-MS analysis with some samples re-analyzed by XRF.


South Quarry

To view the graphic in its original size, please click here


Tungsten bearing vein cutting metasediment rubble at South Quarry

To view the graphic in its original size, please click here


The company is also planning diamond drilling during 2018 on the South Quarry Property. The Company has received a permit to drill five holes in the northern region of the Property in an area where 2016 trenching exposed tungsten bearing veins.


The South Quarry Property covers an area of 3,600 hectares. Access to the property is excellent with a paved road transecting the property.


Christopher R. Anderson, President, CEO and Director, stated, “Mr. Martin and Myself were an integral part of the initial Management team that advanced the Sisson Tungsten-Molybdenum Project in New Brunswick, an advanced stage project currently operated by Northcliff Resources Ltd.  We understand the tungsten market and feel that the South Quarry Tungsten Property, although early stage, has the ear marks of being a significant asset for the company.


Currently Great Atlantic has two Joint Venture partners and we would be happy to welcome a third to assist in advancing the South Quarry Tungsten Project.”


David Martin, P.Geo., a Qualified Person as defined by NI 43-101 and VP Exploration for Great Atlantic, is responsible for the technical information contained in this News Release.


About Great Atlantic Resources Corp.: Great Atlantic Resources Corp. is a Canadian exploration company focused on the discovery and development of mineral assets in the resource-rich and sovereign risk-free realm of Atlantic Canada, one of the number one mining regions of the world. Great Atlantic is currently surging forward building the company utilizing a Project Generation model, with a special focus on the most critical elements on the planet that are prominent in Atlantic Canada, Antimony, Tungsten and Gold.


On Behalf of the board of directors


“ Christopher R Anderson ”


Mr. Christopher R Anderson “Always be positive, strive for solutions, and never give up”

President CEO Director

604-488-3900

The 3 Biggest Trends That Will Drive #Gold In The Next 30 Years $AMK.ca $EXS.ca $MQR.ca $GR.ca $GGX.ca $HPQ.ca $GZD.ca

Posted by AGORACOM-JC at 11:45 AM on Thursday, June 21st, 2018

Olivier Garret , Contributor Opinions expressed by Forbes Contributors are their own.

  • The World Gold Council recently released an insightful report titled, Gold 2048: The Next 30 Years for Gold.
  • Report looks at overarching demographic, technological, economic, political, and social trends around the world and their implications for the gold market.

The World Gold Council recently released an insightful report titled, Gold 2048: The Next 30 Years for Gold. This report looks at overarching demographic, technological, economic, political, and social trends around the world and their implications for the gold market.

The report has brought together top gold industry experts as well as world-renowned authors and economists who discuss the underlying macro forces that will drive gold in the next 30 years.

This is an eye-opening yet lengthy read that I highly recommend to all investors (find it here). To give you a glimpse of what’s inside the report, this short overview presents the highlights and takeaways from an investment perspective.

Trend #1: The Rise of the Middle Class in Emerging Markets

According to the report, in the next 30 years, demographics will play an increasingly important role in shaping the global economy.

The big story of the next quarter-century will be the rising middle class in emerging markets, particularly in China and India. Recent reports estimated that, over the next 17 years, 170 million Asians will enter the middle class every year.

India, the largest consumer of gold, is set to become the fastest-growing economy in the coming decades. If it manages to pull off its ambitious political and economic reforms, its middle class might soar from 19% to 73% of total population.

“Not only will the Indian middle class become a driving force within the Indian economy, but its aggregate purchasing power will result in the creation of one of the largest markets in the world,” says the report.

China’s middle class, too, is rapidly expanding. But unlike India, the Chinese are facing major demographic headwinds. Key among them is an aging population, which might curb economic growth despite the gains from the expanding middle class.

Takeaway for gold investors:

India and China are the biggest consumers of gold worldwide. As their middle class and aggregate purchasing power grow, gold demand is expected to soar.

Trend #2: A Shift in Gold Demand and Supply Dynamics

Jewelry and investment-grade bullion are not the only drivers of gold demand. Gold has wide industrial applications as well. Practically every piece of electronics has a little gold used as highly conductive and corrosion-resistant material. Unknown to many, gold is even effectively used in medicine.

Here’s a quick rundown of technological trends from the report that will spur industrial gold demand:

  • The adoption of the Internet of Things (IOT) will lead to an explosion of electronics (and gold) used in all consumer durable goods.
  • A shift to hybrid and electric vehicles demand far more high-end electronic components that use gold.
  • Gold compounds show promise in clinical testing and even drugs as a new class of antibiotic.
  • A booming solar panel industry will demand more gold as a core catalyst component.

There are many more gold applications, but industrial applications make up only a small part of aggregate gold demand. Investment demand has a much more profound impact on the gold price.

The experts who contributed to the report predict that the growing popularity of gold-backed ETFs as well as advancements in fintech will be some of the biggest drivers of gold demand in the coming years. The convenience and cost-effectiveness that technology brings will make gold attractive to more investors, including Millennials.

Meanwhile, gold supply is under major constraints due to rising operating costs, scant gold discoveries, and low gold prices.

The report sums up the current situation in gold supply:

We expect new mine supply to decline over the next 30 years, hit by rising costs. Metals Focus estimates that, even today, new gold mines need a price of about US$1,500/oz, and with costs having increased at a compound annual rate of 10% over the past 15 years, additional ESG costs are likely to mean that even higher gold prices will be required in the future.

Takeaway for gold investors:

Due to operating constraints, gold miners will struggle to keep up with the growing gold demand. This, in turn, will put upward pressure on gold prices in the long run.

Trend #3: A Volatile Future

The investment landscape itself will radically change in the next 30 years. A combination of demographic, technological, and macroeconomic trends is creating structural changes in the global economy that will have profound implications for investors.

  • Working-age populations are shrinking in the developed world. Labor scarcity will put a strain on economic growth and equity returns. A rise in wages due to constrained labor supply is likely to mark the end of the low inflation era.
  • The rise of automation and AI—displacing increasingly more workers—will elevate political and social tensions and bring more volatility to the markets. We might also expect Western politics to become more redistributive, which will put a greater financial burden on investors via rising taxes.
  • The impact of demographics will have a profound effect on the dynamics of global powers. The Western world will be increasingly burdened by aging populations, scarce labor, and stagnant economic growth. Conversely, India and China are set to reach their golden demographic spot in the coming decades. Since demographics have a direct effect on economic growth, we are likely to witness an unprecedented shift of economic power from West to East. As a result, geopolitical tensions will rise.
  • The widespread adoption of big data and artificial intelligence in investing will increase automated trading in liquid markets. Automation and fast data dissemination will make investment preferences more correlated, so true diversification will be hard to achieve.

Takeaway for gold investors:

The next 30 years are going to be highly unstable, both politically and financially. As history shows, gold performs best in volatile times—and is the best, time-tested hedge against any crisis.

Source: https://www.forbes.com/sites/oliviergarret/2018/06/20/the-3-biggest-trends-that-will-drive-gold-in-the-next-30-years/#26437bbc29bb

Online Education #edtech market in #India: From humble beginnings to a $2 billion industry $BTRU.ca $ARCL $CPLA $BPI $FC.ca

Posted by AGORACOM-JC at 9:57 AM on Thursday, June 21st, 2018

  • On a growth spree, the Indian online education market is presenting a lot of opportunities to ed-tech players in the arena
  • The industry is expected to achieve the growth benchmark of $2 billion by the year 2021, a joint report released last year by Google and KPMG stated
  • Also found that the paid user base for online education services will also grow at least by six times, if not more.

Ed-tech in India has had humble beginnings right from its inception. From the elementary smart classes by Educomp to the current shape and state of the education industry where several ed-tech startups and foreign players are vying for a slice of the education market in India.

On a growth spree, the Indian online education market is presenting a lot of opportunities to ed-tech players in the arena. The industry is expected to achieve the growth benchmark of $2 billion by the year 2021, a joint report released last year by Google and KPMG stated. The report also found that the paid user base for online education services will also grow at least by six times, if not more.

While the report’s findings are quite impressive, the online education sector in India didn’t always possess the same grandeur or even garner the same interest that it does now. Initiated in the 1990s, Smart Class by Educomp launched by Shantanu Prakash was the first venture that brought a large scale change in the education sector.

Educomp Solutions started off with the business of setting up and maintaining computer labs in private schools till 1999. The company’s business grew in 1999, when founder Shantanu Prakash decided to expand the trading operations by including CD-ROMs and educational toys. However, the biggest milestone in the company’s decades-long journey remains the introduction of Educomp SmartClass – a ‘one of its kind’ model that revolutionized the way kids learn things at school.

Since then, the Indian education sector has seen quite some growth in terms of development and innovations. Ed-tech service providers and a few players in the industry are giving a makeover to ed-tech wherein the capital demands and investments have brought India to the forefront in the space.

While still nascent, India is home to thousands of companies providing education technology services to schools as well as individuals, with over 900 managing to come up in the past 2 years alone.

The innate efficacy of the tech-driven setup is still a hot topic for nationwide debates, the ground report says otherwise. Surveys conducted with several participating students have shown that the students aided with online education and smart class were able to achieve a more profound understanding of the subject matter, as compared to the students who stuck to conventional methods of learning.

The investors are surely past the over-stretched debate, with big names like the Chan Zuckerberg Initiative, Tencent Holdings, etc., having opened their coffers to Indian ed-tech honchos BYJU’s and AEON Learning. And that’s not it. The FinTech sector in India has also embraced its educational counterpart, with indigenous digital lending platforms like Zest Money and FinMomenta partnering with players like Upgrad and Edureka.

The use of technology in an already tech-driven world is not the only reason why investors are attracted to the online education sector in India. Another driving factor remains the large and rapidly growing consumer base. There are about 409 million Internet users in India, a country with 46 per cent of its population in the age group of 15-20 years.

Apart from the increasing Internet penetration, the low cost involved in pursuing an online course, as well as the convenience, flexibility and personalization also attribute to the popularity of ed-tech among students. This, in turn, amounts to growing interest from investors.

While some educators perceive online education as a looming threat to the very existence of offline education system, CEO of Embibe.com Aditi Awasthi believes that the ed-tech sector will remain a fringe play in the face of traditional methods of education until it hits at the heart of what matters to the students – outcomes. “There has to be a clear RoI from consuming education through high-tech channels beyond mere convenience. Data science-driven personalization can make that happen,” she says.

Source: http://www.thehansindia.com/posts/index/Education-&-Careers/2018-06-20/Online-Education-market-in-India-From-humble-beginnings-to-a-2-billion-industry/390846

Monarques Gold $MQR.ca Estimates Pit-Constrained Resource on its Swanson Gold Project $MUX.ca $SII.ca

Posted by AGORACOM-JC at 8:56 AM on Wednesday, June 20th, 2018

Emerging gold producer in Abitibi (CNW Group/Monarques Gold Corporation)

  • The Swanson maiden mineral resource estimate for a combined pit-constrained and underground scenario is as follows:
    • A pit-constrained Indicated resource of 90,319 ounces and Inferred resource of 941 ounces, and an underground Indicated resource of 7,732 ounces and Inferred resource of 5,975 ounces.
  • The advantageous location of the Swanson deposit, some 100 metres from a railway track, provides easy access to the Beacon mill.
  • The Corporation holds a mining lease on the Swanson property, enabling it to put the deposit into production more rapidly.
  • Monarques Gold continues to increase its combined Measured and Indicated resources to more than 3.1 million ounces of gold (see table 3 at the end of press release).

MONTREAL, June 20, 2018 /CNW/ – MONARQUES GOLD CORPORATION (“Monarques”, “Monarques Gold” or the “Corporation”) (TSX-V:MQR) (OTCMKTS:MRQRF) (FRANKFURT:MR7) is pleased to report the results of a mineral resource estimate for its Swanson gold project, 65 kilometres north from its wholly-owned Beacon mill and 12 kilometres northeast of Barraute, Quebec. The CN railway line crosses the property, some 100 metres north of the Swanson deposit. Monarques acquired a 100% interest in the Swanson and McKenzie Break properties from Agnico Eagle Mines Limited (NYSE:AEM, TSX:AEM) (see press release dated December 21, 2017). The resource estimate was prepared by Christine Beausoleil, P.Geo. and Alain Carrier, P.Geo., M.Sc., of InnovExplo Inc., both qualified and independent persons as defined by NI 43-101. The effective date of the estimate is June 15, 2018.

“The great advantage of the Swanson project is that the railway track is directly on the property, which allows easy access to both our mills,” said Jean-Marc Lacoste, President and Chief Executive Officer of Monarques. “Much like for the McKenzie Break project, we are very pleased to have a pit-constrained resource for the Swanson project (see figure), as this could also mean additional feed for the Beacon mill.  In addition, Monarques holds a mining lease on the Swanson property, which could allow us to put the deposit into production more quickly. Our new strategy of targeting pit-constrained resources from our McKenzie Break and Swanson properties, together with the reopening of our Beacon Mill at the end of the year, could be a winning solution for all three projects.”

The 2018 maiden mineral resource estimate was prepared using Leapfrog GEO and GEOVIA GEMS software. Leapfrog was used for 3D modelling of the four mineralized zones while GEMS was used for grade estimation and block modelling. Statistical studies were done using Snowden Supervisor and Microsoft Excel software. The estimate was performed using 3D block modelling with the Ordinary Kriging interpolation method.

The diamond drilling database contains the results of 146 surface and 63 underground drill holes provided by Monarques. Basic univariate statistics were performed on datasets of individual raw gold assays for each zone and for the dilution envelope. The capping (30 g/t Au) was applied on raw assays before compositing at 1.5 m.

The estimate is reported for a potential scenario combining pit-constrained and underground resources at a cut-off grade of 0.8 g/t Au (pit constrained) and 2.7 g/t Au (underground). The cut-off grades were calculated using a gold price of USD1,296/oz, a CAD:USD exchange rate of 1.28 and the following parameters: (a) pit-constrained scenario: mining cost CAD4.94/t, processing cost CAD27.00/t, General and administrative CAD4.00/t, pit slope of 50 degrees used during Whittle optimization; (b) underground scenario: mining cost CAD90.00/t, processing cost CAD27.00/t, General and administrative CAD10.00/t.

The Swanson project mineral resource estimate for a potential scenario combining pit-constrained and underground resources at cut-off grades of 0.8 g/t Au (pit-constrained) and 2.7 g/t Au (underground) is summarized in the following table 1, whereas table 2 shows the sensitivity analysis of the Swanson maiden mineral resource estimate for the pit-constrained scenario.

Table 1 – Swanson Maiden Mineral Resource Estimate for a combined pit-constrained and underground scenario at a cut-off grade of 0.8 g/t Au (in pit) and 2.7 g/t Au (underground)

Indicated Resource

Inferred Resource

Zone

Tonnage

Grade
(g/t Au)

Ounces

Tonnage

Grade
(g/t Au)

Ounces

Pit-constrained  

1,568,000

1.79

90,319

12,000

2.44

941

Underground  

75,000

3.21

7,732

60,000

3.10

5,975

Total

1,643,000

1.86

98,051

72,000

2.99

6,917


Notes to the mineral resource table:

•

These mineral resources are not mineral reserves, as they do not have demonstrated economic viability.

•

The 2014 CIM definitions and guidelines for mineral resources have been followed.

•

Results are presented in situ and undiluted and considered to have reasonable prospects for economic extraction.

•

The estimation encompasses four zones with a minimum true thickness of 2.5 m using the grade of the adjacent material when assayed, or a value of zero when not assayed.

•

A high-grade capping of 30 g/t Au (4 g/t Au for the dilution envelope) was applied to assay grades prior to compositing grade for interpolation using an Ordinary Kriging interpolation method, based on 1.5 m composite for block size of 3 m x 3 m x 3 m.

•

Bulk density values were applied on the following lithological basis (g/cm3): I2 = 2.78; I4O, V3, V4 = 2.90, and OVB = 1.5.

•

The number of metric tons was rounded to the nearest thousand and the metal contents are presented in troy ounces (tonne x grade / 31.10348).

•

InnovExplo is not aware of any known environmental, permitting, legal, title-related, taxation, socio-political or marketing issues, or any other relevant issue not reported in this Technical Report that could materially affect the mineral resource estimate.


Table 2 – Sensitivity analysis of the Swanson Maiden Mineral Resource Estimate for the pit-constrained scenario

Indicated Resource

Inferred Resource

Cut off

Au (g/t)

Tonnes

Ounces

Cut off

Au (g/t)

Tonnes

Ounces

0.6

1.65

1,798,000

95,499

0.6

2.22

14,000

997

0.7

1.72

1,685,000

93,157

0.7

2.28

13,000

952

0.8

1.79

1,568,000

90,319

0.8

2.44

12,000

941

0.9

1.87

1,453,000

87,173

0.9

2.56

11,000

907

1

1.94

1,338,000

83,651

1

2.66

10,000

856


The NI 43-101 technical report will be delivered and filed on SEDAR within the next 45 days.

The technical and scientific content of this press release has been reviewed and approved by Marc-André Lavergne, Eng., the Corporation’s qualified person and by Christine Beausoleil, P.Geo. and Alain Carrier, P.Geo., M.Sc. of InnovExplo Inc., all of whom are qualified persons as defined by NI 43-101.

ABOUT MONARQUES GOLD CORPORATION

Monarques Gold Corporation (TSX.V:MQR) is an emerging gold producer focused on pursuing growth through its large portfolio of high-quality projects in the Abitibi mining camp in Quebec, Canada. The Corporation currently owns close to 300 km² of gold properties (see map), including the Beaufor Mine, the Croinor Gold (see video), Wasamac, McKenzie Break and Swanson advanced projects, and the Camflo and Beacon mills, as well as six promising exploration projects. It also offers custom milling services out of its 1,600 tonne-per-day Camflo mill. Monarques enjoys a strong financial position and has more than 150 skilled employees who oversee its operating, development and exploration activities.

Forward-Looking Statements

The forward-looking statements in this press release involve known and unknown risks, uncertainties and other factors that may cause Monarques’ actual results, performance and achievements to be materially different from the results, performance or achievements expressed or implied therein. Neither TSX Venture Exchange nor its Regulation Services Provider (as that term is defined in the policies of the TSX Venture Exchange) accepts responsibility for the adequacy or accuracy of this press release.

Table 3 – Monarques Gold Measured and Indicated Resources

Tonnes
(metric)

Grade
(g/t Au)

Ounces

Wasamac property1

Measured Resources

3.99 million

2.52

323,300

Indicated Resources

25.87 million

2.72

2,264,500

Total Measured & Indicated Resources

29.86 million

2.70

2,587,900

Beaufor Mine2

Measured Resources

74,400

6.71

16,100

Indicated Resources

271,700

7.93

69,300

Total Measured & Indicated Resources

346,200

7.67

85,400

Croinor Gold Mine3

Measured Resources

80,100

8.44

21,700

Indicated Resources

724,500

9.20

214,300

Total Measured & Indicated Resources

804,600

9.12

236,000

Swanson property4

Indicated Resources

1,643,000

1.86

98,051

McKenzie Break property5

Pit Constrained

Indicated Resources

939,860

1.59

48,133

Underground

Indicated Resources

281,739

5.90

53,448

Simkar Gold property6

Measured Resources

33,570

4.71

5,079

Indicated Resources

208,470

5.66

37,905

Total Measured & Indicated Resources

242,040

5.52

42,984

TOTAL

Measured & Indicated Resources

3,151,916

1 Source: Technical Report on the Wasamac Project, Rouyn-Noranda, Québec, Canada, Tudorel Ciuculescu, M.Sc.,

P.Geo., October 25, 2017, Roscoe Postle Associates Inc.

2 Source: NI-43-101 Technical Report on the Mineral Resource and Mineral Reserve Estimates of the Beaufor Mine

as at September 30, 2017, Val-d’Or, Québec, Canada, Carl Pelletier, P. Geo. and Laurent Roy, Eng.

3  Source: Monarques prefeasibility study (January 19, 2018) and resource estimate (January 8, 2016)

4 Source: NI 43‐101 Technical Report on the Swanson Project, June 15, 2018, Christine Beausoleil, P.Geo. and

Alain Carrier, P.Geo., M.Sc. of InnovExplo Inc.

5 Source: NI 43‐101 Technical Report on the McKenzie Break Project, April 17, 2018, Alain-Jean Beauregard,

P.Geo., and Daniel Gaudreault, Eng., of Geologica Groupe-Conseil Inc., and Christian D’Amours, P.Geo., of
GeoPointCom Inc.

6 Source: MRB et Associés (January 2015)


Cision View original content with multimedia:http://www.prnewswire.com/news-releases/monarques-gold-estimates-pit-constrained-resource-on-its-swanson-gold-project-300669001.html

SOURCE Monarques Gold Corporation

View original content with multimedia: http://www.newswire.ca/en/releases/archive/June2018/20/c8059.html

Jean-Marc Lacoste, President and Chief Executive Officer, 1-888-994-4465, [email protected], www.monarquesgold.com; Elisabeth Tremblay, Senior Geologist – Communications Specialist, 1-888-994-4465, [email protected], www.monarquesgold.comCopyright CNW Group 2018

Great Atlantic Receives Diamond $GR.ca Drilling Permit and $40,000 Exploration Grant for Its 100% Owned Keymet Base Metal Project $ANX.ca

Posted by AGORACOM at 9:18 AM on Monday, June 18th, 2018

https://s3.amazonaws.com/s3.agoracom.com/public/companies/logos/564603/hub/GREATATLANTIC_LOGO_TESTER-e1480712241913.jpg

  • Received diamond drilling permit (up to 15 holes) and a $40,000 exploration grant from the New Brunswick government for its Keymet Precious – Base Metal Property, located near Bathurst, northeast New Brunswick.
  • Program to begin  July 2018
  • Historical Hole Ky-17-6 (Elmtree 12): 3.54% Zn, 0.92% Cu, 0.28% Pb & 115 g/t Ag / 12.05 meter core length (7.76 % Zn Equiv. / 12.05 meter core length) & 0.64 g/t Au over 19.96 meter core length (new gold discovery).


Vancouver, British Columbia (FSCwire)GREAT ATLANTIC RESOURCES CORP. (TSXV.GR) (the “Company” or “Great Atlantic”) is pleased to announce it has received a diamond drilling permit (up to 15 holes) and a $40,000 exploration grant from the New Brunswick government for its Keymet Precious – Base Metal Property, located near Bathurst, northeast New Brunswick. The Company is planning diamond drilling beginning in July 2018 in the northwest region of the Property to define polymetallic veins (zinc, lead, copper and silver bearing) and a explore a gold bearing zone discovered during 2017 drilling. Great Atlantic’s 2017 drilling highlights from this region included 37.32% zinc equivalent over 1.27 meters core length (new vein discovery) and 7.76% zinc equivalent over 12.05 meter core length at the Elmtree 12 vein system (using metal prices at June 14, 2018) plus 0.64 g/t gold over 19.96 meter core length (new gold discovery). Drilling will focus in the Elmtree 12 vein system to provide additional data for a planned maiden resource estimate.


To view the graphic in its original size, please click here

The upcoming diamond drilling program will be conducted in the northwest region of the property in the area of the polymetallic Elmtree 12 vein system and an adjacent polymetallic vein which was discovered in 2017. These polymetallic veins contain significant levels of zinc, copper, lead and silver. The 2018 program will test these polymetallic veins along strike and depth. The Company has drilled five holes in the Elmtree 12 veins system since 2015. The 2018 drill program will provide additional data for a planned maiden resource estimate on the Elmtree 12 vein system. The Company also discovered a new gold bearing zone adjacent to the Elmtree 12 vein system during 2017 drilling, being hosted in arsenopyrite bearing meta-sedimentary rocks. Drilling is also planned to test this zone. The drilling program will be partly funded through a $40,000 grant received from the New Brunswick government under the Junior Mining Assistance Program. Highlights of previous drilling by the Company in this area include the following (as reported in News Releases of October 29, 2015, February 23, 2016, December 20, 2017 and March 2, 2018 with up-dated zinc equivalent based on metal prices at June 14, 2018:

  • Hole Ky-15-3 (Elmtree 12):    16.68% Zn, 1.11% Cu, 0.44% Pb & 152 g/t Ag / 1.80 meter core length (22.06% Zn Equiv. / 1.80 meter core length)
  • Hole Ky-15-4 (Elmtree 12):     8.68% Zn, 0.29% Cu, 0.20% Pb & 44.8 g/t Ag / 4.28 meter core length (10.23% Zn Equiv. / 4.28 meter core length)
  •  Hole Ky-17-6 (Elmtree 12):    3.54% Zn, 0.92% Cu, 0.28% Pb & 115 g/t Ag / 12.05 meter core length (7.76 % Zn Equiv. / 12.05 meter core length) & 0.64 g/t Au over 19.96 meter core length (new gold discovery).
  • Hole Ky-17-8 (2017 discovery):  18.80% Zn, 3.55% Cu, 1.16% Pb & 576 g/t Ag / 1.27 meter core length (37.32% Zn Equiv. / 1.27 meter core length)


Elmtree 12 Vein System: Polymetallic Vein in Ky-17-6


To view the graphic in its original size, please click here


Keymet Northwest Region: 2015 and 2017 Diamond Drilling Plan


To view the graphic in its original size, please click here


To view the graphic in its original size, please click here


To view the graphic in its original size, please click here

The Company’s focus since acquiring the Keymet Property has been the northwest region of the property in the area of reported polymetallic veins with most work in the area of the Elmtree 12 copper-lead-zinc-silver bearing vein system. At least seven vein occurrences with lead, zinc and +/- copper, silver and gold are reported in this region of the property in addition to the polymetallic veins reported at the historic Keymet Mine (source: New Brunswick Dept. of Energy and Resource Development Mineral Occurrence Database). The Keymet Mine operated during the mid-1950s, producing copper, lead, zinc and silver.  Production at this mine was terminated due to a fire at the site.

Significant precious metal – base metals deposits are reported within 4 km of the Keymet Property. The Elmtree gold deposits are located within 3 km west-southwest of the Keymet Property. The historic Nigadoo River Mine is located approximately 4 km south of the Keymet Property. Polymetallic massive sulfide veins were mined at the Nigadoo River Mine during the 1960s and 1970s with copper, lead, zinc and silver being produced. The N.B Dept. of Energy and Resource Development Mineral Occurrence Database reports shaft depth and production totals at this historic mine. Production during 1967 – 1971 is reported as 1.126 million tonnes at 2.2% Pb, 2.1% Zn, 0.24% Cu and 92.57 g/t Ag. Production during 1973 – 1977 (after a 2 year closure) is reported to be 0.733 million tonnes (only partial metal grades reported). The shaft is reported to at least 470 meter deep.


To view the graphic in its original size, please click here


Historic Keymet Mine (1950s)

Readers are warned that mineralization at the Elmtree gold deposits and historic Nigadoo River Mine is not necessarily indicative of mineralization on the Keymet Property.

Access to the Keymet Property is excellent with paved roads transecting the property, including a provincial highway. The property covers an area of approximately 3,400 hectares and is 100% owned by the company.

Readers are warned that historical records referred to in this News Release have been examined but not verified by a Qualified Person. Further work is required to verify that historical records referred to in this News Release are accurate.

David Martin, P.Geo., a Qualified Person as defined by NI 43-101 and VP Exploration for Great Atlantic, is responsible for the technical information contained in this News Release.

A Qualified Person has verified the 2015 and 2017 exploration data for Great Atlantic. The Qualified Person managed the 2015 and 2017 exploration programs for Great Atlantic at the Keymet Property. True thickness of these intersections is unknown at this time.

Zinc equivalent (% Zn Equiv.) values for drill hole intersections are based on the following metal prices (as of June 14, 2018): Zinc US$3,227 / tonne (US$1.4638 / lb.), Lead US$2,459 / tonne (US$1.1154 / lb.), Copper US$7,201 / tonne (US$3.2664 / lb.) and Silver US$16.95 per troy ounce. Metal recoveries of 100% were applied in the zinc equivalent calculations. The zinc equivalent calculation is as follows: Zn Eq. = 100 x ((Ag Price in grams x Ag Grade) + (Pb Price x 2204.6 x Pb Grade (%) / 100) + (Cu Price x 2204.6 x Cu Grade (%) / 100) + (Zn Price x 2204.6 x Zn Grade (%) / 100)) / Zn Price x 2204.6.


On Behalf of the board of directors


“Christopher R Anderson”


Mr. Christopher R Anderson  ” Always be positive, strive for solutions, and never give up ”

President CEO Director


604-488-3900 – Dir