Sponsor: Loncor is a Canadian gold exploration company focused on two projects in the DRC – the Ngayu and North Kivu projects, both have historic gold production. Exploration at the Ngayu project is currently being undertaken by Loncor’s joint venture partner Barrick Gold. The Ngayu project is 200km southwest of the Kibali gold mine, operated by Barrick, which produced 800,000 ounces of gold in 2018. Barrick manages and funds exploration at the Ngayu project until the completion of a pre-feasibility study on any gold discovery meeting the investment criteria of Barrick. Click Here for More Info
Another year of covering commodities and select junior mining stocks is all but done and dusted.
We’ve seen palladium prices more than double those of platinum, its sister metal, on tight supply and high demand for catalytic converters in gas-powered vehicles, as smog-belching diesel cars and trucks get phased out to meet tighter air emissions standards particularly in Europe and China.

Indonesia advanced a 2022 deadline for banning the export of mineral ores, including nickel, prompting a massive surge in the price of the stainless steel and electric-vehicle battery ingredient. In September, nickel powered past $8 a pound, before slipping back to around $6/lb after the resumption of Indonesian ore exports and weaker demand from the stainless steel industry.
Palladium and nickel are both in-demand metals for the foreseeable future, nickel for its use in batteries and stainless steel, and palladium as an important ingredient of catalytic converters found in gas-powered/ hybrid vehicles.
Zinc inventories in February fell to the point where there were less than two days worth of global consumption locked in London Metal Exchange (LME) warehouses. The paucity of the metal used to prevent rusting caused prices to spike to the highest since June 2018.
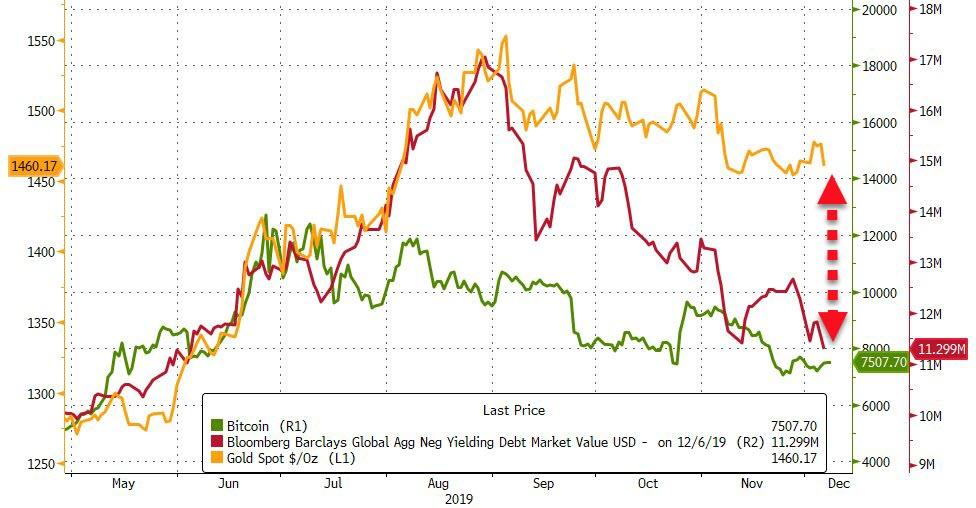
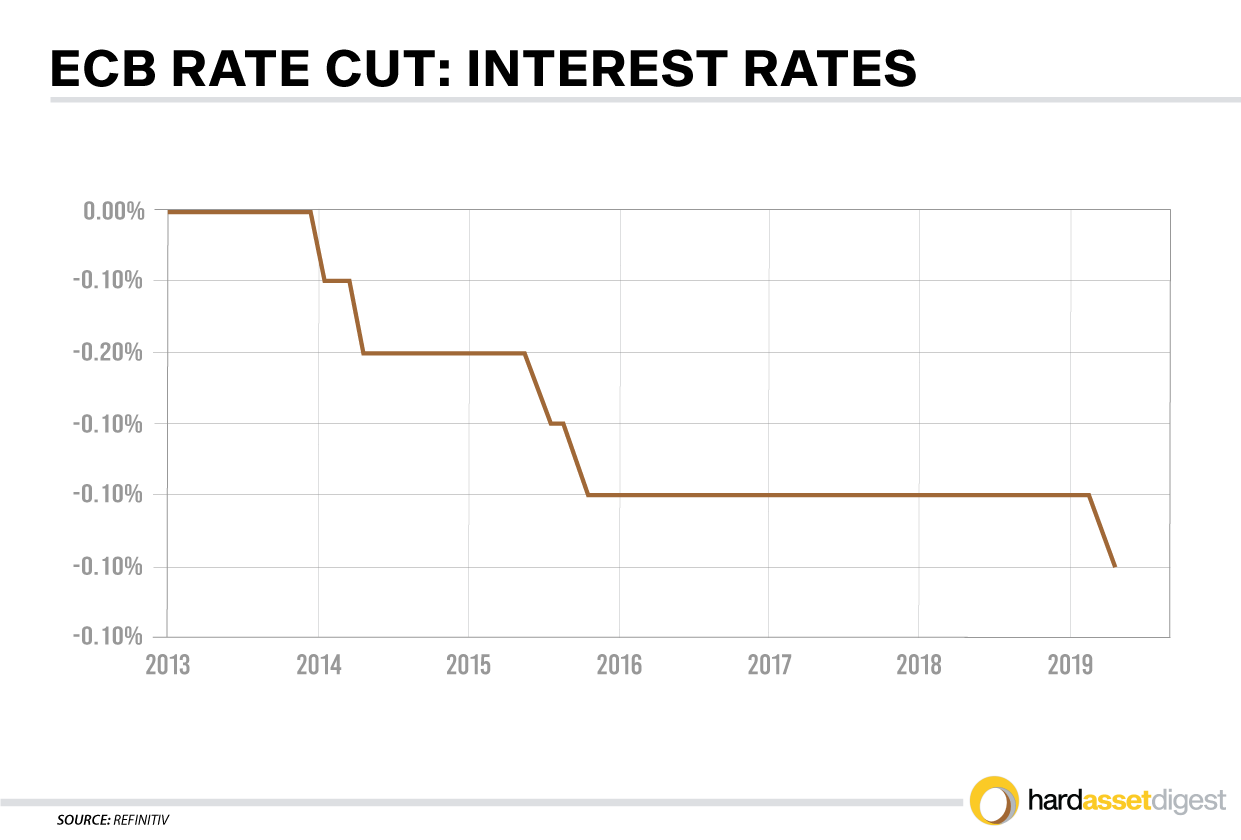
Gold started off the year around $1,300/oz, and didn’t do much for the first half on account of higher interest rates holding prices down. In July though, gold started to run when the US Federal Reserve reversed course and began cutting interest rates instead of raising them. The ECB and a number of other central banks followed suit, wanting to keep interest rates low to try and boost flagging economic growth.

The yellow metal advanced to $1,550 in early September due to a combination of factors including negative real interest rates (always good for gold), a sluggish dollar, and safe haven demand owing to US tensions with Iran, impeachment, Brexit fears, etc.
Silver followed a similar, though more bumpy trajectory. The white metal used more for industrial than investment purposes traded in a tight range (~$1.50) from January to May, bottoming out at $14.38 before jumping Sept. 4 to within two bits of $20 ($19.57).

Copper had an off year in 2018 over fears of slowing Chinese growth and the US-China trade war, but as we at AOTH have always maintained, the market fundamentals are solid. Over 200 copper mines currently in operation will reach the end of their productive life before 2035. Most of the low-hanging copper “fruit†has been picked. New copper mines will be lower-grade and farther afield, meaning higher capex and production costs.

Although copper prices suffered in the second and third quarter, things are looking up for the essential base metal needed for plumbing and wiring, power generation, communications, 5G networks, and electric vehicles, which use around four times as much copper as a conventional car or truck.
Energized by a rip-roaring fourth quarter, copper bulls are back on board. From its 52-week low in August of $2.51/lb, the red metal gained an impressive 11%, reaching a pinnacle of $2.83/lb Dec. 12, on expectations of a trade war resolution between the world’s number one and two economies, and the improved economic growth prospects that would entail. Copper has risen 7% in December alone.
Proven right
Our predictions for all of these metals have been bang on. We were right to say, as we did last January, that Commodities are the right story for 2019.
We pinned our thesis on three key points: 1/ Commodities are cyclical, and the timing is right to get in now; 2/ The US dollar is falling, and will likely continue to fall or be range-bound going forward. A resolution to the trade war between the US and China, and a looser monetary policy by the Federal Reserve (both of which are likely) will weigh on the dollar and be good for commodities; 3/ The need for infrastructure spending is not going to let up.
Close to a year later, our commodities hypothesis rings true. The dollar’s upward march in 2018 (DXY moved from 89 to 97) did stop in 2019, helping commodities priced in US dollars. The US-China trade war escalated but as we predicted, there was a resolution – not a complete trade deal – but enough hope for one, to send copper, the most important base metal, soaring in recent weeks.
At the beginning of the year, as stock markets bounced back from their awful fourth-quarter 2018, everyone thought that the US economy was roaring. We weren’t so sure, and presented evidence of a less sanguine picture including negative fallout from the trade war with China and a yield curve inversion which is a very accurate indicator of a coming recession.
The US Federal Reserve appeared to agree. Worried about low growth, globally and in the US, the Fed slammed the brakes on the interest rate hikes it started in 2015, and began lowering them in July, 2019. That immediately juiced gold and silver. Investors piled into precious metals as an alternative to near-zero or negative-yielding sovereign bonds. Looser monetary policy, check.
In later articles we showed the bullish cases for zinc, nickel and palladium.
The palladium price tripled from the start of 2016 to spring of 2019, beating gold just under a year ago for the first time in 16 years. Palladium has been in deficit for eight straight years, because of low mined output and smoking-hot demand from the auto sector. So far in 2019 it has gained 47%.
Battery companies have been developing nickel-rich batteries in two of the dominant chemistries for EVs, the nickel-manganese-cobalt (NMC) battery used in the Chevy Bolt (also the Nissan Leaf and BMW i3) and the nickel-cobalt-aluminum (NCA) battery manufactured by Panasonic/Tesla. Added to Indonesia’s on and off export ban, a demand boost from nickel’s growing use in electric-vehicle batteries, and dwindling global stockpiles, have helped support nickel prices.
According to the USGS, despite new zinc mines opening in Australia and Cuba, supply failed to keep up with consumption. Some very large zinc mines have been depleted and shut down in recent years, with not enough new mine supply to take their place. As a result, the zinc market was in deficit in 2018.
Tighter environmental restrictions in China are lessening the amount smelters can produce. National production of refined zinc in 2018 fell to just 4.53 million tonnes, the sharpest downturn since 2013. The result has been a record amount of refined zinc imported by the world’s largest metals consumer, 715,355t in 2018. The high demand in China has also pulled a lot of zinc out of LME warehouses.
In October zinc prices hit a four-month high due to falling zinc stocks – inventories in London Metal Exchange-registered warehouses plunged to 57,775 tonnes – a smidgen higher than the 50,425t in April, the lowest since the 1990s, Reuters said.
Tough market for explorers
It’s good to see we were right about so many metal markets.
Regrettably however, the valuations of mineral exploration companies have yet to follow the prices of the metals they are hunting.
Indeed the junior mining sector has been in a funk since around 2012.
The juniors’ place in the mining food chain is to provide projects to be turned into mines for larger mining companies whose reserves are running low. This is becoming a growing problem as all the low-hanging, high-grade deposit fruit has been picked. Such is the case for gold, silver, copper, palladium, zinc and nickel, all of which are encountering, or will shortly encounter, supply deficits, amid booming demand for battery metals and precious metals.
Finding the kind of grades at amounts that will make a mine profitable usually requires going farther afield or deeper – greatly adding to costs per ounce or tonne.
Here’s the problem juniors have been facing: At the same time as investment capital has been pulled out of the mining majors and mid-tiers – by investors tired of seeing falling or stagnant stock prices/ red ink balance sheets – there’s been a dearth of speculative capital flowing into exploration companies.
The ascendance of index funds has also made it harder for juniors to attract money, because they are too small to be in the funds that these vehicle track.
According to a 2019 report by PDAC – the association that puts on the annual mining show in Toronto – and Oreninc, a junior financing tracker, equity financing in 2018 was 35% less than in 2017 – a decade-low $4.1 billion.
A good chunk of that cash went to marijuana stocks, as dozens of companies emerged to take advantage of the pot legalization bill passed by the Canadian federal government. Whereas weed stock IPOs attracted $491.1 million in investment dollars in 2018, mining IPOs only accounted for $51.6 million, a startling drop from the $830 million in 2017.
That’s a lot of speculative capital pulled out of resource stocks. However it’s not all gloom and doom, according to TD Securities mining investment bankers, who say “current market conditions and historical precedents make them optimistic generalist investors will return in greater numbers to mining stocks,†Bloomberg reported:
“The current market is reminiscent of the late 90’s and early 2000’s, [TD Securities’ Deputy Chairman Rick] McCreary says. At the time, investors had low interest in mining, and companies found it hard to raise capital. That was followed by waves of consolidation and a mining bull run. A similar trend may be building as this ‘period of consolidation’ rolls on.â€
Gold M&A
As far as that goes, mining companies, especially in the gold space, have realized since the vicious 2012-16 bear market, they have cut as much as they can and the next step is to bring assets and companies together. On top of that, the top gold miners are running out of reserves, and are looking to replace them with high-margin projects that have the right combination of grade, size and infrastructure.
This explains Barrick combining with South Africa’s Randgold, the Barrick-Newmont joint venture in Nevada, the fusing of Newmont and Goldcorp, a $1-billion deal for Lundin Mining to acquire a Brazilian copper-gold mine from Yamana Gold, Newcrest’s 70% purchase of Imperial Metals’ Red Chris mine in British Columbia, and other recent examples of gold mining M&A.
Among December’s gold deals are Zijin Mining’s cash purchase of Continental Gold’s Buriticá project in Colombia, for CAD$1.3 billion; and a $770 million merger between two mid-tier gold miners, Equinox Gold and Leagold Mining. The latter arrangement will keep the Equinox name and create a company valued at $1.75 billion with six mines spread across Brazil, Mexico and the United States.
Junior resource M&A?
The goal of every junior resource investor is for the company(ies) they are invested in to get bought out, resulting in a 5, 10, even 20-bagger.
The question is, will the current round of mergers and acquisitions at the major and mid-tier level trickle down to the juniors? PwC appears hopeful. In its 2019 report ‘Shifting Ground’ the mining consultancy states,
The heightened level of deal activities, most of which have been in the gold sector, may well spark further moves among intermediate players seeking to grow into multi-project companies. A new phase of industry consolidation could pave the way for more exploration and mine development and boost investor interest and activity.
Another optimistic opinion comes from Tom Palmer, chief operating officer at Newmont, who told the Wall Street Journal that smaller players are waiting to see what the bigger miners sell once they have completed their mergers before they start their own M&A.
“Fast forward two or three years, there will be countless more†mergers, he said.
In fact we are already starting to see this happening. Nevada has witnessed the return of junior gold explorers, and majors, after a lull in activity between 2012 and 2016. According to an industry report, exploration in Nevada increased by 15% in 2017, with 19,040 new claims. The tide has continued to turn in mining’s favor, with 198,337 active claims as of January, 2019 – 7% more than in 2018.
In 2018 Idaho-based Hecla Mining snapped up Klondex Mines for US$462 million, delivering three more Nevada properties – Fire Creek, Midas and Hollister – to Hecla’s stable of mines and adding 162,000 gold-equivalent ounces to its annual production.
Also in Nevada, last year Alio Gold paid Rye Patch Gold $128 million for the Vancouver-based company and its past-producing Florida Canyon mine.
The 2019 creation of Nevada Gold Mines (the Barrick-Newmont JV) has piqued the interest of other companies looking to discover and develop new ounces in the golden state. Major miners with new projects include AngloGold Ashanti, Coeur Mining and Kinross Gold. For the details read Getchell’s Gold
And for an inspiring story of junior mining success in Canada, look no further than Great Bear Resources. Working the historic Red Lake gold camp in Ontario, Great Bear’s drills discovered the “LP Fault Zone†this past May. That eureka moment, the realization that most of the gold on its property is structurally controlled, prompted a massive 90,000m drill program aimed at identifying the parameters. The discovery of three new gold zones with high-grade intercepts, along with the earlier nearby Hinge-Dixie Limb discoveries, caught the market’s attention; within 18 months, Great Bear’s stock catapulted 2,000%.
Conclusion
I firmly believe that 2019 has been a pivotal year for junior mining. Coming out of 2018’s slump in several commodities, due mostly to the uncertainty associated with the US-China trade war, this year we saw very strong performances from gold, silver, copper, palladium, nickel and zinc – having correctly predicted price corrections for each.
While it’s disappointing not to see a rising tide of junior miner stock prices to accompany these bullish calls, we continue to believe.
After all, we want to own the cheapest most in demand metals we can find to reap the maximum coming rewards. That means buying it while it’s still in the ground.
The fact is junior resource companies – the owners of the world’s future mines – are on sale. If you like their management teams, their projects and their plans for 2020, perhaps now is the time to be acquiring a position.
Courtesy of Richard (Rick) Mills:
subscribe to my free newsletter
aheadoftheherd.com
Ahead of the Herd Twitter
https://aheadoftheherd.com/Newsletter/2020/Will-2020-be-junior-minings-year.html