Agoracom Blog Home

Author Archive

Loncor $LN.ca Increases Mineral Resources By 49% To 2.5 Million Ounces At Its Imbo Project In The Ngayu Greenstone Belt, D.R. $ABX.ca $TECK.ca $RSG $NGT.to $GOLD $NEM

Posted by AGORACOM at 8:41 AM on Friday, April 17th, 2020
This image has an empty alt attribute; its file name is Loncor-Small-Square.png
  • Compared to the inferred mineral resources of 1.675 million ounces of gold (20.78 million tonnes grading 2.5 g/t Au) outlined in January 2014
  • On three separate deposits, Adumbi, Kitenge and Manzako at Imbo, inferred mineral resources have now increased by 49% to 2.5 million ounces of gold (30.65 million tonnes grading 2.54 g/t Au)
  • Total mineral resources at Loncor’s properties in the Ngayu belt now stand at 3.05 million ounces of inferred mineral resources

TORONTO, April 17, 2020 (GLOBE NEWSWIRE) — Loncor Resources Inc. (“Loncor” or the “Company“) (TSX: “LN”; OTCQB: “LONCF”) is pleased to announce a 49% increase in mineral resources at its Imbo Project (Loncor 76.29%) in the D.R. Congo.

Compared to the inferred mineral resources of 1.675 million ounces of gold (20.78 million tonnes grading 2.5 g/t Au) outlined in January 2014 by independent consultants Roscoe Postle Associates Inc. (“RPA”) on three separate deposits, Adumbi, Kitenge and Manzako at Imbo, inferred mineral resources have now increased by 49% to 2.5 million ounces of gold (30.65 million tonnes grading 2.54 g/t Au), this increase coming from the Adumbi deposit.  This assessment was undertaken by the Company’s independent geological consultants Minecon Resources and Services Limited (“Minecon”). The updated estimate for Adumbi was based on a review of the Adumbi deposit including remodelling, grade capping and considering the CIM requirement for mineral resources to have “reasonable prospects for economic extraction”. 76.29% of this updated gold resource is attributable to Loncor via its 76.29% interest in the Imbo Project.

Combined with the Company’s Makapela Project (100%) (see Figure 1), total mineral resources at Loncor’s properties in the Ngayu belt now stand at 3.05 million ounces of inferred mineral resources (33.87 million tonnes grading 2.80 g/t Au) plus 0.614 million ounces of indicated mineral resources (2.205 million tonnes grading 8.66 g/t Au ). 

Commenting on today’s inferred mineral resource increase on the Imbo Project, Loncor’s President Peter Cowley said: “We are very encouraged by the significant increase in mineral resources at the Adumbi deposit, which was developed from exploration conducted during the period 2014-17, following on from the recommendations from the independent RPA study in 2014.  We now have a clear strategy going forward to increase the mineral resources on the Imbo Project by undertaking additional drilling and advancing the project up the value curve by initiating a Preliminary Economic Assessment on the Adumbi deposit.  Significant potential still exists at Adumbi to increase and upgrade mineral resources within the open pit as well as underground potential since the mineralization remains open at depth.”

As outlined in the Company’s press release dated January 28, 2020, Loncor has been focussing on the Adumbi deposit (see Figures 2 and 3), where Minecon had identified significant resource upside potential from additional exploration evaluation, including drilling that was undertaken during 2017.  Much of this exploration work was undertaken following on from the recommendations made by RPA in their 2014 NI 43-101 technical report and included:

  • Additional Drilling
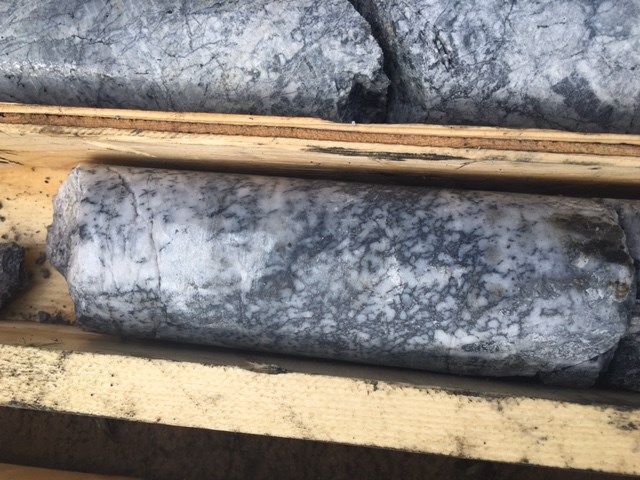
    RPA recommended additional drilling at Adumbi to test the down dip/plunge extent of the mineralization. In 2017, four deeper core holes (see Figures 3 and 8) were drilled below the previously outlined RPA inferred resource over a strike length of 400 metres and to a maximum depth of 450 metres below surface. All four holes intersected significant gold mineralization in terms of widths and grade and are summarised below:
BoreholeFrom(m)To(m)Intercept
Width(m)
True
Width(m)
Grade (g/t) Au
SADD50434.73447.4212.6910.675.51
      
SADD51393.43402.729.296.544.09
      
SADD52389.72401.8712.157.013.24
 419.15428.759.605.545.04
      
SADD53346.36355.639.275.703.71
 391.72415.1723.4514.436.08

Due to funding constraints, no follow up drilling was undertaken at the Adumbi deposit after 2017.

  • Survey and Georeferencing
    All the Adumbi drill hole collars, trenches and accessible adits and adit portals were accurately surveyed and the data appropriately georeferenced.  In addition, all accessible underground excavations and workings were accurately surveyed.
  • Re-logging of All Drill Holes
    All boreholes (153 holes totalling 33,651 metres) from Adumbi were systematically relogged and all data was put on (Strata Logs software) including core orientations.  The re-logging of drill holes defined the presence of five distinct geological domains in the central part of the Adumbi deposit where the BIF (Banded Iron Formation) unit attains a thickness of up to 130 metres (see Figures 3 and 4).  From northeast to southwest these are:
  1. Hanging wall schists: dominantly quartz carbonate schist, with interbedded carbonaceous schist.
  2. Upper BIF Sequence: an interbedded sequence of BIF and chlorite schist, 45 to 130 metres in thickness.
  3. Carbonaceous Marker: a distinctive 3 to 17 metre thick unit of black carbonaceous schist with pale argillaceous bands.
  4. Lower BIF Sequence: BIF interbedded with quartz carbonate, carbonaceous and/or chlorite schist in a zone 4 to 30 metres in thickness.
  5. Footwall Schists: similar to the hanging wall schist sequence.

In the central part of the Adumbi deposit, three main zones of gold mineralization are present (see Figures 5 and 6).  These include the following mineralization:

  1. within the Lower BIF Sequence;
  2. in the lower part of the Upper BIF Sequence.  Zones 1 and 2 are separated by the Carbonaceous Marker, which is essentially unmineralized; and
  3. a weaker zone in the upper part of the Upper BIF Sequence.

There is a higher-grade zone of gold mineralization termed the Replaced Rock Zone (“RP Zone”) associated with alteration and structural deformation that has completely destroyed the primary host lithological fabric.  The RP Zone occurs in the lower part of the Upper BIF package and in the Lower BIF package, and transgresses the Carbonaceous Marker, located between the Upper and Lower BIF packages, both along strike and down dip (see Figures 3 and 4).

  • Relative Density (“RD”) Measurements
    The increase in the sample population coupled with the application of a more rigid RD determination procedure based on recommendations from the RPA resource study, indicates that the new RD measurements from both mineralized and unmineralized material and from the various material types and lithologic units have improved the confidence in the relative RD determination to be applied to any resource estimates. Relative to the 6 oxide RD measurements used for tonnage estimation in the RPA model, 297 oxide RD measurements within the mineralized domain were undertaken during the review work. For the transition and fresh material, equal number of determinations relative to the previous RD sample volumes were undertaken with the review process employing more rigid RD determination procedures.  

Table 1 below indicates significate positive variance between the previous model RD and the reviewed work for the oxide and transition materials.

Table 1: Summary of Previous and Updated Mineralised Average RD Measurements for Adumbi Deposit

Material
Type
RD used in
Previous RPA Model
RD Determinations Used
in Current Model
RD Variance
(%)
Oxide1.802.4536.1
Transition2.202.8228.2
Fresh3.003.051.7
  • Oxidation and Fresh Rock Surfaces
    The re-logging of the core as per the RPA recommendations identified major differences between the depths of Base of Complete Oxidation (BOCO) and Top of Fresh Rock (TOFR), and the depths used by RPA in the 2014 model.  In the RPA model, the BOCO was negligible and the TOFR corresponded approximately to the re-logged BOCO.  The deeper levels of oxidation that were observed during the re-logging exercise have had positive implications with respect to ore type classification and associated metallurgical recoveries, mining and processing cost estimates.
  • Adit Sampling and Georeferencing
    Following the accurate surveying of the 10 historical adits and appropriately georeferencing, the 796 adit samples (1,121 metres in total) when applied have positive implications on the data spacing and classification of mineral resources at the Adumbi deposit.
  • Quality Control and Quality Assurance
    Assessment of assay standards and blanks of the Adumbi deposit by RPA indicated that 1,014 samples within some batches failed QC and were identified for re-assay. A total of 616 pulps and 382 quarter core samples were retrieved for re-assay. The samples were submitted to the SGS Laboratory (which is independent) in Mwanza, Tanzania in November 2014, together with international reference material from Rocklabs (8 per 100 samples) and blanks (4 per 100 samples). This was undertaken to ensure the samples passed internal QA/QC analytical procedures.

    For the post 2014 drilling campaign, drill cores for assaying were taken at a maximum of one metre intervals and were cut with a diamond saw with one-half of the core placed in sealed bags by company geologists and sent to the SGS Laboratory in Mwanza.  The core samples were then crushed at the laboratory down to minus 2 mm and split with one half of the sample pulverized down to 90% passing 75 microns. Gold analyses were carried out on 50g aliquots by fire assay. In addition, checks assays were also carried out by the screen fire assay method to verify high grade sample assays obtained by fire assay. Internationally recognized standards and blanks were inserted as part of the internal QA/QC analytical procedures.

    Minecon has reviewed the quality of all the assay data used for the modelling and estimation of resources to ensure that they all passed the Company’s internal QA/QC criteria.
  • Gold Price
    A gold price of US$1,200 per ounce was used in 2014 for the RPA study. To reflect more recent market conditions, a gold price of US$1,500 per ounce has been used in Minecon’s resource determinations.

In summary, this additional 2014 to 2017 information resulted in better quantification with improved confidence in updating the geological model for grade interpolation and pit optimisation studies to determine mineral resources for the Adumbi deposit.

Geological Modelling and Grade Estimation
The Adumbi 3-Dimensional model was constructed by Minecon in collaboration with on site geologists using cross sectional and horizontal flysch plans of the geology and mineralization (see Figures 3 and 4) and was used to assist in the constraining of the 3-D geological model.  The mineralization model was constrained within a wireframe at 0.5 g/t Au cut-off grade (see Figures 5 and 6).  Grade interpolation was undertaken using:

  • 2 metre sample composites capped at 18 g/t Au to improve the reliability of the block grade estimates.
  • Ordinary Kriging to interpolate grades into the block model.
  • Relative densities of 2.45 for oxide, 2.82 for transitional and 3.05 for fresh rock were applied to the block model for tonnage estimation.

Pit Optimisation Parameters
To constrain the depth extent of the geological model and any mineral resources, an open pit for the Adumbi deposit was constructed based on the following pit optimisation parameters:

  • A long-term gold price of US$1,500 per ounce.
  • Block size: 8 metres x 8 metres x 8 metres.
  • A two-metre minimum mining width and a maximum of four metres of internal waste was applied.
  • Mining dilution of 100% of the tonnes at 95% of the grade.
  • Ultimate slope angle of minus 45 degrees.
  • Metallurgical recoveries of 95% for oxide and transitional material and 90% for fresh rock (in the RPA study a fresh rock metallurgical recovery of 95% was used while Minecon reduced this to a more conservative 90% even though no additional metallurgical testwork was undertaken after the RPA study).
  • Average mining cost of US$2.5/t mined.
  • Mineral resources were estimated at a block cut-off grade of 0.9 g/t Au constrained by a Whittle pit with processing and G&A costs of US$30/t.
  • Transport of gold and refining costs equivalent to 4.5% of the gold price.
  • No additional studies on depletion by artisanal activity was undertaken since the 2014 RPA study and the same total amount of material was used by Minecon.

The results of the Adumbi pit optimisation (see Figure 7) indicated an inferred mineral resource within the pit of 2.19 million ounces of gold (28.97 million tonnes at 2.35 g/t gold) (see Table II below).

Mineral Resources
Within the US$1,500 pit shell (Figure 7), the following is classified as inferred mineral resource at the Adumbi deposit: 

Table II: Inferred Mineral Resource for the Adumbi Deposit (with an effective date of April 17, 2020)

Material TypeTonnage
(Tonnes)
Grade
(g/t Au)
Contained Gold
Ounces
Oxide3,820,0002.44300,000
Transitional3,320,0002.69290,000
Fresh21,820,0002.281,600,000
TOTAL28,970,0002.352,190,000

Note: Numbers may not add up due to rounding.

The additional drilling information, the higher RD determinations and the increased gold price, have contributed significantly to the increased mineral resources of the Adumbi deposit with improved confidence.

In summary for the Imbo Project, the inferred mineral resource for the Adumbi, Manzako and Kitenge deposits now totals 2,503,000 ounces of gold (30,650,000 tonnes grading 2.54 g/t Au) and is summarised in Table III below.  76.29% of this inferred mineral resource is attributable to Loncor via its 76.29% interest in the Imbo Project.

Table III: Inferred Mineral Resource for the Imbo Project (with an effective date of April 17, 2020)

DepositTonnage
(Tonnes)
Grade
(g/t Au)
Contained Gold
Ounces
Adumbi28,970,0002.352,190,000
Kitenge910,0006.60191,000
Manzako770,0005.00122,000
TOTAL30,650,0002.542,503,000

Note: Numbers may not add up due to rounding.

Additional Resource Potential and Recommendations for Further Work
There is significant additional resource potential within the Imbo project permit:

  • At the Adumbi deposit, the gold mineralization is still open at depth and, subject to securing the necessary financing, the drilling of an additional 12 core holes (7,000 metres) has the potential to add and upgrade mineral resources within the US$1,500 pit as well as outline potential underground resources below the pit (see Figure 8).  After this proposed drilling program has been completed, additional drilling may be undertaken (subject to securing the necessary financing) before a Preliminary Economic Assessment is initiated to include additional mineral resource determinations, metallurgical testwork, open pit and potential underground studies, metallurgical plant processing, infrastructural, environmental and economic studies.
  • At the Kitenge and Manzako deposits, additional drilling may also be undertaken (subject to securing the necessary financing) to further define and increase the inferred mineral resources at these deposits. 
  • Ongoing exploration including gridding, soil sampling, trenching and channel sampling is planned to be undertaken at the Imbo East prospect in order to generate potential drill targets.

An independent National Instrument 43-101 technical report relating to the mineral resource estimates on the Imbo Project reported in this press release will be filed on SEDAR and EDGAR within the period required by National Instrument 43-101.

Qualified Person
Mr. Daniel Bansah, Chairman and Managing Director of Minecon, is the “qualified person” (as such term is defined in National Instrument 43-101) who is responsible for the mineral resource estimates and other technical information disclosed in this press release.  Mr. Bansah has reviewed and approved the contents of this press release.

About Loncor Resources Inc.
Loncor is a Canadian gold exploration company focussed on the Ngayu Greenstone Belt in the Democratic Republic of the Congo (the “DRC”).  The Loncor team has over two decades of experience of operating in the DRC.  Ngayu has numerous positive indicators based on the geology, artisanal activity, encouraging drill results and an existing gold resource base.  The area is 200 kilometres southwest of the Kibali gold mine, which is operated by Barrick Gold (Congo) SARL (“Barrick”).  In 2019, Kibali produced record gold production of 814,000 ounces at “all-in sustaining costs” of US$693/oz.  Barrick has highlighted the Ngayu Greenstone Belt as an area of particular exploration interest and is moving towards earning 65% of any discovery in 1,894 km2 of Loncor ground that they are exploring.  As per the joint venture agreement signed in January 2016, Barrick manages and funds exploration on the said ground at the Ngayu project until the completion of a pre-feasibility study on any gold discovery meeting the investment criteria of Barrick.  In a recent announcement Barrick highlighted six prospective drill targets and are moving towards confirmation drilling in 2020. Subject to the DRC’s free carried interest requirements, Barrick would earn 65% of any discovery with Loncor holding the balance of 35%.  Loncor will be required, from that point forward, to fund its pro-rata share in respect of the discovery in order to maintain its 35% interest or be diluted.

In addition to the Barrick JV, certain parcels of land within the Ngayu project surrounding and including the Makapela and Adumbi deposits have been retained by Loncor and do not form part of the joint venture with Barrick. Barrick has certain pre-emptive rights over the Makapela deposit.  Loncor’s Makapela deposit (which is 100%-owned by Loncor) has an indicated mineral resource of 614,200 ounces of gold (2.20 million tonnes grading 8.66 g/t Au) and an inferred mineral resource of 549,600 ounces of gold (3.22 million tonnes grading 5.30 g/t Au).  Adumbi and two neighbouring deposits hold an inferred mineral resource of 2.5 million ounces of gold (30.65 million tonnes grading 2.54 g/t Au), with 76.29% of this resource being attributable to Loncor via its 76.29% interest in the project.  

Resolute Mining Limited (ASX/LSE: “RSG”) owns 26% of the outstanding shares of Loncor and holds a pre-emptive right to maintain its pro rata equity ownership interest in Loncor following the completion by Loncor of any proposed equity offering. 

Additional information with respect to Loncor and its projects can be found on Loncor’s website at www.loncor.com. 

Gold’s Powerful Rally Brings US$1,800 Into View SPONSOR: Labrador Gold $LAB.ca $RIO.ca $WHM.ca $SIC.ca $NXS.ca

Posted by AGORACOM at 2:17 PM on Thursday, April 16th, 2020

SPONSOR: Labrador Gold – Two successful gold explorers lead the way in the Labrador gold rush targeting the under-explored gold potential of the province. Exploration has already outlined district scale gold on two projects, including a 40km strike length of the Florence Lake greenstone belt, one of two greenstone belts covered by the Hopedale Project. Recently acquired 14km of the potential extension of the new discovery by New Found Gold’s Queensway project to the south. Click Here for More Info

Gold extended its rally to hit the highest in more than seven years on concern that the coronavirus pandemic will have a deep effect on the global economy, hammering corporate earnings while supercharging demand for havens.

Futures in New York moved closer to US$1,800 an ounce, a level last seen in 2011. Spreads between futures and spot prices remain wide, suggesting thinner liquidity, which is further exacerbating price dislocation.

“Liquidity conditions are challenging and market participants are understandably cautious,” Joni Teves, a strategist at UBS Group AG, said Tuesday in a note. “Gold’s journey has been quite bumpy so far, but given the macro backdrop we think the destination remains higher.”

Bullion has soared this year as the global heath crisis tipped economies toward recession and spurred central banks to launch huge stimulus measures. Since last month’s wave of forced selling, as equities sank, gold has staged a recovery.

Comex gold futures for June delivery climbed as much as 1.6 per cent to US$1,788.80 an ounce, the highest for a most-active contract since October 2012. The metal rose 0.4 per cent to settle at US$1768.90 at 1:30 p.m. in New York. Spot gold was more than US$30 cheaper at US$1,737.20, with the spread a feature of trading in recent weeks amid physical market disruptions.

Futures pared earlier gains as “there’s a little bit of a move on volatility, and equities turned around a bit, and what we might be seeing is that people are locking in what they’ve gained on gold here,” Bart Melek, head of commodity strategy at TD Securities, said by phone.

Overall, gold still has room to run, according to Hans Goetti, founder and chief executive officer of HG Research.

“What’s happening here is that the Fed is expanding its balance sheet and every other central bank in the world is doing the same,” he told Bloomberg TV. “What you’re looking at is massive currency debasement in the long term. That’s the major reason why gold is higher, and I would think that over the next few weeks or months, we’re probably going to retest the high that we saw in 2011.”

The Federal Reserve’s massive U.S. monetary program and the fiscal stimulus “could see long-end rates rise during the recovery phase, but not without rising inflation expectations, which should keep real rates suppressed,” TD Securities analysts said in an emailed note. “In this context, we suspect that investment demand for gold will continue to rise as capital seeks shelter from a long-term environment in which real rates are negative.”

Negative real rates boosts the appeal of non-interest-bearing bullion.

Gold’s latest upswing has come even as risk sentiment received a boost after China’s trade data beat estimates, while the pace of coronavirus infections has slowed in some countries, with the focus shifting toward how lockdowns can be eased. President Donald Trump said he has “total” authority to order states to relax social distancing and reopen their economies.

Worldwide holdings in bullion-backed exchange-traded funds have ballooned to a record on rising demand, with investors seeking additional portfolio protection. On Monday, volumes in SPDR Gold Shares, the largest such fund, surged above 1,000 tons to the highest since mid-2013.

In other precious metals, silver futures also advanced on the Comex, while platinum and palladium gained on the New York Mercantile Exchange.

SOURCE: https://www.bnnbloomberg.ca/gold-s-powerful-rally-brings-us-1-800-into-view-1.1421080

Affinity Metals Reports Drill Results for Regal Project with New Silver Discovery of 11.10 m of 143.29 g/t Silver $AAF.ca $SII.ca $TUD.ca $GTT.ca $AMK.ca $OSK.ca $RKR.ca

Posted by AGORACOM at 9:16 AM on Thursday, April 16th, 2020
This image has an empty alt attribute; its file name is Affinity_Metals_Corp_Logo.png

Affinity Metals Corp. (TSXV: AFF) (“Affinity”) (“the Corporation”) is pleased to release assay results from the late fall drill program conducted on the Regal property encompassing 8,800 hectares of the northern end of the prolific Kootenay Arc approximately 25 km northeast of Revelstoke, British Columbia, Canada.

Along with numerous high grade intercepts in multiple holes, a significant new silver discovery was made in the ALLCO area with drill hole #10 intersecting 11.10 meters of 143.29 g/t silver including 0.55 meters of 2612.0 g/t silver. This intersection also carried high grade zinc and lead with some copper.

A total of 1,846.35 meters of diamond drilling was completed with 21 holes being drilled.

The drilling was divided over two separate target areas with 10 holes from two separate drill pads allocated to testing two areas within a graphitic argillite/limestone contact in the ALLCO area. Mineralized intersections encountered within the ALLCO area drill core consisted mostly of argentiferous galena, sphalerite and tetrahedrite hosted within quartz veins and breccias along a northwest-southeast fault that separates the limestones from the argillites.

A further 11 preliminary confirmation holes were drilled from a single drill pad designed to begin testing the underground structure associated with the historic 1971 resource (pre NI43-101 and therefore not compliant) reported for the past producing Regal/Snowflake mines. The Regal mine is located within moderately to gently, westerly dipping, graphitic phyllites/argillites of the lower Index Formation. Mineralization, hosted in quartz veins concordant with host rocks, consists of pyrite, galena, sphalerite, and locally with scheelite (lower levels), stannite (upper levels), and trace chalcopyrite/tetrahedrite throughout. Sulphides occur either as disseminations in the quartz, or as massive pods or bands parallel with slatey partings.

Robert Edwards, CEO of Affinity stated: “We are extremely encouraged to see such positive assay results from the 2019 drilling, our first drill program on the property. Our expectations were that the assays would show strong mineralization given what we have seen from our prior surface sampling program and the historical production grades, but to find this new 11 meter silver zone is truly exciting! These results set the backdrop for our 2020 exploration program which will target not only this new silver discovery but even more importantly, the two very large anomalies identified by the geophysics that may be the core deposits associated with all this surrounding mineralization. 2020 should be a very exciting year for Affinity.”

Significant intervals from the drill program are presented below:

ALLCO
Hole
No.
From
(m)
To
(m)
Interval
(m)
Ag
g/t
Cu
%
Pb
%
Zn
%
RP-19-0128.6729.090.42106.000.060.330.01
RP-19-01105.00106.001.0028.720.100.050.09
RP-19-0348.7048.770.07171.000.051.240.46
RP-19-0438.6441.002.36214.130.142.602.67
including38.6440.321.6862.550.080.250.16
and40.3241.000.68588.630.308.418.87
RP-19-0540.2543.002.7529.740.020.020.01
RP-19-0544.7545.510.7650.800.020.251.64
RP-19-0556.3356.780.4526.160.000.890.91
RP-19-0639.2643.294.0329.530.080.137.38
including42.0042.620.6217.900.040.024.12
and42.6243.290.67130.000.400.4140.14
RP-19-0649.7250.570.85129.020.030.040.32
RP-19-0738.3739.270.90182.000.130.300.32
RP-19-0743.7046.512.8149.210.020.340.78
including45.1046.251.1591.920.020.711.68
RP-19-0756.6157.420.8198.600.012.422.45
RP-19-0845.4445.940.5020.640.000.460.01
RP-19-0847.8452.274.43111.960.090.230.29
including49.2451.121.88238.200.190.510.50
RP-19-0857.5158.521.0145.700.000.050.03
RP-19-0867.8668.050.1985.240.021.210.11
RP-19-0882.4682.660.2011.390.000.320.01
RP-19-0884.8285.020.20568.000.550.080.18
RP-19-0944.4146.622.2128.700.020.150.13
RP-19-0946.6248.702.0831.700.020.471.12
RP-19-0948.7049.761.066.880.000.140.32
RP-19-1061.0072.1011.10143.290.040.620.50
including61.0067.816.81230.840.070.940.66
including61.0061.310.31122.000.034.185.04
and62.7263.270.552612.000.666.002.89
REGAL
Hole
No.
From
(m)
To
(m)
Interval
(m)
Ag
g/t
Cu
%
Pb
%
Zn
%
RP-19-119.149.380.2413.240.000.730.03
RP-19-1111.1415.794.6512.230.000.320.36
including15.3515.790.4452.470.001.202.89
RP-19-1158.4459.851.4124.850.010.770.25
RP-19-127.327.620.3040.020.000.690.02
RP-19-1211.2011.800.6039.640.000.950.25
RP-19-1211.9313.021.0935.900.010.890.79
RP-19-1213.8017.773.9726.000.000.590.25
including13.816.172.3739.780.000.900.30
RP-19-1260.1860.700.5212.280.000.070.96
RP-19-1313.7617.413.6525.380.000.580.48
including16.9117.410.50102.210.001.870.28
RP-19-1318.5719.050.4815.440.010.710.22
RP-19-1410.8911.180.2960.810.021.241.64
RP-19-1412.2812.840.5619.830.000.250.21
RP-19-1412.9913.340.3513.280.030.540.47
RP-19-1413.4913.820.3320.020.000.350.96
RP-19-1413.9314.220.2933.000.001.320.53
RP-19-1416.0416.310.2743.860.001.651.01
RP-19-1514.8815.380.5012.370.000.380.68
RP-19-1611.3011.880.5831.230.010.910.55
RP-19-1613.0713.800.7341.880.000.920.46
RP-19-1614.4815.320.8423.840.000.620.44
RP-19-1616.8817.800.9232.150.001.400.56
RP-19-1628.1328.290.164.990.020.022.21
RP-19-177.017.160.151360.000.0119.670.21
RP-19-1710.9411.690.7562.320.002.780.19
RP-19-1714.6415.470.8319.820.000.520.36
RP-19-1812.1213.411.2948.310.002.660.53
including12.1212.940.8270.500.004.020.53
RP-19-1815.9718.532.5613.020.000.331.43
including15.9717.411.4412.810.010.372.52
RP-19-1819.9220.520.6027.270.041.150.76
RP-19-196.007.001.0068.420.002.380.22
including6.006.300.30134.000.017.130.13
RP-19-1912.1317.685.5513.350.000.460.39
including15.8217.681.8630.830.001.170.78
RP-19-1929.9130.420.5122.880.021.220.89
RP-19-206.156.650.5046.470.011.750.13
RP-19-207.608.320.7233.370.000.500.19
RP-19-2012.0112.680.6721.510.010.670.49
RP-19-2015.2716.361.0918.630.000.480.43
RP-19-2017.2918.681.3910.520.000.340.62
RP-19-2028.0831.173.0958.780.000.350.33
including29.5230.220.70214.000.000.340.19
RP-19-219.059.560.5137.450.000.580.02
RP-19-2112.9813.820.8417.290.010.470.79
RP-19-2115.8917.271.3839.770.001.550.70
including15.8916.570.6876.500.003.070.31
and17.0017.270.271.840.000.062.27
RP-19-2130.4030.540.1446.830.000.310.16
RP-19-2131.8232.821.0061.100.013.391.49
RP-19-2172.0172.260.2577.110.000.620.02

Note: True widths are presently unknown.

Additional assay work is presently being conducted regarding Tin results in the drill core. Those results will be released once received and interpreted.


To view an enhanced version of this graphic, please visit:
https://orders.newsfilecorp.com/files/5458/54511_53b9ae91d42028a8_001full.jpg


To view an enhanced version of this graphic, please visit:
https://orders.newsfilecorp.com/files/5458/54511_53b9ae91d42028a8_002full.jpg

Photo description: Photos of 11.10 meter silver discovery intersection in Hole #10. Host rock is a limestone dissolution breccia/dolomitization breccia with weak to moderate silicification overprinting. Flooding this is milky quartz which hosts wispy veinlets of galena and blebby sphalerite at intersections of these or other veinlets.

As previously reported, the Corporation received assay results for 22 rock samples collected from surface outcrops in September 2019 from the Black Jacket and ALLCO areas of the property. Of the 22 grab samples collected, the majority contained bonanza grade silver, zinc, and lead with many samples reaching assay over-limits. The over-limit results for zinc and lead are reported in the table below (italicized) beside the original assay values. Assay values for tin, including high grade samples 11, 14 and 20 which were over-limit in the original assay report, are also presented in the last column of the table.

Sample NumberSample TypeSilver
g/t
Copper
%
Zinc
%
Lead
%
Gold
g/t
Tin
ppm
ALC19CR01grab0.0350000.4
ALC19CR02grab1300.41518.20>20.0 (35.69)0.7046.1
ALC19CR03grab120.232.034.9840.022.4
ALC19CR04grab131.089.026.1022.661.1
ALC10CR05grab16.7.295.060.0130.090.4
ALC19CR06grab74.9.144>30.00 (34.97).0590.282.6
ALC19CR07grab10.05.310.086.0290.040.5
ALC19CR08grab1870.49524.5>20.0 (31.90)1.85189.5
ALC19CR09grab88.1.077>30.00 (39.98)1.880.0832
ALC19CR10grab1545.17826.7>20.0 (28.67)0.68373
ALC19CR11grab2360.36616.80>20.0 (43.67)0.11900
ALC19CR12grab3700.6241.645>20.0 (71.14)3.14273
ALC19CR13grab964.71617.3017.50.11386
ALC19CR14grab3530.3501.945>20.0 (59.54)1.571600
ALC19CR15grab3670.0261.895>20.0 (77.01)0.33205
ALC19CR16grab1790.1075.28>20.0 (52.77)0.37146.5
ALC19CR17grab751.0696.4518.050.45107
ALC19CR18grab1065.718.178.5140.107.6
ALC19CR19grab2510.2995.58>20.0 (70.63)0.06167
ALC19CR20grab44102.2726.40>20.0 (21.56)5.684500
ALC19CR21grab47.5.177.048.0921.788.8
ALC19CR22grab87.7.095.011.0474.792.9

Property History & Background

The Regal Project hosts several past producing small-scale historic mines including the Regal Silver.

The property also hosts numerous promising mineral occurrences. From the historic records it appears that most, and perhaps all, of the known mineralized showings/zones have not been previously drilled using modern diamond drilling methods.

The geology of the Regal property generally consists of the Badshot and Lade Peak limestones, and argillites and phyllites of the Index Formation.

Snowflake and Regal Silver (Stannex/Woolsey) Mines

The Snowflake and Regal Silver mines were two former producing mines that operated intermittently during the period 1936-1953. The last significant work on the property took place from 1967-1970, when Stannex Minerals completed 2,450 meters of underground development work and a feasibility study, but did not restart mining operations. In 1982, reported reserves were 590,703 tonnes grading 71.6 grams per tonne silver, 2.66 per cent lead, 1.26 per cent zinc, 1.1 per cent copper, 0.13 per cent tin and 0.015 per cent tungsten (Minfile No. 082N 004 – Prospectus, Gunsteel Resources Inc., April 29, 1986). It should be noted that the above resource and grades, although believed to be reliable, were prepared prior to the adoption of NI43-101 and are not compliant with current standards set out therein for calculating mineral resources or reserves.

ALLCO Silver Mine

The ALLCO Silver Mine is situated 6.35 Kilometers northwest of the above described Snowflake/Regal Mine(s). The ALLCO Silver Mine operated from 1936-1937 and produced 213 tonnes of concentrates containing 11 troy ounces of gold (1.55 g/t), 11,211 troy ounces of silver (1,637 g/t) and 173,159 lbs of lead (36.9%).

Airborne Geophysics to Guide Future Exploration

An extensive airborne geophysics survey conducted by Geotech Ltd of Aurora, Ontario, for Northaven Resources Corp. in 2011, on the Regal Project identified four well defined high potential linear targets correlating with the same structural orientation as the Allco, Snowflake and Regal Silver mines. Northaven also reported that the mineralogy and structural orientation of the Allco, Snowflake and Regal Silver appeared to be similar to that of Huakan’s J&L gold project located to the north, and on a similar geophysical trend line. The J&L is reportedly now one of western Canada’s largest undeveloped gold deposits. Rokmaster Resources Corp. recently optioned the J&L property in a $44.2M deal and has renamed it the Revel Ridge Project. Rokmaster is presently working on expanding the current resource.

After completing the airborne survey, Northaven failed in financing their company and conducting further follow up exploration on the property and subsequently forfeited the claims without any of the follow up work ever being completed. Affinity Metals is in the fortunate position of benefitting from this significant and promising geophysics data and the associated targets.

The aforementioned Northaven airborne geophysical survey conducted at a cost of $319,458.95 in August of 2011 is described in The BC Ministry of Energy, Mines and Petroleum Resources Assessment Report #33054. The results of the survey are competently explained and illustrated by professionals on You Tube at: https://www.youtube.com/watch?v=GX431eBY_t0

Condor Consulting, Inc. who compiled the survey data and produced the original geophysics report was recently retained by Affinity in order to provide more detailed interpretations and potential drill target locations with the aim of testing two of the four main target areas in the future.

Earth Sciences Services Corp. (ESSCO) has also recently provided acoustical geophysics data for portions of the Regal property. This data is also being interpreted and analyzed with respect to future drill targets.

The Corporation is presently in the process of correlating and interpreting all of the historic and new geophysical and geochemical data as well as the 2019 drill results with the objective of further defining 2020 drill targets.

Affinity Metals has been granted a 5 Year Multi-Year-Area-Based (MYAB) exploration permit which includes approval for 51 drill sites.

Assay Procedure, Quality Assurance and Quality Control Procedures

All drill core samples were sent to MSA Laboratories in Langley, British Columbia for assay. Samples were analyzed by the following methods, as appropriate, to determine grades: ICP-130 35 element two acid digestion with ICP-AES finish, IMS-130 51 element two acid digestion with ICP-AES/MS finish, FAS-418 Ag 30g fire assay with gravimetric finish, determination of Ag, Cd, Pb, W, and Zn with four acid digestion and ICP-AES finish, determination of Pb and Zn by titration, and determination of Sn by Sodium Peroxide fusion with ICP-OES finish.

The Company employed a QA/QC program that was managed by a Qualified Person during the entire drill program. Blanks, duplicates (both pulp splits and 1/4 core), and two certified standard reference materials were used. These QA/QC samples were inserted at a rate of 1 every 10 to 15 samples.

Qualified Person

The Qualified Person for the Regal Project for the purposes of National Instrument 43-101 is Frank O’Grady, P.Eng. He has read and approved the scientific and technical information that forms the basis for the disclosure contained in this news release.

About Affinity Metals

Affinity Metals is focused on the acquisition, exploration and development of strategic metal deposits within North America.

The Corporation’s flagship project and present focus is the Regal.

On behalf of the Board of Directors

Robert Edwards, CEO and Director of Affinity Metals Corp.

The Corporation can be contacted at: [email protected]

Information relating to the Corporation is available at: www.affinity-metals.com

Gold Sparkles as “The Great Lockdown” Hammers the Global Economy SPONSOR: Loncor Resources $LN.ca $ABX.ca $TECK.ca $RSG $NGT.to $GOLD $NEM

Posted by AGORACOM at 8:42 AM on Thursday, April 16th, 2020

Sponsor: Loncor, a Canadian gold explorer controlling over 2,400,000 high grade ounces outside of a Barrick JV. The Ngayu JV property is 200km southwest of the Kibali gold mine, operated by Barrick, which produced 800,000 ounces of gold in 2018. Barrick manages and funds exploration at the Ngayu project until the completion of a pre-feasibility study on any gold discovery meeting their Tier One investment criteria. Newmont $NGT $NEM owns 7.8%, Resolute $RSG owns 27% Click Here for More Info

This image has an empty alt attribute; its file name is Loncor-Small-Square.png
  • Physical gold was up 13.8 percent through April 10
  • Too few investors have adequate exposure to the yellow metal

Gold and gold stocks are among the highest performing assets of 2020 so far as investors seek a haven amid the coronavirus-fueled rout, and as central banks and governments around the world roll out unprecedented monetary and fiscal measures in an effort to mitigate the economic impact of the “Great Lockdown.”

That’s the name the International Monetary Fund (IMF) has given this uncertain period, and I believe it may stick. The IMF added that the “world economy will experience the worst recession since the Great Depression,” with global economic growth this year projected to fall to negative 3 percent.

This highlights the importance of protecting your family’s wealth right now, which savvy investors have historically managed to do with gold and precious metals.

Physical gold was up about 13.8 percent through April 10, while senior gold miners advanced 2.8 percent, making the group the best asset class of the year so far. Longtime readers of Frank Talk know that I frequently recommend a 10 percent weighting in gold and gold stocks, and now you can see why. A 10 percent allocation at the beginning of the year—before any of us had ever heard of the novel coronavirus—could have helped minimize the impact of losses in other positions.

(Click on images to enlarge)

The problem is that too few investors have adequate exposure to the yellow metal. That’s the case even for many who may believe they do. As the World Gold Council (WGC) pointed out last year, most broad-based commodity indices have a very small weighting in gold — the S&P GSCI’s, for instance, is only 3.37 percent. What this means is that investors in funds that track these indices likely do not get the full benefit of having gold in their portfolio.

That’s why I recommend that the 10 percent weighting be split into two halves, with 5 percent in physical gold (bars, coins, 12-karat jewelry ) and the other 5 percent in high-quality gold and precious metal mining stocks, mutual funds and ETFs.

Maybe you’ve missed the rally up to this point, but the good news is that it’s probably still not too late to participate.

Gold Well-Positioned to Revert to Its Mean Relative to the S&P 500

According to analysis by Bloomberg commodity strategist Mike McGlone, the price of gold appears to be seeking to revert to its long-term mean relative to the S&P 500 Index. This would suggest that we could see a new record high, driven largely by excessive money printing.

“Unprecedented global monetary stimulus is a worthy catalyst for the per-ounce price of gold to revert to its long-term mean vs. the S&P 500 Index, in our view,” McGlone explains.

The implication of mean reversion right now is that gold would hit a new all-time high, assuming the S&P continues to trade around 2,800. After all, a one-to-one ratio means that both assets are trading at the same level.

This has happened before, as you can see in the chart above. As recently as March 2013, both spot gold and the S&P 500 were trading in the same 1,500 to 1,600 range. Before that, in May 1990, it was a 330 to 360 range.

A reversion to the mean now—again, assuming the S&P continues to trade at its current level—would put the yellow metal at approximately $2,800 an ounce, a new record high by far.

But remember, that’s just a simple one-to-one ratio. The long-term gold/S&P mean is slightly higher, at 1.12, so the gold price would also be slightly higher, possibly closer to $3,000 an ounce.

Mean reversion is something I write about more in-depth in “Managing Expectations: Anticipate Before You Participate in the Market,” which you can read by clicking here.

Interest in Gold Mining Stocks and Gold Royalty Companies Takes Off

Not enough investors have optimal exposure to gold, according to the WGC, but we’re currently seeing a surge in interest in gold mining stocks and gold royalty companies, if Google search data is any indication.

Search terms using “gold mining stocks” and “gold royalty companies” were higher this month than at any other time in the past 10 years. That includes when the yellow metal hit its record high of $1,900 an ounce in 2011.

Google Trends isn’t a leading indicator recognized by mainstream economists and market analysts, but I believe it shows where investors’ thinking may be at right now. They’re seeking a way to preserve their wealth as we face what could be the worst economic downturn in nearly 100 years, and they’re betting that higher precious metal prices will send shares of gold mining and royalty companies higher as well.

It’s not a bad strategy.

###

Apr 14, 2020
Frank Holmes

website: www.usfunds.com

http://www.321gold.com/editorials/holmes/holmes041620.html

Gold, Silver Bulls Bask Amid Bullish Charts, Safe-Haven Buying SPONSOR: Labrador Gold $LAB.ca $RIO.ca $WHM.ca $SIC.ca $NXS.ca

Posted by AGORACOM at 11:16 AM on Wednesday, April 15th, 2020

SPONSOR: Labrador Gold – Two successful gold explorers lead the way in the Labrador gold rush targeting the under-explored gold potential of the province. Exploration has already outlined district scale gold on two projects, including a 40km strike length of the Florence Lake greenstone belt, one of two greenstone belts covered by the Hopedale Project. Recently acquired 14km of the potential extension of the new discovery by New Found Gold’s Queensway project to the south. Click Here for More Info

Gold futures prices are trading not far from unchanged on the day Tuesday at midday, after scoring a 7.5-year high early on, at $1,788.80, basis June Comex futures. Silver prices are sharply up and at a four-week high today. Gold bulls are enjoying the strong near-term technical advantage to continue to suggest more upside for the yellow metal in the near term. Safe-haven demand continues to boost gold, and to a lesser degree silver, as the global economy is still on very shaky ground. June gold futures were last up $0.10 an ounce at $1,761.30. May Comex silver prices were last up $0.503 at $16.04 an ounce.

Global stock markets were mostly higher in overnight trading. U.S. stock indexes are solidly higher at midday. More and more it appears North America and Europe have “turned the corner” on the Covid-19 pandemic. New York Governor Cuomo said Monday his state has seen the worst of the pandemic. Other hotspots in the U.S. have also showed signs of simmering down. Leading U.S. health officials are now saying the world’s largest economy can very likely begin to reopen in stages beginning in May.

The present Covid-19 situation appears to be a sweet spot for the precious metals. There is enough confidence in the marketplace for traders to want to trade markets, but the global economies are still in very bad shape and it’s uncertain when they will be fully operational or healed.

Major corporate earnings reports are now starting to be released, which will show the early impact of the Covid-19 pandemic, and be a sobering reminder of the tough economic times at present. JP Morgan’s results today were a testament of a crippled U.S. economy.

In overnight news, China, the world’s second-largest economy, saw its March exports down 6.6%, year-on-year, which was less than expected. Imports were down 0.9% in the period, also way less than expected. China watchers deemed this data as upbeat, showing the Chinese economy is recovering from the pandemic.

The important markets today see Nymex crude oil prices trading solidly lower, around $21.00 a barrel. Oil market bulls are sorely disappointed the weekend OPEC and other major oil producers agreement to restrict oil output did not boost crude oil futures prices. However, there is no consensus on how much oil production will be reduced. Some market watchers think 10 million barrels a day and the more optimistic bulls think 20 million. There is more agreement among analysts that worldwide oil demand has dropped by at least 20 million barrels a day.

Meantime, the U.S. dollar index is lower at midday. The 10-year U.S. Treasury note yield is trading around 0.735% today.

Technically, June gold futures bulls have the strong overall near-term technical advantage. More upside is likely in the near term. Gold bulls’ next upside near-term price breakout objective is to produce a close above solid technical resistance at $1,800.00. Bears’ next near-term downside price breakout objective is pushing prices below solid technical support at $1,700.00. First resistance is seen at today’s high of $1,788.80 and then at $1,800.00. First support is seen at today’s low of $1,755.30 and then at $1,750.00. Wyckoff’s Market Rating: 9.0

May silver futures prices were nearer the session high and hit a four-week high at midday. The silver bulls have the overall near-term technical advantage. Prices are in a four three-week-old uptrend on the daily bar chart. Silver bulls’ next upside price objective is closing prices above solid technical resistance at $17.00 an ounce. The next downside price breakout objective for the bears is closing prices below solid support at $14.50. First resistance is seen at today’s high of $16.30 and then at $16.50. Next support is seen at today’s low of $15.655 and then at this week’s low of $15.385. Wyckoff’s Market Rating: 6.5.

May N.Y. copper closed up 285 points at 233.10 cents today. Prices closed near the session high and closed at a four-week high close today. The copper bulls have the slight overall near-term technical advantage. A price uptrend is in place on the daily bar chart. Copper bulls’ next upside price objective is pushing and closing prices above solid technical resistance at 250.00 cents. The next downside price objective for the bears is closing prices below solid technical support at 220.00 cents. First resistance is seen at this week’s high of 235.25 cents and then at 238.00 cents. First support is seen at 230.00 cents and then at this week’s low of 226.35 cents. Wyckoff’s Market Rating: 5.5

Source: https://www.kitco.com/news/2020-04-14/Gold-silver-bulls-bask-amid-bullish-charts-safe-haven-buying.html

Gold Futures Prices at 7.5-Yr. High On Safe-Haven Demand, Bullish Charts SPONSOR: Labrador Gold $LAB.ca $RIO.ca $WHM.ca $SIC.ca $NXS.ca

Posted by AGORACOM at 10:46 AM on Tuesday, April 14th, 2020

SPONSOR: Labrador Gold – Two successful gold explorers lead the way in the Labrador gold rush targeting the under-explored gold potential of the province. Exploration has already outlined district scale gold on two projects, including a 40km strike length of the Florence Lake greenstone belt, one of two greenstone belts covered by the Hopedale Project. Recently acquired 14km of the potential extension of the new discovery by New Found Gold’s Queensway project to the south. Click Here for More Info

Gold futures prices are trading narrowly on both sides of unchanged in early U.S. trading Tuesday after scoring another 7.5-year high, at $1,785.00 overnight, basis June Comex futures. Gold bulls are enjoying the strong near-term technical advantage to continue to suggest more upside for the yellow metal in the near term. Safe-haven demand continues to boost gold, and to a lesser degree silver, as the global economy is still on very shaky ground. June gold futures were last down $0.90 an ounce at $1,760.20. May Comex silver prices were last up $0.388 at $15.925 an ounce.

Global stock markets were mostly higher in overnight trading. U.S. stock indexes are pointed toward higher openings when the New York day session begins. More and more it appears North America and Europe have “turned the corner” on the Covid-19 pandemic. New York Governor Cuomo said Monday his state has seen the worst of the pandemic. Other hotspots in the U.S. have also showed signs of simmering down. Leading U.S. health officials are now saying the world’s largest economy can very likely begin to reopen in stages beginning in May.

Major corporate earnings reports are now starting to be released, which will show the early impact of the Covid-19 pandemic, and be a sobering reminder of the tough economic times at present.

Technically, the gold bulls have the strong overall near-term technical advantage amid a price uptrend in place on the daily, weekly and monthly charts. That strongly suggests the path of least resistance for prices will remain sideways to higher for at least the near term and probably longer. Bulls’ next upside price objective is to produce a close in June futures above solid resistance at $1,800.00. Bears’ next near-term downside price objective is pushing futures prices below solid technical support at $1,700.00. First resistance is seen at the overnight high of $1,785.00 and then at $1,800.00. First support is seen at $1,750.00 and then at Monday’s low of $1,724.20. Wyckoff’s Market Rating: 8.5

May silver futures bulls have the overall near-term technical advantage and prices are  trending higher on the daily bar chart. Silver bulls’ next upside price objective is closing prices above solid technical resistance at $17.00 an ounce. The next downside price breakout objective for the bears is closing prices below solid support at $14.50. First resistance is seen at last week’s high of $16.09 and then at $16.25. Next support is seen at Monday’s low of $15.385 and then at $15.25. Wyckoff’s Market Rating: 6.0.

SOURCE: By Jim Wyckoff

https://www.kitco.com/news/2020-04-14/Gold-futures-prices-at-7-5-yr-high-on-safe-haven-demand-bullish-charts.html

How Audi Plans To Bring 20 All-Electric Models To Market In The Next Five Years SPONSOR: Lomiko Metals $LMR.ca $CJC.ca $SRG.ca $NGC.ca $LLG.ca $GPH.ca $NOU.ca

Posted by AGORACOM at 10:32 AM on Tuesday, April 14th, 2020

SPONSOR: Lomiko Metals is focused on the exploration and development of minerals for the new green economy such as lithium and graphite. Lomiko owns 80% of the high-grade La Loutre graphite Property, Lac Des Iles Graphite Property and the 100% owned Quatre Milles Graphite Property. Lomiko is uniquely poised to supply the growing EV battery market. Click Here For More Information

  • Globally, by 2025, Audi is aiming to have 30 electrified models on sale, with 20 of those vehicles fully electric.
  • It is an ambitious plan showing the brand’s global commitment for a more electrified and sustainable future.

Already in the U.S., Audi has introduced five production models—the Audi Q5 TFSI e, A7 TFSI e and A8 TFSI e plug-in hybrid electric vehicles (PHEV) as well as the e-tron all-electric SUV and upcoming e-tron Sportback. Next, we’ll introduce the Audi Q4 e-tron SUV and e-tron GT performance sedan, which have already been shown as concept vehicles.

Audi’s upcoming all-electric vehicles will be built on four distinct platforms that balance performance, efficiency, practicality and the engineering and craftsmanship synonymous with the Audi brand. Here are details of the four architectures that will underpin cars and SUVs in a multitude of sizes to bring Audi’s electrified plans to reality.

MLB evo: The first Audi electric vehicles

The first Audi quattro model of the 1980s was simply named “quattro” for its innovative all-wheel-drive technology. Much the same, the “e-tron” name foreshadows a range of electric vehicle (EV) drivetrain technology for the Audi brand. The Audi e-tron SUV is the first all-electric SUV, having gone on sale in the U.S. starting in May 2019. It combines electric mobility with Audi quality: A sophisticated drive and recuperation system, all-wheel drive and maximum comfort. It is an Audi, through and through, in quality, performance and execution.

Manufactured in a certified CO2-neutral plant in Brussels, Belgium, whose 398,264 sq ft rooftop solar array is large enough to produce approximately 3,000 MWh annually—or enough to charge approximately 30,000 e-tron SUVs—the e-tron is based on a heavily modified version of the modular longitudinal platform (MLB evo) that underpins an array of Audi vehicles. With a wheelbase that stretches 115.3 inches, the e-tron is between the Audi Q5 and Audi Q7 SUVs in terms of size, or about the same size as an Audi Q8. The high-voltage battery stores up to 95 kWh of energy and can recover up to 30% of energy used to drive the vehicle during regenerative braking applications. In most applications, the e-tron uses brake-energy regeneration relying on its hydraulic brake booster. A brake pedal simulator makes the switch from regen to hydraulic braking nearly unnoticeable.

The e-tron houses two asynchronous electric motors (ASM) that produce up to 402 horsepower in boost mode. A more powerful, three-motor variant with fully independent rear torque vectoring is also under development.

Using an Audi-designed power electronics module, the e-tron is able to read sensor data 10,000 times per second and output current values for the electric motors to help with traction in various conditions. With its rear-biased quattro all-wheel-drive system, if the e-tron senses a loss of traction, it is able to redistribute torque to wheels with traction in just 30 milliseconds.

The Audi e-tron can charge using both alternating (Level 1 and 2) and direct (Level 3) current and can achieve approximately 80% charge in 30 minutes at a 150 kW high-speed public charger. Later in 2020, the e-tron will be joined by the e-tron Sportback, a new variant with a coupe-like profile.

J1: The performance electric platform

Shown as a concept vehicle thus far, the Audi e-tron GT performance sedan shows how sports cars will evolve in the electric era. For the e-tron GT, Audi is sharing synergies with the Porsche brand, which developed the J1 architecture.

The Audi e-tron GT concept car is equipped with two permanently excited synchronous motors (PSM) that produce a combined 582 horsepower and 612 lb-ft of torque. A PSM has a rotor with permanent magnets in it and a natural internal magnetic field. In a PSM, the rotor moves in coordination with the magnetic field of the stator (the stationary part of the motor in which the rotor rotates), which is why it is known as a permanently excited synchronous motor. By comparison, an asynchronous motor’s rotor rotates slower than a synchronous speed.

While specifications for the e-tron GT are subject to change, the e-tron GT concept is estimated to reach 62 mph from standstill in 3.5 seconds and 124 mph in just over 12 seconds in production form.

The electrical system in the e-tron GT concept car runs at 800 volts, whereas most modern EVs currently operate at a capacity of 400 volts or less. Volts are a measurement of pressure in an electric circuit, and the J1 platform can accept this level of force thanks to its energy management and cooling systems. Because of this, the e-tron GT is able to charge the battery to 80% in about 20 minutes at a Level 3 DC fast charger with a maximum output of 350 kW.

In the e-tron GT, the battery is located in the underbody, between the axles and is designed with recesses in the rear footwell, ensuring comfort for front- and rear-seat passengers. The body and roof of the e-tron GT are made of carbon fiber-reinforced polymer (CFRP), and the car uses the same multi-material construction philosophy as other Audi vehicles like the A8.

In combination with the low center of gravity, the e-tron GT has quattro all-wheel drive, with an electric motor at the front and rear axles, offering ideal traction for a sports car. The drive management distributes the torque of the electric motors between the axles as needed and also regulates the wheels separately.

The layout allows for numerous suspension and performance features, for example all-wheel steering or a sport differential, providing excellent traction and vehicle dynamics. Electric motors with different outputs can be used in production versions.

MEB: Small Audi platform, large aspirations

A good way to think about Audi’s use of the modular electric toolkit (MEB) architecture is to think of the current internal-combustion vehicles in the Audi lineup.

Small, gas-powered Audi vehicles like the A3 and Q3 serve as entry points into the Audi brand and share components with one another on a platform called MQB. Larger Audi vehicles from the A4 up to the A8 and SUVs use shared componentry on the MLB platform. This helps engineers develop shared parts across many vehicles that are philosophically similar. That’s what the MEB platform will be to Audi for small and medium electric vehicles, with the PPE platform focused toward medium and large EVs.

With the MEB platform, Audi will draw from the strength of the Volkswagen Group to offer customers affordable yet technically sophisticated electric models with unmistakable Audi DNA. The MEB platform will be used for vehicles like the Q4 e-tron. Designed exclusively for EVs, MEB will provide customers all the advantages that compact electric motors and lithium-ion batteries in different sizes and capacities offer. The battery systems, electric motors and axle designs form a technology toolkit. In contrast to the current models with combustion engines, the front section is considerably shorter—the front axle and firewall move forward, making the wheelbase and usable interior space considerably larger.

The Q4 e-tron is expected to be the first Audi model based on the MEB platform, with exterior dimensions comparable to those of the Q3 but with the interior dimensions of a significantly larger vehicle. The architecture also offers new design opportunities and offers different performance levels and powertrain configurations.

PPE: Medium and large premium vehicles

Finally, what the MLB platform is to vehicles like the Audi A4 through A8 and Q5 through Q8, the Premium Platform Electric (PPE) architecture is to Audi’s electric portfolio.

PPE has been designed and developed in cooperation with Porsche from the start with the project team sharing space in Ingolstadt. PPE is characterized by a high-tech and highly scalable architecture that allows for both low- and high-floor, from the medium-size class and up—SUVs, Sportbacks, Avants and crossovers. The portfolio and flexibility will allow Audi to develop and sell one of the best combinations of electric, plug-in and internal combustion vehicles in the global markets.

The technology offered in PPE is similar to that of MEB and with a number of powertrain and battery options that will be available. Standard packaging will allow for one electric motor in the rear; the higher-range models will be equipped with a second electric motor at the front axle (PSM or ASM) that can activate quattro all-wheel drive automatically when needed.

Like in the Audi e-tron GT concept, the electrical architecture is 800 volts; in combination with high-efficiency thermal management, it enables an ultra-high-speed charging capacity of 350 kW. The dimensions and overhangs of the low-floor Audi models on the PPE platform will be slightly shorter than those of the current combustion engine models on the MLB platform but will offer greater interior dimensions. Torque vectoring, air suspension and all-wheel steering will all be available.

The Audi brand has dedicated approximately €12 billion global investment through 2024 to help ensure development of a number of EVs, in an effort to meet demand as infrastructure around the world rapidly develops. Globally, Audi anticipates it will reach production of approximately 800,000 electrified vehicles per year by 2025.

As the Volkswagen Group has committed to the goals of the Paris Climate Agreement and plans to be a CO2-neutral automaker globally by 2050, Audi and the entire Group are putting a full focus into electrification and more sustainable transportation. The above platforms can help ensure the Group does all it can to reach its ambitious goals.

SOURCE: https://us.motorsactu.com/tech-talk-how-audi-plans-to-bring-20-all-electric-models-to-market-in-the-next-five-years/

Detailed Insight into the Properties and Applications of Graphene SPONSOR: Gratomic $GRAT.ca $SRG.ca $NGC.ca $LLG.ca $GPH.ca $NOU.ca #TODAQ

Posted by AGORACOM at 9:40 AM on Tuesday, April 14th, 2020
http://blog.agoracom.com/wp-content/uploads/2019/09/GRAT-square2.png

SPONSOR: Gratomic Inc. (TSX-V: GRAT) Advanced materials company focused on mine to market commercialization of graphite products, most notably high value graphene based components for a range of mass market products. Collaborating with Perpetuus, Gratomic will use Aukam graphite to manufacture graphene products for commercialization on an industrial scale. For More Info Click Here

Graphene is only one-atom thick in its monolayer form and approximately 0.32 nanometers in the Z-axis. This means that the third dimension is eliminated, and it is classed as a 2D, all-surface material. Put into perspective, a stack of three million graphene sheets would only be 1 mm thick

Graphene in its monolayer form is the strongest material ever tested despite being extremely thin, a strength that comes in part from its flexibility which means it is also the most stretchable crystal material measured to date. It is also 97.7 percent transparent and has an extremely low permeability rate, with even helium atoms being unable to penetrate it.

Graphene also boasts the highest thermal conductivity ever recorded, standing at 10 times higher than copper. Further adding to its advantages as a material is the fact that it has the highest intrinsic electron mobility that is approximately 100 times greater than silicon. This property, in particular, has intrigued electronics applications for the last 15 years.

Engineered Properties Applications

Table 1. Graphene’s Properties and Associated Applications. 

Source: Graphene Frontiers, Ruoff.

Altogether, these properties make graphene the latest “wonder material” in advanced materials science and technology. This has resulted in research on other 2D materials that are analogous to graphene, from hexagonal boron nitride (h-BN), Molybdenum Disulfide (MoS2), transition metal dichalcogenides (TMDCs) and black phosphorus, to silicene, germanene, and others.

The wider group of 2D materials is significant in relation to graphene as it exhibits a wider spectrum of electronic properties when compared to metals, semimetals, and semiconductors that all have different gaps in their energy bands, as well as insulators.

Additionally, combining the materials in this wider 2D group through layering results in heterostructures that possess unique physical properties of their own. This range of 2D materials and the heterostructures that can be formed when these 2D materials work in combination have a broad spectrum of applications, including electronics, optoelectronics, sensors, flexible and wearable devices, catalysis, and more.

This information has been sourced, reviewed and adapted from materials provided by The Graphene Council.

SOURCE: For more information on this source, please visit The Graphene Council.

Why The Price Of Silver Could Skyrocket SPONSOR: Affinity Metals $AAF.ca $SII.ca $TUD.ca $GTT.ca $AMK.ca $OSK.ca $RKR.ca

Posted by AGORACOM at 8:59 AM on Tuesday, April 14th, 2020
This image has an empty alt attribute; its file name is Affinity_Metals_Corp_Logo.png

Sponsor: Affinity Metals Corp. (TSX-V: AFF) is a Canadian mineral exploration company building a strong portfolio of mineral projects in North America. The Corporation’s flagship property is the drill ready Regal Property near Revelstoke, BC where Affinity Metals is making preparations for a spring drill program to test two large Z-TEM anomalies. Click Here for More Info

By the mid-6th century BC, Darius the Great was ‘King of Kings’, ruling over the vast Achaemenid Empire.

By that time, gold and silver had already been in use by earlier civilizations for thousands of years.

There are cuneiform tablets that are nearly 4,000 years old from ancient Sumeria which record commercial transactions made in gold and silver.And subsequent civilizations – the Babylonians, Egyptians, Lydians, etc. all used gold or silver in commerce.But Darius had a unique idea. He borrowed the idea of minting gold and silver coins from the Lydians… but then established a fixed exchange rate between the two metals.

Darius decreed that one gold “daric” was worth 13.5 silver coins– one of the first examples in history of a fixed, bimetallic standard.

His idea caught on. And for thousands of years afterward, later civilizations established a fixed gold/silver ratio.

In ancient Greece during the age of Pericles, gold was valued at 14x silver. In ancient Rome, Julius Caesar valued gold at 12x silver.

It remained this way for centuries.

Even in the earliest days of the United States, eighteen centuries after Caesar, The Coinage Act of 1792 established a ratio of 15:1.

(According to the law, one US dollar is supposed to be 24.1 grams of silver, or 1.6 grams of gold. So those pieces of paper in your wallet are not dollars– they are technically “Federal Reserve Notes”.)

In modern times there is no longer a fixed ratio between gold and silver, though its long-term average over the last several decades has been between 50:1 and 80:1.

This is a lot higher than in ancient times… but the circumstances are obviously different.

Today, gold is still widely used as a reserve by central banks and governments around the world.  And investors still buy gold as a hedge against inflation and uncertainty.

Silver, on the other hand, has countless industrial applications; it’s a critical component in everything from mobile phones to automobiles to solar panels.

Like gold, silver is also a hedge against inflation and uncertainty.

But silver’s demand fundamentals are more heavily influenced by overall economic health. If the economy is in recession, silver prices can fall because there’s less demand from industry.

Gold, on the other hand, doesn’t follow that pattern. In 5 out of the last 6 recessions, in fact, gold has increased in price.

That’s why recessions, and extreme turmoil, can lead to a massive spike in the gold/silver ratio. Gold goes up, and silver stays flat (or falls).

  • Just prior to World War II as Hitler launched his invasion of Poland, the ratio spiked to 98:1.
  • In 1991 as the first Gulf War began, the ratio again reached 100:1.
  • Today we’re back again in that territory; as of this morning, the ratio is 110:1, and it’s been as high as 120 or more in recent weeks

Source: MacroTrends.net

Now, there are very few things about this pandemic that we can be certain about.

Things that were unthinkable even a month ago are now part of our daily lives. And so as I’ve written over and over again, EVERY possible scenario is on the table right now.

But one thing that does seem very clear is that central banks around the world are going to print an extraordinary amount of money.

Many of them already have.

The Federal Reserve in the US, for example, has already expanded its balance sheet to SIX TRILLION DOLLARS.

That’s a nearly 50% increase from last month. And they’re just getting started.

Why does something so mundane as a central bank balance sheet even matter?

Because a rising balance sheet means they’re conjuring trillions of dollars out of thin air to bail everyone out.

This is the way they solve problems: they print money and debase the currency, something that policymakers have been doing for thousands of years.

But you can only get away with doing that a limited number of times before the currency starts to lose value.

We don’t know how long it will last, how much destruction it will cause, or what the world will look like once this is over.

But we can be pretty sure that central banks are going to print a ridiculous amount of money, and that governments will go into a ridiculous amount of debt.

They’ve told us this much. And they’ve already started to do it. So this seems pretty obvious.

The price of gold is up significantly over the last several months, and since the start of this crisis.

But the price of silver has declined… leading to a record-high gold/silver ratio.

This ratio may stay elevated for a while, or even go higher.

But in the past, the ratio has always returned to more traditional levels. Always. Even when the world was facing Adolf Hitler or the Great Depression.

So it stands to reason that, if they keep printing money (which they already are), and the ratio eventually returns to its historical range, the price of silver could really skyrocket.

We’ll spend some time this week talking about some interesting ways to take advantage of this.

SOURCE: https://www.zerohedge.com/commodities/why-price-silver-could-skyrocket

Mota Ventures $MOTA.ca Announces Record Number of Subscriptions Year-To-Date in March and Over 6,000 New Customers in April $APH.ca $GBLX $PFE $ACG.ca $ACB.ca $WEED.ca $HIP.ca $WMD.ca $CGRW

Posted by AGORACOM at 7:38 AM on Tuesday, April 14th, 2020
Mota large
  • First Class CBD and Nature’s Exclusive brands acquired over 6,000 new customers from April 1st through April 11th.
  • 1,700 of the new customers purchased products from the Immune Support line.
  • MOTA experienced a record number of new customers enrolling in a monthly subscription, totaling 18,962.

VANCOUVER, BC / ACCESSWIRE / April 14, 2020 / Mota Ventures Corp. (CSE:MOTA FSE:1WZ:GR OTC PINK:PEMTF) (the “Company“) is excited to announce its First Class CBD and Nature’s Exclusive brands acquired over 6,000 new customers from April 1st through April 11th. Additionally, during this time period over 1,700 of the new customers purchased products from the Immune Support line. During the month of March, the Company experienced a record number of new customers enrolling in a monthly subscription, totaling 18,962.

The Immunity Blend is currently the Company’s top seller in the Immune Support line. The all-natural blend is made from 100% pure essential oils, including cinnamon leaf, lemon, clove bud, lime, eucalyptus globulus, rosemary, peppermint, spearmint and oregano. The line also features Immune CBD oil containing CBD, B3, B12, Vitamin C and Zinc and Immunity Gummy Bears contain 100% natural Elderberry extract.

First Class and Nature’s Exclusive offer a CBD hemp-oil formulation intended to provide users with the therapeutic benefits that hemp may offer. The hemp oil used in the products is derived from hemp grown and cultivated in the United States. The extraction process is designed to maintain all the beneficial qualities that hemp may offer. First Class and Nature’s Exclusive offers a range of products, which include CBD oil drops, CBD gummies, CBD pain relief cream, CBD skin serum and CBD coffee. The Company plans to continue its significant growth in U.S. operations over the balance of 2020, as well as an expansion into the European market.

“I am pleased at the incredible number of monthly subscriptions acquired during the month of March. We continue to see overwhelming interest in our Immune Support products and higher CBD content oils. We operate a very responsive and agile business, which allows us to identify consumer trends and execute upon the demand we are seeing in the marketplace,” stated Ryan Hoggan, CEO of the Company.

About Mota Ventures Corp.

Mota Ventures is an established eCommerce direct to consumer provider of a wide range of CBD products in the United States and Europe. In the United States, the company sells a CBD hemp-oil formulation derived from hemp grown and formulated in the US through its First Class CBD and Nature’s Exclusive brands. Within Europe, its Sativida brand of award winning 100% organic CBD oils and cosmetics are sold throughout Spain, Portugal, Austria, Germany, France, and the United Kingdom. Mota Ventures is also seeking to acquire additional revenue producing CBD brands and operations in both Europe and North America, with the goal of establishing an international distribution network for CBD products. Low cost production, coupled with international, direct to customer, sales channels will provide the foundation for the success of Mota Ventures.

ON BEHALF OF THE BOARD OF DIRECTORS

MOTA VENTURES CORP.

Ryan Hoggan

Chief Executive Officer

For further information, readers are encouraged to contact Joel Shacker, President at +604.423.4733 or by email at [email protected] or www.motaventuresco.com