Posted by AGORACOM
at 10:43 AM on Tuesday, August 27th, 2019
SPONSOR: Vertical Exploration Inc (TSX-V: VERT) Vertical is researching the use of Wollastonite as a soil additive for optimizing marijuana growth. Recently engaged AGRINOVA’s Phase 1 Research program has also demonstrated that Wollastonite can potentially become BNQ certified for agricultural use in Quebec. Click Here for More Info
Santa Rosa Junior College’s Agriculture
Department is developing a new hemp agriculture program that will train
students in the cultivation of hemp (Cannabis sativa L.), with a goal of
launching the program in fall 2020. SRJC is the first community college
in California to develop a certificate and degree program focused on
hemp.
Beginning spring 2020, students can take hemp-focused
courses within the existing SRJC Sustainable Agriculture and
Horticulture programs. Courses include Introduction to Plant Science,
Soil and Plant Nutrition, Integrated Pest Management, Organic Crop
Planning and Production, and several other courses that will be included
in the new Hemp Agriculture certificate and degree.
Benjamin
Goldstein, the dean of agriculture, natural resources, and culinary
arts, said that he is proud that SRJC will be at the forefront of
training students for this industry. “One of our top priorities is
ensuring our career education programs align with current industry
trends,†he said in a press release announcing the news. “Hemp is a
versatile plant at the center of a multi-billion dollar legal industry
for medicine, fiber, oil, seeds, textiles and more. We are preparing our
students with the knowledge and skills to be competitive in the
workplace.â€
Hemp is a genetically distinct biotype of cannabis
sativa that is grown for fiber, seed or oil. It is used in the
production of products such as food, beverages, cosmetics, nutritional
supplements, fabrics, textiles, construction materials, and other
manufactured goods. Unlike marijuana, hemp is legal at both the federal
and state levels and does not contain significant levels of THC, the
compound in marijuana known for its psychoactive effects. Hemp is used
to product non-psychoactive cannabidiol (CBD), which has shown enormous
promise in medical applications.
“Hemp
is a dynamic crop with a myriad of uses,†said faculty member Dr.
George Sellu in the release. “It is ideal for teaching plant science and
plant propagation techniques in indoor and outdoor environments while
addressing the tenets of agro-ecological sustainability. As a plant
science instructor, I am thrilled to utilize hemp in my classes as an
educational tool.â€
“There is no other community college doing
this, and it’s so relevant in California,†said Norma Gomez, a current
SRJC student. “There are thousands of jobs available for students with
knowledge of hemp agriculture. Plus, we can get real hands-on experience
growing hemp at Shone Farm.â€
SRJC Shone Farm is growing a
0.8-acre test plot of hemp plants. This cultivation site is registered
with the Sonoma County Ag Commissioners Office and follows all federal,
state and county legal and regulatory requirements.
It is the first community college hemp farming operation in California.
Posted by AGORACOM
at 8:35 AM on Tuesday, August 27th, 2019
Trace Analytics Inc. is a Leading Cannabis Science and Technology Company with Significant Footprints in Lab Testing, Research and Development and Licensing
BEVERLY HILLS, CA / ACCESSWIRE / August 27, 2019 /Applied BioSciences Corp.
(OTCQB:APPB) (“Applied” or the “Company”), a vertically integrated
company focused on the development of science-driven cannabinoid
biopharmaceuticals and the production of high-quality CBD products,
today announced that its majority owned subsidiary, Trace Analytics
Inc., entered into a contract for services with the Washington State
Department of Agriculture (WSDA) on July 24, 2019. This contract will
include testing Industrial Hemp samples and include percentage testing
for post-decarboxylation delta 9-tetrahydrocannabidiol (THC) and delta
9-tetrahydocannabinolic acid (THC-A).
The WSDA has
contracted Trace Analytics for the purpose of doing cannabinoid
profiling for the State’s industrial hemp program to ensure the
percentages of certain cannabinoids are below Federal limits.
“We are grateful to
the WSDA and to have been chosen as the sole laboratory in Washington
State to do cannabinoid profiling for the WSDA’s Industrial Hemp
program. We believe this contract provides us with the significant
opportunity to bolster and diversify our testing portfolio into
industrial hemp and we hope to be able to partner with the agency for a
long time to come,†commented Jason Zitzer, Chief Operating Officer of
Trace Analytics. “Throughout the drafting, writing and ratification of
the Washington State Hemp Bill, Trace Analytics has been an integral
part of the process in working with the industry groups. We submitted
all of the paperwork and submitted the hemp processors application along
with a detailed site map to the WSDA for lab testing licensing
consideration. We have already begun receiving samples and reporting
results and to date, the program has gone extremely well.â€
Trace Analytics
Inc. is a leading cannabis science and technology company with
significant footprints in lab testing, research and development and
licensing. Trace Analytics was started by a group of scientists who
specialized in analytical chemistry, genetics and molecular biology. The
focus of the team is to ensure compliance with public safety standards
and end user safety. Trace Analytics is in the process of expanding
throughout the United States, and globally. With the goal of helping the
rest of the world adopt “best practices†in cannabis and hemp testing,
the Company also provides expert consulting services to legislators and
regulators in many countries, states and municipalities around the
world.
About Applied BioSciences Corp.
Applied BioSciences is a
vertically integrated company focused on the development of
science-driven cannabinoid therapeutics / biopharmaceuticals and
delivering high-quality CBD products as well as state-of-the-art testing
and analytics capabilities to our customers. For more information,
visit the Company’s website.
Safe Harbor Statement
Except for historical information contained herein, statements in
this release may be forward-looking and made pursuant to the safe harbor
provisions of the Private Securities Litigation Reform Act of 1995.
Words such as “anticipateâ€, “believeâ€, “estimateâ€, “expectâ€, “intendâ€
and similar expressions, as they relate to Applied Biosciences Corp.
(the “Companyâ€) or its management, identify forward-looking statements.
These statements are based on current expectations, estimates and
projections about the Company’s business based, in part, on assumptions
made by management. These statements are not guarantees of future
performance and involve risks, uncertainties and assumptions that are
difficult to predict. Therefore, actual outcomes and results may, and
probably will, differ materially from what is expressed or forecasted in
such forward-looking statements due to numerous factors, including
those described above and those risks discussed from time to time in the
Company’s filings with the Securities and Exchange Commission. Factors
which could cause actual results to differ materially from these
forward-looking statements include such factors as (i) the development
and protection of our brands and other intellectual property, (ii) the
need to raise capital to meet business requirements, (iii) significant
fluctuations in marketing expenses, (iv) the ability to achieve and
expand significant levels of revenues, or recognize net income, from the
sale of our products and services, (v) the Company’s ability to conduct
the business if there are changes in laws, regulations, or government
policies related to cannabis, (vi) management’s ability to attract and
maintain qualified personnel necessary for the development and
commercialization of its planned products, and (vii) other information
that may be detailed from time to time in the Company’s filings with the
United States Securities and Exchange Commission. The Company
undertakes no obligation to publicly update or revise any
forward-looking statements, whether as a result of new information,
future events or otherwise.
Posted by AGORACOM
at 1:21 PM on Friday, August 23rd, 2019
SPONSOR: American Creek Resources (TSX-V: AMK) owns a 20% Carried Interest to Production at the Treaty Creek Project in the Golden Triangle. 2019’s first hole averaged of 0.683 g/t Au over 780m in a vertical intercept. The Treaty Creek property is located in the same hydrothermal system as Pretivm’s Brucejack and Seabridge’s KSM deposits. Click Here for More Info
After spending three years in a $250 trading range (between $1,121
and $1,375), spot gold has erupted since late May and is up 18.01% YTD
as of last Friday’s (8/15) close at $1,523.34. At the same time, gold
mining equities, as measured by Sprott Gold Miners ETF (SGDM) are up
39.52% YTD.
To us, the operative questions are:
1) What factors ignited gold’s breakout from a three-year consolidation? 2) Are these fundamentals likely to persist in future periods?
We offer the following answers. Gold is clearly responding to a
global pivot by central bankers back towards concerted monetary easing,
and the intractable nature of excessive global debt levels suggests we
are in the very early innings of the developing easing cycle. In short,
for gold this is the real deal and we suspect things are just getting
started.
…for gold, this is the real deal and things are just getting started.
At Sprott, our investment thesis for gold rests largely on the
unsustainable nature of global debt levels. While investor consensus
recognizes that debt levels are a daunting structural dilemma, the
inability to predict either timing or method of inevitable resolution
has long relegated debt concerns to the back burner of investor
priorities.
In this post, we develop the possibility that global asset markets
may finally have reached the point at which excessive debt levels are
overwhelming longstanding relationships in normally functioning capital
markets such as interest rates, time preferences and capital formation.
Named after Austrian economist Hyman Minsky, the global economy in 2019
may be entering a “Minsky Moment,†at which the cumulative distortions
of a long period of debt-fueled growth are finally coming to bear.
Interest Rates Cannot Rise
Throughout 2018, we made the case that outstanding debt levels
precluded the possibility of rising interest rates (long or short)
without inflicting severe pressure on reigning financial asset
valuations. On the short side of the ledger, we warned that the Fed’s
dual policy agenda of simultaneous rate hikes and balance sheet
reduction was far too aggressive in the context of still egregious U.S.
debt levels. Contrary to popular perceptions of U.S. deleveraging since
the financial crisis, the Fed’s Q1 2019 Z.1 Report disclosed that total
U.S. credit market debt now stands at $73.1 trillion, up 33%
from Q1 2009. Importantly, as shown in Figure 1, the U.S. debt-to-GDP
(gross domestic product) ratio still measures a bloated 347%, not far
from its Q2 2009 peak of 382%.
The prior century of U.S. financial history suggests healthy capital
formation in the U.S. economy hinges on reducing the debt-to-GDP ratio
to roughly half its current level. Of course, this would require either
extinguishment of roughly $30 trillion in debt without impacting GDP, or
doubling GDP without incurring an incremental dollar of debt, both
exceedingly remote possibilities. Remaining options are debt default or
debasement, and we are certain global financial stewards will do
everything in their power to choose the latter over the former.
Figure 1. The Ratio of Total U.S. Credit Market Debt-to-GDP (1916-Q1 2019)
Source: BEA; Federal Reserve.
To us, the Fed’s eight years of zero interest rates and QE
(quantitative easing) asset purchases served as tacit admission that the
U.S. financial system requires artificial liquidity to forestall the
devastating debt rationalization inherent in rebalancing paper claims
(debt) to underlying productive output (GDP). Indeed, the serendipitous
and largely unquestioned evolution of the Fed’s congressional mandate
from “stable prices†to a self-appointed “2% inflation target†serves as
proof-positive that the Fed’s paramount concern is avoiding debt deflation at all costs.
Given the awkward messaging in maintaining rates at the zero bound,
we are not surprised that the Fed began the process of “normalizing†the
fed funds rate back in December 2015. After three full years, the
Powell Fed notched in December 2018 the Federal Open Market Committee’s
(FOMC’s) ninth rate hike, to a 2.5% upper bound. In all honesty, we did
not expect that the U.S. financial system could sustain a 2.5% fed funds
rate without significant dislocation of asset prices. Low and behold,
financial turbulence arrived with a vengeance in Q4 2018, when the
S&P 500 shed a startling 19.63% between Chair Powell’s October 3
“long way from neutral†comment and Treasury Secretary Mnuchin’s
convening of the President’s Working Group on Financial Markets on
Christmas Eve.
A precis of Fed behavior since the 2018 Christmas Eve miracle of
reversing asset markets would best be characterized as one of the
sharpest Fed policy U-turns on record. Short-circuiting months of debate
over whether the Fed’s January 2019 tonal change merely represented a
“pause†in an ongoing tightening cycle, the FOMC cut the fed funds rate
25 basis points on 7/31/19. After declaring in December that the Fed’s
balance sheet reduction program was “on autopilot,†“working well†and
“not subject to review,†Chair Powell shuttered the program completely on
7/31/19. Needless to say, we can only smile at Chair Powell’s seemingly
earnest assertion that the Fed’s 7/31 rate cut was a “mid-cycle
adjustment†and “not the beginning of a long series of rate cuts.†Mark
our words, just as with early 2019 arguments for a “pause in the Fed’s
tightening cycle,†current prognostications for a “one and done
insurance cut†belie shallow understanding of what is truly troubling
the Fed.
A quick survey of economic conditions, in fact, is hardly supportive
of a Fed rate cut. Q2 GDP measured 2.1%, with personal consumption
leaping at a 4.3% annual rate (fifth strongest quarter during the past
13 years). The 3.7% unemployment rate rests at a five-decade low and
U.S. equity averages were setting fresh all-time highs in late-July.
Come to think of it, when did “sustaining the expansion†even become a consideration in
the Fed’s congressional mandate? (Answer: gross mission creep.) To us,
it is patently clear that despite respectable output growth, full
employment and record financial asset valuations, the Fed now believes
it has strayed too far from the zero bound to guarantee against incipient debt deflation. Consequently, we expect fed funds to retreat toward the 1% level and beyond in very short order.
Negative Interest Rates
On the long end of the rate spectrum, we have maintained that excessive debt levels absolutely mandate
ever-declining interest rates. We have repeatedly cited Stephanie
Pomboy’s annotated graphic of 10-year U.S. Treasury yields (Figure 2).
On every occasion since 1981 when 10-year Treasury yields have backed up
significantly, a financial crisis has invariably ensued. Therefore, we
are always amazed when consensus begins to project rising Treasury
yields without repercussions, such as during the fall of 2018, when
consensus extrapolated Chair Powell’s hawkish resolve all the way to a
sustainable breakout in Treasury yields. Very simply, if rates have been
unable to rise for 37 years without catalyzing financial distress, why
do investors EVER conclude they might
magically be free to rise in the future, especially since aggregate debt
measures only continue to deteriorate?
Figure 2. 10-Year Treasury Yields with Financial Crises Annotated (1975-8/7/19)
Source: MacroMavens.
Boiling things down, we view gold’s prospects as inextricably linked
to consensus recognition that global interest rates not only cannot rise, but must continue to decline to keep the ever-burgeoning debt pyramid from toppling.
Along these lines, we attribute gold’s accelerating performance since
October 2018 to broadening recognition that global rate structures are
once again crashing through the zero bound. As shown in Figure 3, the
global total of negative yielding sovereign credit has literally
skyrocketed in recent weeks to a mind-numbing $16.7 trillion as of
8/15/19. For perspective, this total represents a rough triple from the
$5.7 trillion total as recently as October 2018. And it goes without
saying, this total is quite the departure from the absolute zero
total for negative-yielding bonds during the 5,000 years of financial
history prior to 2015 (thank you Bank of Japan for the clever
innovation).
Figure 3. Aggregate Total of Negative-Yielding Sovereign Debt (2015-8/15/19)
Source: MeridianMacro.
Perhaps inured by lofty equity averages, general
investor consensus remains relatively unconcerned by the global
explosion in negative-yielding debt instruments. Especially for U.S.
investors, there is a pervasive sense that ramifications of negative
rate structures are just “not our problem.†Sidestepping for the time
being the profound implications of negative rates for capitalism itself,
we wanted to provide a bit more detail on the composition of the
oft-cited negative-yielding sovereign debt total.
In Figure 4, we have compiled. what we believe to be a comprehensive
snapshot of global rate structures as of the close of trading on
8/15/19. We were amazed to discover that the entire yield curve for six
EU countries now trades at negative yields (Switzerland, Germany,
Netherlands, Finland, Sweden and Denmark). French and Austrian curves
are negative through 20 years; Japan and Belgium are negative through 15
years; and Ireland, Slovakia and Slovenia are negative through 10
years. Indeed, we were only able to identify three developed economies
with entirely positive rate curves: United States, United Kingdom and
Canada.
Figure 4. Sovereign Rate Structures for Selected Countries (8/15/19)
Source: http://sprott.com/insights/minsky-moment/
We have no special insight into the impact of negative interest rates
on future valuations for traditional asset classes such as stocks,
bonds and real estate. But as we stated earlier on, we believe that for
gold this is the real deal and we suspect things are just getting
started.
Posted by AGORACOM
at 10:57 AM on Friday, August 23rd, 2019
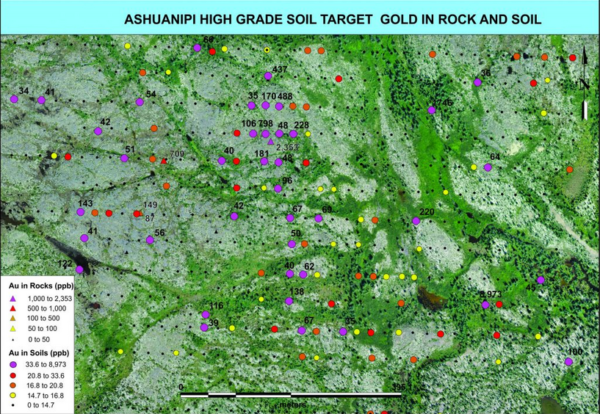
Discovery of gold enriched zone near high grade (8,973ppb) soil sample at Ashuanipi, Labrador
Defined by gold in soil and rock samples that cover an area of 450 metres by 450 metres
Results of ground VLF-Magnetic survey over the area are pending
Drill testing of zone expected in fall
Systematic approach to exploration of district scale anomalies at Ashuanipi allowed LAB to quickly identify favourable areas for gold mineralization
Two successful gold explorers lead the Labrador gold rush: Shawn Ryan and Roger Moss.
Ashuanipi
The Ashuanipi gold project is located just 35 km from the historical iron ore mining community of Schefferville, which is linked by rail to the port of Sept Iles, Quebec in the south. The claim blocks cover large lake sediment gold anomalies that, with the exception of local prospecting, have not seen a systematic modern day exploration program. Results of the 2017 reconnaissance exploration program following up the lake sediment anomalies show gold anomalies in soils and lake sediments over a 15 kilometre long by 2 to 6 kilometre wide north-south trend and over a 14 kilometre long by 2 to 4 kilometre wide east-west trend. The anomalies appear to be broadly associated with magnetic highs and do not show any correlation with specific rock types on a regional scale (see news release dated January 18th 2018). This suggests a possible structural control on the localization of the gold anomalies
Posted by AGORACOM
at 4:16 PM on Thursday, August 22nd, 2019
SPONSOR: Advance Gold AAX.v – Advance Gold controls 100% interest in the Tabasquena Silver Mine in Zacatecas, Mexico. A cluster of 30 Epithermal veins have been discovered, with recent emphasis on exploring a large anomaly to drill. Advance also owns 15% of the Kakamega JV attached to Barrick Takeover Offer for Acacia Mining. Click Here For More Info
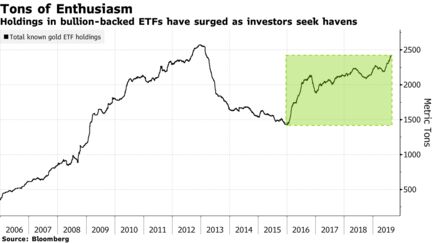
Worldwide holdings have rebounded since 2016 on rising demand
Goldman Sachs has forecast further gains in bullion to $1,600
Gold’s faring extremely well as a haven asset, with inflows into exchange-traded funds hitting 1,000 tons since holdings bottomed in early 2016 after a prolonged unwind in the wake of the global financial crisis.
Total known ETF holdings expanded to 2,424.9 tons on Wednesday, the
highest since 2013, following inflows over the past three years and a
continued build-up in 2019, according to data compiled by Bloomberg.
Current assets are about 1,000 tons higher than the post financial
crisis nadir of 1,425.1 tons.
Gold has surged this year as investors seek protection from slowing
global growth, the incessant trade war, and turmoil in the bond market
that suggests the U.S. may be headed for another recession. The rise has
been aided by a rate cut from the Federal Reserve and expectations more
will soon follow. This week, veteran investor Mark Mobius gave a
blanket endorsement to buying bullion, saying accumulating the precious
metal will reap long-term rewards.
Others are also bullish. Goldman Sachs Group Inc. has said prices will climb
to $1,600 an ounce over the next six months. The bank’s global head of
commodities research, Jeffrey Currie, said that gains are likely be
fueled by demand for ETFs as well as increased central-bank purchases.
Spot gold traded at about $1,500 on Thursday, up 17% this year.
Posted by AGORACOM
at 2:52 PM on Thursday, August 22nd, 2019
SPONSOR: GGX Gold Corp (TSX-V: GGX) GGX’s Gold Drop Property resides within a multi-million ounce gold producing region in British Columbia. The property holds the C.O.D. Vein and recently discovered Everest Vein. GGX has initiated 2019 drilling at Gold Drop. Click Here for More Info
Worldwide holdings have rebounded since 2016 on rising demand
Goldman Sachs has forecast further gains in bullion to $1,600
Gold’s faring extremely well as a haven asset, with inflows into
exchange-traded funds hitting 1,000 tons since holdings bottomed in
early 2016 after a prolonged unwind in the wake of the global financial
crisis.
Total known ETF holdings expanded to 2,424.9 tons on Wednesday, the
highest since 2013, following inflows over the past three years and a
continued build-up in 2019, according to data compiled by Bloomberg.
Current assets are about 1,000 tons higher than the post financial
crisis nadir of 1,425.1 tons.
Gold has surged this year as investors seek protection from slowing
global growth, the incessant trade war, and turmoil in the bond market
that suggests the U.S. may be headed for another recession. The rise has
been aided by a rate cut from the Federal Reserve and expectations more
will soon follow. This week, veteran investor Mark Mobius gave a
blanket endorsement to buying bullion, saying accumulating the precious
metal will reap long-term rewards.
Others are also bullish. Goldman Sachs Group Inc. has said prices will climb
to $1,600 an ounce over the next six months. The bank’s global head of
commodities research, Jeffrey Currie, said that gains are likely be
fueled by demand for ETFs as well as increased central-bank purchases.
Spot gold traded at about $1,500 on Thursday, up 17% this year.
Posted by AGORACOM
at 9:21 AM on Thursday, August 22nd, 2019
SPONSOR: Applied Biosciences Corp. is a vertically integrated company focused on the development of science-driven cannabinoid therapeutics and biopharmaceuticals, as well as state-of-the-art testing and analytics. As a leading company in the CBD, Pet and Health and Wellness space, the company is currently shipping to the majority of US states as well as to 5 International countries. Click Here for More Info
Athletes and competitors continually push their bodies. But, in order
to get best results, their bodies also need to recover properly.
Regardless of whether the athlete is a regular gym goer, a weekend
warrior, or a pro athlete, recovery is crucial to avoid injuries and
ensure maximum performance.
As a result, many athletes are looking for solutions that can help
improve their post-workout recovery. One interesting option for athletes
is CBD. In this post, we will highlight the use of CBD as a sports
recovery tool and the research supporting it. By the end of this
article, you will understand why many athletes are adding CBD to their
workout recovery routine.
Understanding How CBD Can Help Athletes
CBD, also called cannabidiol, is a natural chemical found in cannabis
plants (hemp or marijuana). But, CBD will not get you high. The high
that is often associated with marijuana actually comes from a different
chemical in the cannabis plant: tetrahydrocannabinol (THC). The World Health Organization recognizes that CBD is non-toxic, non-addicting, and generally safe.
The evidence for the benefits of using CBD is still in the early stages but is starting to stack up with over 11,000 published medical and scientific studies. How can CBD help athletes during their workout and for competitive performance.
Inflammation/Pain
A study published in the journal Bioorganic & Medicinal Chemistry1
shows that CBD has anti-inflammatory properties and plays a role in
helping with pain management. This can be beneficial after an intense
workout. The pain or soreness that athletes feel when their muscles are
fatigued is often a result of microscopic muscle tears and inflammation.
This micro-tearing is an important part of muscle growth as it allows
the body to increase strength by increasing the size of muscles. CBD may
help reduce this inflammation and better prepare the body for another
workout.
In addition, when a muscle becomes sore, it can signal that the body
needs to restrict muscle contraction as a defense mechanism to prevent
muscle damage. Although this response is natural and normally healthy,
it can be detrimental to athletic performance. By helping moderate the
signals sent through the body, CBD oil can manage the body’s reactions
for muscle contraction, muscle tightness, and cramps.2
Sleep
A good night’s sleep and ample rest are vital for sports recovery and
good performance. Sleep gives the body a chance to regenerate and
repair damaged muscle fibers. Research studies on CBD also demonstrate
that it helps moderate sleep routines for improved sleep quality and
duration.3
Mental Health
The importance of focus and attention while playing a sport is a
no-brainer. Some people take pre-workout supplements with high amounts
of caffeine to help improve focus. But, CBD can also help increase focus
by reducing stress/anxiety.
CBD has been shown to have anti-anxiety properties that moderate the
body’s reaction to stress.4 This is important because the body can
perceive intense muscle exertion during a workout as a sign of stress.
This can trigger the stress hormone, cortisol, which signals the body to
reduce protein synthesis. Thankfully, according to a 2016 study, CBD
can increase the presence of chemicals such as serotonin to help manage
the body’s reactions to stress.5
Is CBD a Banned Substance for Sports?
With these great benefits, an important question arises for
competitive athletes. Is it classified as a performance enhancer by
major sports regulatory bodies?
No. CBD is typically not banned from sports competition. In January 2019, the World Anti-Doping Agency (WADA) released its updated list of prohibited substances. The report
did not include CBD on this list, setting the pace for other regulatory
bodies, including the U.S. Anti-Doping Agency (USADA), to do the same.
This has also enabled many athletes to switch to using CBD for swelling
and inflammation rather than other options like ibuprofen, because they
may experience less adverse side effects with CBD.6
Are Professional Athletes Taking CBD?
Until recently, there has been a stigma in sports surrounding the use
of CBD. However, this is changing as top athletes publicly talk about
their use of CBD products and the improvements they see in their
recovery and performance. Below are some of the major athletes who are
endorsing the benefits of CBD:
CBD can be useful for improved physical or athletic performance.
There is early evidence to support that CBD may help with better and
easier recovery after intense physical exertion by reducing
inflammation, managing pain, aiding in sleep, and reducing stress.
Athletes looking to improve their workout recovery and athletic
performance may find it worth considering taking CBD.
Posted by AGORACOM
at 2:40 PM on Wednesday, August 21st, 2019
SPONSOR: Gratomic Inc. (TSX-V: GRAT) Advanced materials company focused on mine to market commercialization of graphite products, most notably high value graphene based components for a range of mass market products. Collaborating with Perpetuus, Gratomic will use Aukam graphite to manufacture graphene products for commercialization on an industrial scale. For More Info Click Here
Smartphones and portable electronic devices are omnipresent in the
world we live in today. We rely heavily on these gadgets to complete a
wide range of daily tasks from simple reminders and calendar events to
more complex assignments and applications as powerful business tools.
At some point in the day, we will find ourselves rushing around a
room searching for a plug or USB socket as a cable dangles from our
hands because the lithium-ion batteries that currently power our devices
still only hold a limited charge.
However, frustrations such as this could soon be a thing of the past.
According to the reliable tech-tipster Evan Blass, Samsung is gearing
up to a 2021 launch of their usually hotly anticipated Galaxy series to
come equipped with a more efficient longer-lasting graphene battery.
On Monday, Evan Blass tweeted, “Samsung is hoping to have at
least one handset either next year or in 2021, I’m told, which will
feature a graphene battery instead.â€
Capable of a full charge in under a half-hour, they still need to raise capacities while lowering costs.
Evan Blass
Graphene batteries are believed to be the optimal solution and
alternative to the current generation of lithium-ion batteries on the
market. With higher electrical and heat conductivity compared to
lithium-ion solutions, graphene is also superior due to its lightweight,
flexible and durable qualities. For these reasons, we can begin to
understand why graphene has been hailed as a ‘wonder material’.
So, what would be the benefits of using the material graphene as an alternative to lithium-ion in battery packs?
Slimline solutions: having already discussed how
graphene is lightweight, we should also consider that when you stack 3
million layers of this material, it only amounts to 1 mm of thickness.
This could mean that manufacturers can place small high-capacity
batteries in devices to reduce the overall size of the device for
compactness or enhance other capabilities and overall performance.
Faster charging times: this increases the battery
endurance compared to lithium-ion batteries as the conductivity
capabilities of graphene offers little to no resistance to the flow of
electrons.
Reduced thermal output: because of its ability to
dissipate heat much more effectively, graphene can reduce the operating
temperature of smart devices. This means better performance and safety
when charging or operating the device for complex tasks or gaming.
These may be of particular interest to a company like Samsung who
have previously been affected by battery issues, particularly concerning
the overheating issues of the Note7 back in 2016. This led to Samsung
implementing an eight-point inspection process for batteries as well as
stepping up its research into battery technology, making significant
progress in recent years.
We need only look back to 2017 when Samsung revealed its researchers developed a “graphene ball†material capable of five times faster-charging speeds
than standard lithium-ion batteries. Coupled with Blass’s latest
claims, it is plausible to expect that we will see graphene batteries go
mainstream within the next couple of years.
With products likely restricted to select smartphones and smart
devices initially, we can also anticipate further developments on other
applications for graphene in the coming years. For example, Tesla are
showing interest in metal-air batteries which utilize a graphene rod as a
cathode. These types of battery can increase battery efficiency up to
five times at just one-third of the cost and because of the greater
abundance of carbon, compared to a rare metal like lithium,
manufacturers will continue to research its potential as they have been
trying to implement the use of graphene as a material in about
everything since its discovery in 2004.
So, it would suffice to say that graphene batteries are definitely
set to be a game-changer and put an end to panicked searches for a place
to charge devices or carrying around multiple charging packs to get
through a busy day.
Posted by AGORACOM
at 12:30 PM on Wednesday, August 21st, 2019
Discovery of gold enriched zone near high grade (8,973ppb) soil sample at Ashuanipi, Labrador
Defined by gold in soil and rock samples that cover an area of 450 metres by 450 metres
Results of ground VLF-Magnetic survey over the area are pending
Drill testing of zone expected in fall
VANCOUVER, British Columbia, Aug. 21, 2019 (GLOBE NEWSWIRE) —
Labrador Gold Corp. (TSX-V: LAB) (“Labrador Gold†or the “Companyâ€) is
pleased to announce that it has delineated a new gold enriched zone near
the site of a high grade soil sample at its Ashuanipi project in
western Labrador.
The initial program at Ashuanipi this year continued our systematic
approach of detailed geological mapping, rock and soil sampling and
ground magnetics/VLF-EM (very low frequency electromagnetics) to follow
up on specific areas to generate targets for drilling in the fall. In
particular, infill soil sampling allowed us to define an anomalous gold
zone near the site of a soil sample taken in 2018 that assayed 8,973ppb
gold.
The anomalous zone measures approximately 450 metres by 450 metres
and is defined by soil samples ranging from below detection up to
1,190ppb gold, in addition to the previous high-grade sample, and rock
samples from below detection up to 2,353 ppb Au (2.35g/t). The 2.35g/t
rock sample lies approximately 450m northwest of the high-grade soil
sample within a 200m by 100m gold in soil anomaly with values ranging
from 40ppb to 778ppb gold. The area was also covered by a ground
magnetic and VLF-EM (Very low frequency electromagnetic) survey, the
data from which is currently being processed.
A second area also shows potential, with rock samples grading from
below detection to 0.68g/t gold and 10 samples showing values greater
than 0.1g/t gold over an area of 200m by 120m within a larger anomalous
area of gold in soil. The gold mineralization is associated with
garnet-bearing gossanous gneiss. Further work in the area, including
detailed soil sampling and a VLF-magnetic survey will enable better
definition of the anomalous zone. Maps of the two zones can be found at www.labradorgold.com/portfolio/ashuanipi/.
“Our systematic approach to exploration of district scale anomalies
at Ashuanipi has allowed us to quickly identify favourable areas for
gold mineralization along these trends,†said Roger Moss, President and
Chief Executive Officer of Labrador Gold. “We look forward to the
results of the magnetic – VLF-EM survey that will allow us to further
refine our drill targets for the fall.â€
The 2019 exploration program at Ashuanipi is designed to follow up on
successful results of 2017 and 2018 work that outlined district scale
gold anomalies. To date the company has collected 13,184 soil samples,
752 lake sediment samples and 138 rock samples over the 896 square
kilometre property.
“Our 2019 program confirms and reinforces the thought that the large
regional (20 by 25 km) gold in lake sediment anomaly (greater than the
99th percentile) covering the Ashuanipi north claim block is real. The
anomaly, derived from GSC data (Open File 8348), is the largest and most
robust in the entire northern Quebec and Labrador,†said Shawn Ryan,
Technical Advisor to Labrador Gold. “We are the first exploration
company to give this anomaly a good look and start to explain this new
mineralized system. As we continue our systematic exploration approach
over the property, we should uncover more gold mineralization over the
15-kilometre gold in soil anomaly outlined during the 2018 exploration
program.â€
All samples were shipped to the Bureau Veritas preparation laboratory
in Timmins, Ontario, where rocks were crushed and split and a 500g sub
sample pulverized to 200 mesh. Pulps were sent to the Vancouver
laboratory for assay. Samples of 30g were analyzed for gold by fire
assay with an atomic absorption finish and another 15g sample for 36
elements by ultratrace ICP-MS (inductively coupled plasma-mass
spectrometry) following an aqua regia digestion. Soil samples are dried
and sieved to -80 mesh followed by aqua regia digestion and ICP-MS/ES
assay. In addition to the QA-QC conducted by the laboratory, the Company
routinely submits blanks, field duplicates and certified reference
standards with batches of samples to monitor the quality of the
analyses.
Roger Moss, PhD., P.Geo., is the qualified person responsible for all technical information in this release.
About Labrador Gold:
Labrador Gold is a Canadian based mineral exploration company focused
on the acquisition and exploration of prospective gold projects in the
Americas. In 2017 Labrador Gold signed a Letter of Intent under which
the Company has the option to acquire 100% of the 896 square kilometre
(km2) Ashuanipi property in northwest Labrador and the Hopedale (458
km2) property in eastern Labrador.
The Hopedale property covers much of the Hunt River and Florence Lake
greenstone belts that stretch over 80 km. The belts are typical of
greenstone belts around the world but have been underexplored by
comparison. Initial work by Labrador Gold during 2017 show gold
anomalies in soils and lake sediments over a 3 kilometre section of the
northern portion of the Florence Lake greenstone belt in the vicinity of
the known Thurber Dog gold showing where grab samples assayed up to
7.8g/t gold. In addition, anomalous gold in soil and lake sediment
samples occur over approximately 40 kilometres along the southern
section of the greenstone belt (see news release dated January 25th 2018
for more details). Labrador Gold now controls approximately 57km strike
length of the Florence Lake Greenstone Belt.
The Ashuanipi gold project is located just 35 km from the historical
iron ore mining community of Schefferville, which is linked by rail to
the port of Sept Iles, Quebec in the south. The claim blocks cover large
lake sediment gold anomalies that, with the exception of local
prospecting, have not seen a systematic modern day exploration program.
Results of the 2017 reconnaissance exploration program following up the
lake sediment anomalies show gold anomalies in soils and lake sediments
over a 15 kilometre long by 2 to 6 kilometre wide north-south trend and
over a 14 kilometre long by 2 to 4 kilometre wide east-west trend. The
anomalies appear to be broadly associated with magnetic highs and do not
show any correlation with specific rock types on a regional scale (see
news release dated January 18th 2018). This suggests a possible
structural control on the localization of the gold anomalies. Historical
work 30 km north on the Quebec side led to gold intersections of up to
2.23 grams per tonne (g/t) Au over 19.55 metres (not true width)
(Source: IOS Services Geoscientifiques, 2012, Exploration and geological
reconnaissance work in the Goodwood River Area, Sheffor Project, Summer
Field Season 2011). Gold in both areas appears to be associated with
similar rock types.
The Company has 56,264,022 common shares issued and outstanding and trades on the TSX Venture Exchange under the symbol LAB.
Posted by AGORACOM
at 10:23 AM on Tuesday, August 20th, 2019
SPONSOR: ZEN Graphene Solutions: An emerging advanced materials and graphene development company with a focus on new solutions using pure graphene and other two-dimensional materials. Our competitive advantage relies on the unique qualities of our multi-decade supply of precursor materials in the Albany Graphite Deposit. Independent labs in Japan, UK, Israel, USA and Canada confirm this. Click here for more information
Increasing demand for lightweight, versatile and renewable products with lengthy lifespan are a few variables driving worldwide graphene market growth.
Nanotechnology demand in the electronic products sector also pumps
graphene market growth. The global energy market is shifting towards
clean energy sources, which in turn drives demand for products with
greater effectiveness.
Products like solar panels can improve battery efficiency by using
graphene, another driving factor for the worldwide graphene industry.
Other types of graphene such as graphene oxide (GO) are one of the types
of graphene that drive graphene market growth in areas such as North
America as applied to electronic instruments, catalytic oxidation,
biotechnology, and others.
Due to its flammable nature, graphene needs unique processing,
regulatory compliance for flammable goods are few other considerations
restricting graphene production. Because of its diverse spectrum of
characteristics, product innovations as well as new applications
findings of graphene by significant producers in electronics sectors are
performed. Lack of mass production and high-priced machinery, however,
are few considerations that restrain worldwide graphene development.
Increasing investment in brand research and development will drive
worldwide graphene market growth throughout the prediction time frame. A
two-dimensional transparent carbon allotrope discovered in 2004. The
item resistance surpasses steel almost 200 times and is a very useful
heat and electricity conductor. Product-related characteristics such as
outstanding thermal resistance, elevated electron motion and
permeability have led in increased use in many apps such as consumer
electronics, supercapacitors, RFID equipment, composites, detectors,
coatings, conductive inks, etc. Product-based research journals rose to
over 9,000 in 2013, from just over 125 in 2005. It will boost business
development as growing sector study operations will lead to multiple
fresh consumer apps.
Due to its distinctive features and broad variety of applications,
R&D expenditure on the industry has risen considerably. The European
Commission invested around $1.4 billion in the Graphene Flagship
initiative to increase market growth, resulting in consumer development
and fresh apps. Private businesses from multiple sectors including
specialty chemicals, consumer electronics, steel and energy also invest
in research and development operations to preserve their competitive
market benefit. American and Chinese entities have over 1,750 and 200
patents respectively on product and its various uses. These developments
have led in fresh consumer apps like graphene-based transistors,
detectors, conductive movie, etc. and will drive consumer demand
throughout the time frame prediction.
High material-related manufacturing costs may hinder worldwide market
growth in the future. Product marketing is hampered by costly and
complicated manufacturing procedures. Furthermore, standard
manufacturing procedures have negative economic and health impacts,
which could hinder item supply throughout the prediction time frame as
it could lead to better alternatives in the future.
Asia Pacific is anticipated to experience the highest demand
development over the forecast period. Booming electronics was a
significant factor driving regional product supply. Increasing
investment in renewable energy generation is also anticipated to
increase demand in the future. China is anticipated to emerge as a
successful economy over the forecast period, given favourable public
assistance for manufacturing sector investment. China’s state has placed
forward powerful measures to promote research and growth. The state has
created a domestic graphene park, which contributes to the region’s
quantity of material manufacturing.
According to Acumen Research and Consulting, the global graphene market
is estimated to grow at CAGR above 38.2% over the forecast time frame
and reach the market value around US$ 552.6 million by 2026.
Key Players & Strategies
The worldwide graphene industry is semi-consolidated among the top
few. With ongoing and active research and graphene growth for fresh and
developing apps, many fresh competitors are entering the industry,
leading to a divided industry among tiny but powerful competitors. Some
vital players in the graphene market include Global Graphene Group, XG
Sciences Inc., Sixth Element (Changzhou) Materials Technology Co. Ltd.,
Ningbo Morsh Technology, and Perpetuus Advanced Materials, among others.