Posted by AGORACOM
at 4:33 PM on Monday, January 13th, 2020
SPONSOR: Labrador Gold – Two successful gold explorers lead the way in the Labrador gold rush targeting the under-explored gold potential of the province. Exploration has already outlined district scale gold on two projects, including a 40km strike length of the Florence Lake greenstone belt, one of two greenstone belts `covered by the Hopedale Project. Click Here for More Info
It has been a week of surprises since the last updates were posted.
First, I had not expected Iran to retaliate following the murder of its
top General by a US drone, but it did, despite the risks, as it was
politically necessary to assuage the extreme anger of its population who
demanded revenge. The next surprise was that Israel and the US did not
use this retaliation as an excuse to bomb Iran back to the Stone Age,
which is what they really want to do. As we know, the long-term goal of
Israel and the US is to subjugate Iran, and they will not stop until
they attain this goal, and so it goes on. It appears that there was a
bit of theater involved in Iran’s retaliation, as it clandestinely
signaled its intentions which allowed US forces to get out of harm’s
way. Perhaps US forces did not then launch a blitzkrieg out of
consideration for this courtesy.
Regardless of the muddled and unpredictable fundamental situation,
which included the accidental downing of a passenger plane by Iranian
defensive missile batteries, the charts allowed us to make a reasonably
accurate prediction regarding what was likely to happen to the gold
price. The call for a near-term top in the PM sector made on the site on
Monday looked incorrect the following evening when gold suddenly surged
about $35 on news of the retaliatory Iranian missile strike, but when
it later became apparent that there were, strangely, no US troop
casualties and no further action against Iran, gold and silver reversed
dramatically and dropped quite hard as the tension then looked set to
ease, at least over the short-term. Technically what happened is that
gold pushed quite deep into heavy overhead resistance, becoming very
overbought at a time when COTs were showing extreme readings, and was
thus vulnerable to a sudden reversal. The action around this time
illustrates an important point, which is that when gold rises due to
sudden geopolitical developments, the gains tend not to stick – what
really matters and is the big driver for gold at this time is the insane
monetary expansion that is going on, which is being undertaken in a
desperate attempt to postpone the systemic implosion that is baked in
for as long as possible. As we have already observed in these updates in
recent weeks, gold is already in a raging bullmarket against a wide
variety of currencies, and it won’t be all that long before it’s in a
raging bullmarket against the dollar too, as the Fed sets the stage for
hyperinflation.
There are two big and compelling reasons for the US government to
tank the dollar. One is that it makes US exporters more competitive, and
the other is that it can use the mechanism of inflation to wipe clean
its colossal debts, by paying them off in devalued coin, printing vast
amounts of money to pay them off, in the process legally swindling the
foolish creditors out of their dues. This is precisely what the Weimar
Republic in Germany did in 1923 to eliminate the unfair reparations
imposed by the Treaty of Versailles, which were unfair also because
Germany didn’t start the 1st World War – it was tricked into it by the
allies, because the British Empire was scared of Germany’s rising
industrial and military might and wanted to destroy it, 100 plus years
of propaganda lies about Germany being responsible for the 1st World War
notwithstanding.
We’ll look at the dollar a little later. First we will review gold’s charts, starting with the 10-year chart.
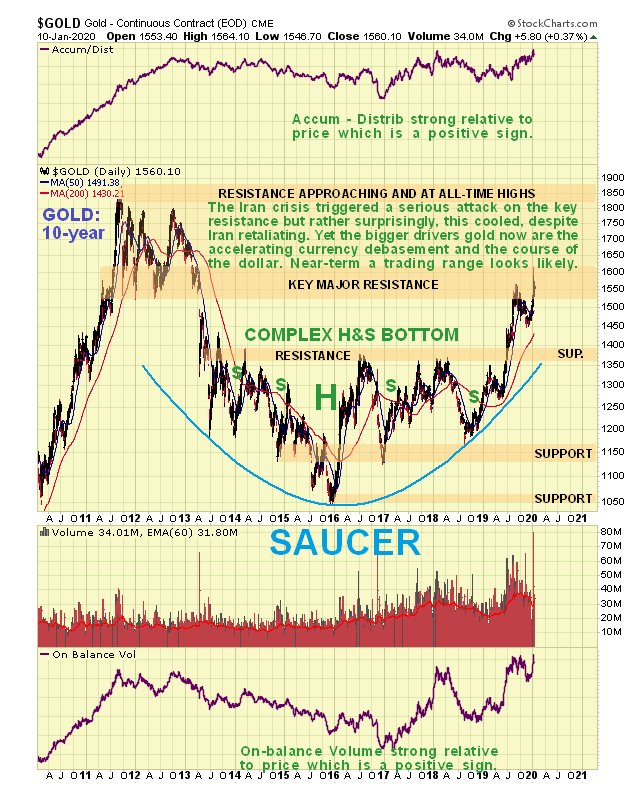
On the 10-year chart we see that gold is now a bullmarket, even
against the dollar, and is currently challenging the heavy resistance
arising from the 2011 – 2013 top area. The second attack on this
resistance in the space of few months got further because of the Iran
crisis, and if this cools any more short-term, it will probably lead to
gold settling into a trading range before it mounts a more successful
attack on this resistance. A point to note here is that while the
resistance up to the 2011 highs in the $1800 area looks like a major
obstacle, it’s not such a big deal as many think, given the rate at
which the dollar is now being debased.
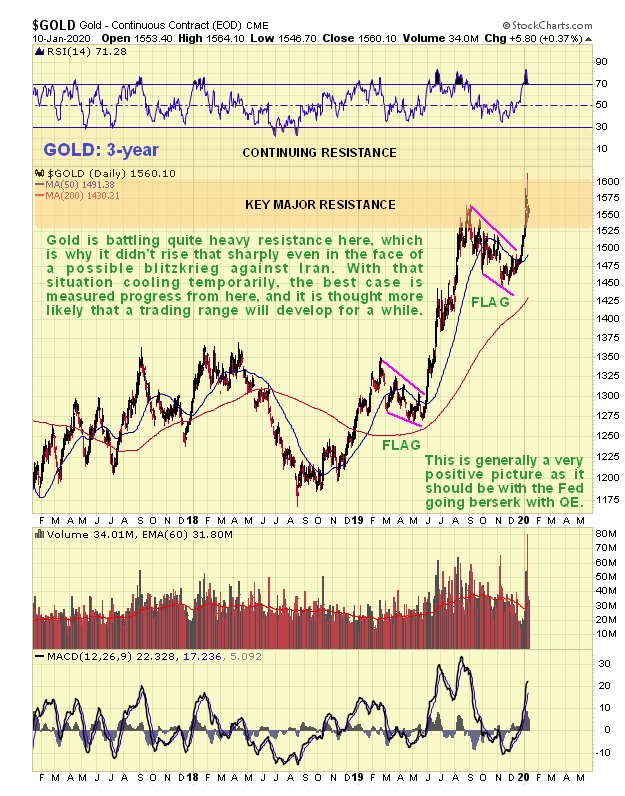
This week it’s worth also taking a quick look at a 3-year chart
for added perspective. This chart shows us that since the bullmarket
started in mid-Summer, we have seen 3 sharp runups punctuated by 2 bull
Flags. While the 2nd of these Flags targets the $1800 area, we have to
factor in that gold now has much more overhanging supply to contend with
than on the 1st runup, and this, coupled with quite extreme COT
readings, inclines to the view that this will need to be worked off.
Hence the interpretation that it will probably need to consolidate for a
while before it makes significant further progress, although it
obviously won’t if the US starts a serious bombing campaign against
Iran. The Fed’s increasingly manic money printing will eventually drive
it higher, of course
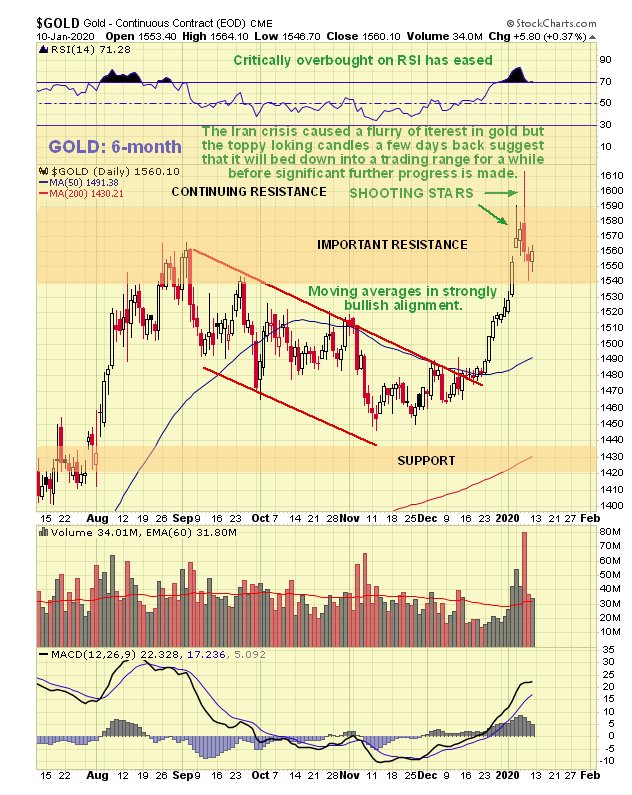
On the 6-month chart we can see the interesting price action
around the Iran crisis over the past week or so. A bearish “shooting
star†appeared on the chart last Monday, which we took as a sign that gold was forming a short-term top,
but then overnight on the 7th to the 8th it surged briefly above $1610
when Iran lobbed missiles at US bases in Iraq, which had many
concluding, not unnaturally that this would trigger a major Israel – US
bombing campaign. When it became apparent that there were no casualties
from the Iranian attack and no US counter strike, tensions quickly
cooled and gold lost ground fast the next day, putting in a big
high-volume reversal candle, approximating to another “shooting starâ€.
Normally such action is followed by a retreat at least for a while, and
some stocks, like silver stock Coeur Mining (CDE), that we ditched a
while ago, got clobbered. This is why gold is expected to settle down
into a trading range for a while before mounting another attack on the
resistance.
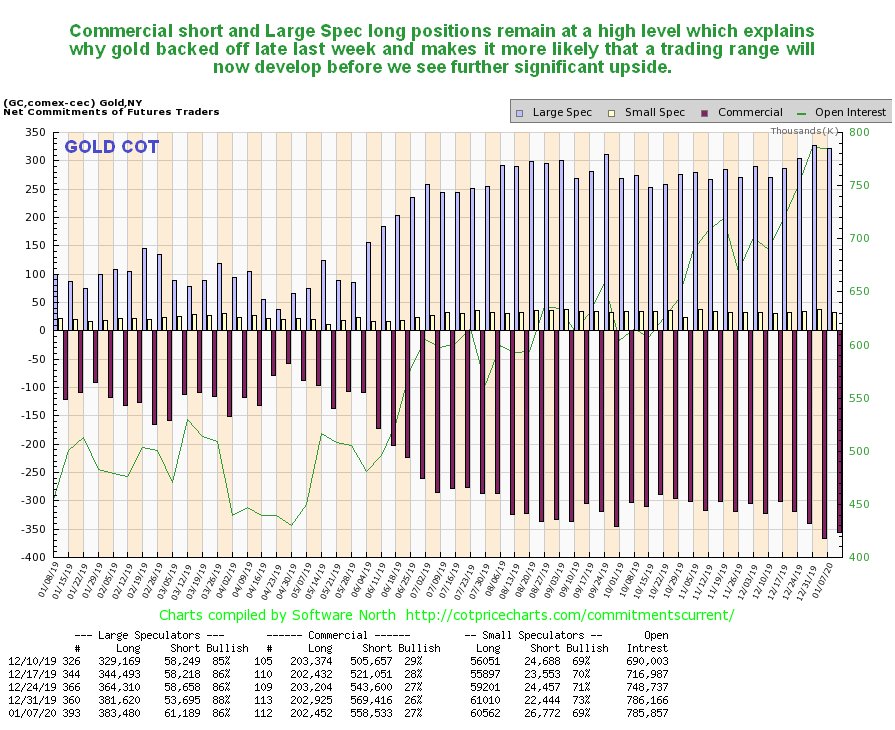
Another factor suggesting that gold will consolidate / react
back for a while is the latest COT, which shows still very high
Commercial short and Large Spec long positions…
Click on chart to popup a larger, clearer version.
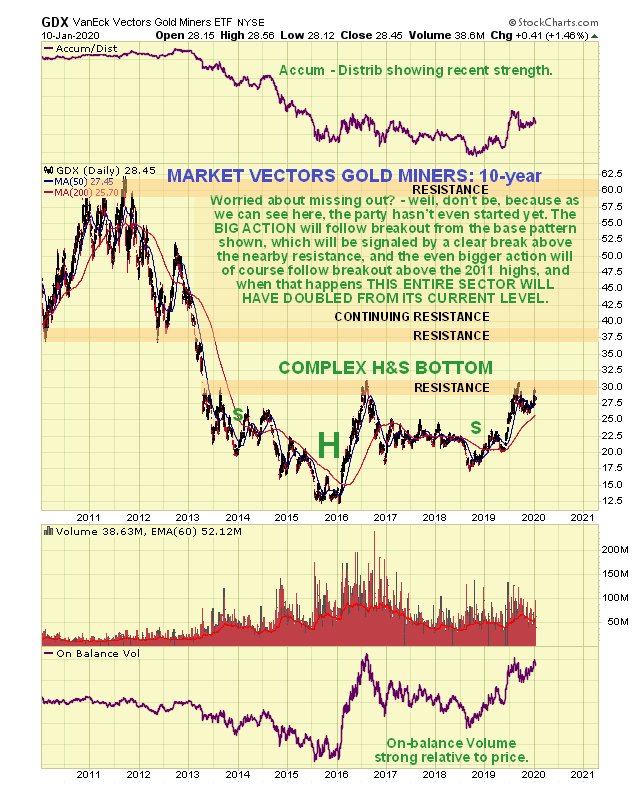
What about Precious Metals stocks? The latest 10-year chart for
GDX shows that we still have most everything to look forward to, for
despite the rally from the middle of last year, it still hasn’t broken
out of the giant complex Head-and-Shoulders bottom that has been formed
since way back early in 2013. A breakout above the nearby resistance
should lead to a rapid ascent to the next resistance level at the
underside of a large top pattern, and thereafter it will have to work
its way through continuing resistance up to its highs. The strength of
the volume indicators in the recent past are a sign that it “means
businessâ€.
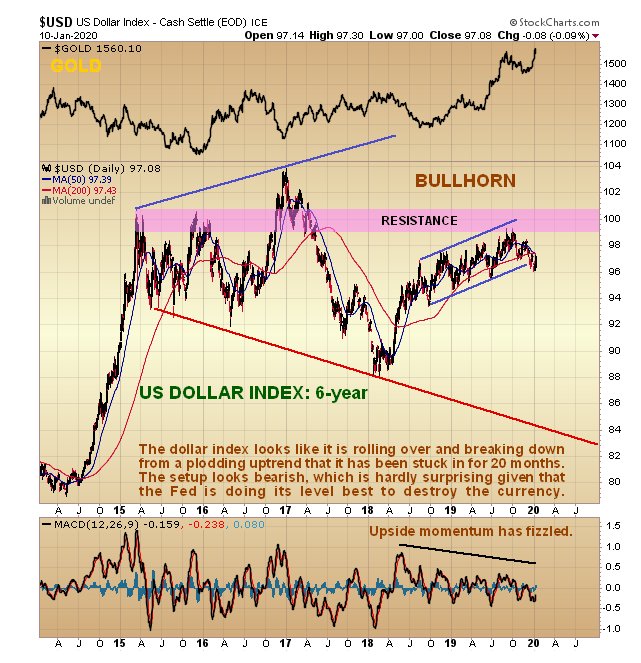
Now we turn our attention to the dollar, which is looking
increasingly frail as we can see on the latest 6-year chart for the
dollar index. It is rolling over beneath resistance and appears to be
breaking down from the 16-month gentle uptrend shown. This is of course
the main reason that gold, shown at the top of this chart, has been
breaking higher again. If it fails to hold up here it could be targeting
the lower boundary of the bullhorn pattern, which would involve a heavy
drop from the current level that would “light a fire†under the
Precious Metals, and many other commodities, notably copper.
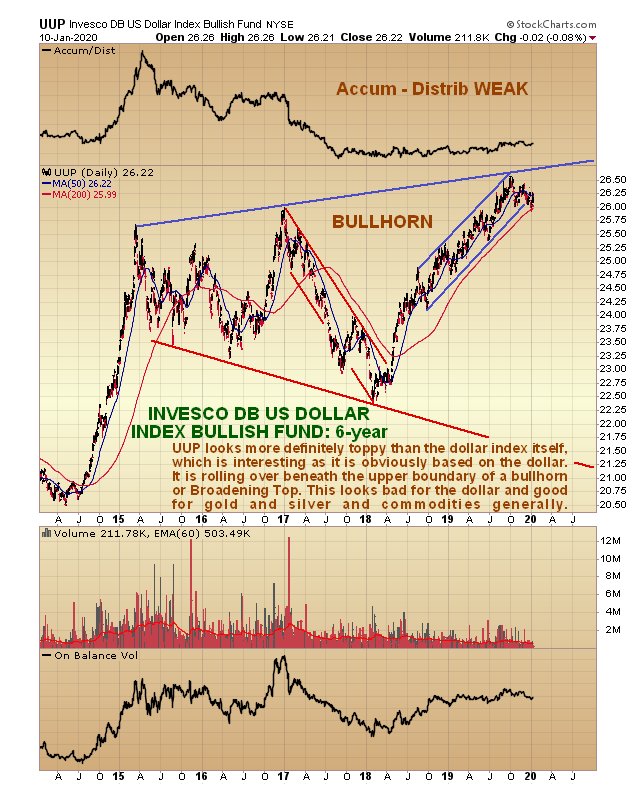
A chart that really gives the game away and calls time on the
dollar is the 6-year chart for dollar proxy UUP. As we can see, unlike
the dollar index itself, this has risen up to the upper boundary of its
giant bullhorn pattern and appears to be on the point of breaking down.
Its Accumulation line has been very weak. This chart suggests that the
dollar could be in for a very rough ride before long, which is hardly
surprising considering the lengths to which the Federal Reserve is going
to destroy it. While other countries and trading blocs, most notably
the EU, are making a valiant attempt to destroy their own currencies,
they will be hard put to keep up with the Fed.
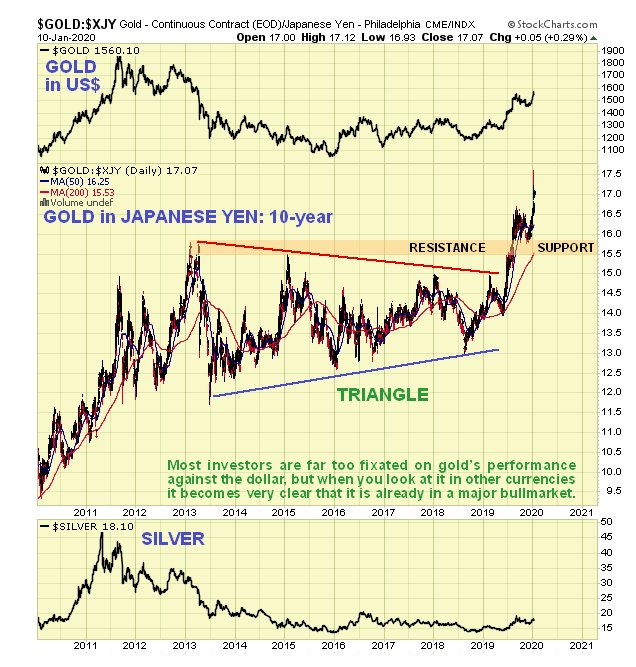
And now, for the benefit of anyone who still doubts that gold is
in a bullmarket, I have pleasure in presenting the following 6-year
chart for gold against the Japanese Yen…
Still think gold might be in bearmarket? – no – didn’t think you would.
Although you can never be 100% sure of anything with these
smaller issues, I am sure that you will agree with me that this chart is
not suggestive of a sector that is going anywhere but up.
Conclusion: although last week’s reversal candle and the current rather extreme COT structure mean that gold may react back more near-term, the overall picture is strongly bullish, which is hardly surprising as the fiat money system is fast approaching its nemesis, with the line of least resistance leading to hyperinflation. Our general approach therefore is not to sell PM sector investments, except on a case by case basis where they become critically overbought, but instead buy or add to positions on dips.
Posted by AGORACOM-JC
at 1:00 PM on Monday, January 13th, 2020
SPONSOR: Spyder Cannabis (SPDR:TSXV) An established chain of high-end vape stores. Aggressive expansion plan is already in place that will focus on Canadian retail and US Hemp derived kiosks in high traffic areas. Click here for more info.
DOPE! New cannabis compound 30 TIMES more potent than THC found in one marijuana variety
Compound is one of two newfound cannabinoids that have been discovered in the Cannabis plant glands of the sativa L species.
A NEW cannabis compound has been discovered and it may be 30 times more potent than THC.
Scientists aren’t yet sure whether the compound causes a high or has
medical benefits so they’ve been conducting tests to try and figure this
out.
The compound is one of two newfound cannabinoids that have been discovered in the Cannabis plant glands of the sativa L species.
Cannabinoids is the collective term for the group of diverse chemical
compounds that act on the cannabinoid receptors of the brain.
THC is just one of these cannabinoids and it’s currently considered to be the principal psychoactive component of cannabis.
THC, or tetrahydrocannabinol, plugs into brain receptors and can
alter our ability to co-ordinate movements, reason, record memories and
perceive things like time and pleasure.
THC in cannabis is what can give smokers a high feelingCredit: Getty – Contributor
It’s thought that cannabis contains over 140 similar chemicals that can interact with receptors all over the body.
However, THC is currently the only one we know can result in a high spaced out feeling.
Of the two new cannabinoids discovered, one looks similar to the compound CBD, which isn’t psychoactive.
The other appears similar to THC but may even produce stronger mind-bending effects.
This THC lookalike is called tetrahydrocannabiphorol (THCP).
Recent research suggests that it interacts with the same brain receptor as THC but has slight differences in its chain of atoms.
The slight difference in shape of THCP means it can technically fit more snugly into its preferred brain receptor than THC.
A test showed that the compound can actually bind 30 times more reliably than THC.
When given to lab mice, the THCP made them behave as if they were on THC with slower movements and decreased reactions to pain.
The mice reached this state with a much lower does than would have been required with THC meaning the new compound is stronger.
However, this lab experiment still doesn’t mean that the same effect would happen in humans.
THCP doesn’t appear to be present in large amounts in cannabis plants
but even if it was, increased psychoactive properties would still not
be guaranteed.
Posted by AGORACOM-JC
at 9:00 PM on Sunday, January 12th, 2020
SPONSOR: PRIMO NUTRACEUTICALS INC.
(CSE: PRMO) (OTC: BUGVF) (FSE: 8BV) (DEU: 8BV) (MUN: 8BV) (STU: 8BV)
provides strategic capital to the thriving cannabis cultivation
sector through ownership and development of commercial real estate
properties. The company also offers fully built out turnkey facilities
equipped with state-of-the-art growing infrastructure to cannabis
growers and processors. Click here for more info.
2020 could be a defining year for the cannabis industry
“There’s going to be a lot of movement in 2020,” said Chris Walsh, chief executive officer of Marijuana Business Daily, a cannabis industry trade publication. “Whether it leads to actual legalization in some states remains to be seen.”
New York (CNN Business)2019 was a momentous year for the cannabis industry: Hemp-derived CBD had a heyday, Illinois made history, California got sticky, vapes were flung into flux, and North American cannabis companies received some harsh wake-up calls.
2020 is gearing up to be an even more critical year.
There’s a well-worn saying in the cannabis business that the
emerging industry is so fast-moving that it lives in dog years. 2020 is
barely a week old, and cannabis is already making headlines after
Illinois kicked off the new year
with recreational sales. Other states are inching closer to
legalization this year — with several mulling how best to ensure social
equity. Also in 2020, there’s the FDA could chill the CBD craze, and a move from Congress could change the game entirely.
The tumultuous past few months have set 2020 up to be a
make-or-break year for some of the biggest in the business as well as
the scores of lesser-known players priming to make their moves.
“There’s going to be a lot of movement in 2020,” said Chris Walsh,
chief executive officer of Marijuana Business Daily, a cannabis industry
trade publication. “Whether it leads to actual legalization in some
states remains to be seen.”
The next US states to legalize cannabis
Fourteen US states and territories have legalized recreational
cannabis sales for adults (although regulations aren’t fully fleshed out
in places like the District of Columbia and Vermont). A total of 33 states have legalized cannabis for medical purposes. Illinois
will remain in focus, after it made history last year with the first
legislatively-enacted recreational cannabis program. Critical aspects of
its program include social equity and social justice measures created
to help people and communities most harmed by the War on Drugs.
“Underserved groups are holding the industry accountable,” said Gia
Morón, executive vice president for Women Grow, a company founded to
further the presence of women in the cannabis industry. “And our
legislators are recognizing that [social, gender and minority concerns]
are a part of this now.”
New York and New Jersey have been flirting with legalization but
have held off to navigate some logistics related to aspects that include
social equity. The governors of New York, New Jersey, Connecticut and
Pennsylvania convened this past fall for a summit on coordinating cannabis and vaping policies. New Jersey is putting a recreational cannabis measure before voters in November, and Gov. Andrew Cuomo vowed Wednesday that New York would legalize cannabis this year.
Other possibilities for states to legalize recreational cannabis
could be Arizona, Delaware, Florida, Minnesota, Montana, New Mexico,
North Dakota and South Dakota, Walsh said. Even Alabama, Mississippi and
South Dakota could become new medical cannabis markets and other
states’ medical programs could see expansions, he added.
“If you look at the map right now of the US, we’re getting to the
point where there isn’t that many [states] left that can legalize,” he
said. “You can look at any of those and say there might be a chance in
the next year or two for them to legalize.”
Federal legalization
Whether national legalization is on the horizon remains to be seen, said Walsh.
How federal agencies regulate hemp, a cannabis plant with under
0.3% tetrahydrocannabinol (THC), and derivatives such as cannabidiol
(CBD) could be extremely telling for how the US government might
approach regulation of other forms of cannabis down the road, he said.
CBD products have been all the rage, but they may be on shaky
ground. CBD oils, creams, foods and beverages have seen an explosion in
availability following the passage of the 2018 Farm Bill, which
legalized hemp but left plenty of discretion to the US Food and Drug
Administration, which regulates pharmaceutical drugs, most food items,
additives and dietary supplements.
The FDA is reviewing CBD and has yet to issue formal guidance,
although the agency has issued warning letters to CBD makers that make
unsubstantiated health claims. Class action lawsuits have been filed
against several CBD companies, including two of the largest, Charlotte’s
Web and CV Sciences, alleging they engaged in misleading or deceptive
marketing practices, Stat News reported.
Cannabis insiders are closely awaiting the fate of
industry-friendly bills such as the STATES Act, which would recognize
cannabis programs at the state level, and the SAFE Banking Act,
which would allow for banks to more easily serve cannabis companies.
Those and other bills likely won’t pass in full, but it’s possible that
some language makes it into more comprehensive legislation, Walsh said.
“It feels like [legalization] has to happen soon, but it might not
happen how people think. You get a bill passed to allow banks to clearly
serve this industry without a whole bunch of restrictions, and that
could be pseudo-legalization,” Walsh said. “So, the actual move by the
federal government to ‘legalize’ marijuana or let states decide might
not come for years; but that reality might play out anyway with some
other type of legislation.”
New regulation in older markets
In addition to the promise of new markets, the evolution of
established cannabis programs could also play a significant role in the
cannabis business landscape.
In California, the world’s largest cannabis industry has developed in fits and starts.
Regulators are taking aim at an entrenched illicit market as businesses
decry tax increases and local control measures that limit distribution.
“California is going to get worse before it gets better,” Walsh said.
And in Colorado, where the nation’s first legal recreational
cannabis sale took place, a slate of new laws are poised to shift the
cannabis landscape by allowing for social consumption businesses and the
ability for out-of-state and publicly traded companies to own licenses.
New products come to Canada
Canada’s “Cannabis 2.0” roll-out
of derivative products — such as edibles, vapes and beverages — is in
its beginning stages. The Canadian publicly traded licensed producers
that have been beset by missed and slow market development have bet
heavily on these new product forms.
But it takes time for provincial and state cannabis programs to get
off the ground, for businesses to come online and for production and
supply to get in a good balance with demand. So any big returns won’t
happen immediately, said Morgan Paxhia, managing director and co-founder
of cannabis investment firm Poseidon Asset Management.
“It’s not going to look any better in Q1 and really into Q2,” he said of the Canadian cannabis sector.
‘Blockbuster failures’
Overall, 2020 should bring volatility for cannabis companies in
Canada and the United States, he said, noting the industry’s current
business cycle is mirroring that of the dot-com bubble and subsequent
burst.
“There were very good companies that have emerged from that period,
but most of the companies during that time are gone,” he said. Paxhia
expects at least one — if not several — “blockbuster failures.”
The capital constraints are expected to continue into the first leg
of 2020 as some initial bets don’t pan out for some companies, said
Andrew Freedman, Colorado’s former cannabis czar who now runs Freedman
& Koski, a firm that consults with municipalities and states
navigating legalization.
Some companies’ low points could create opportunities for other
firms and investors that waited out the first cycle, Freedman said.
“In 2020, I see that everybody will understand the economics of cannabis a little bit better,” he said.
Source: https://edition.cnn.com/2020/01/09/business/cannabis-2020-legalization/index.html
Tags: CBD, Hemp, Marijuana, stocks, tsx, tsx-v, weed Posted in All Recent Posts | Comments Off on PRIMO Nutraceuticals Inc. $PRMO.ca – 2020 could be a defining year for the #cannabis industry #CBD $CROP.ca $VP.ca NF.ca $MCOA
Posted by AGORACOM-JC
at 9:00 PM on Sunday, January 12th, 2020
SPONSOR: Tartisan Nickel (TN:CSE)
Kenbridge Property has a measured and indicated resource of 7.14
million tonnes at 0.62% nickel, 0.33% copper. Tartisan also has
interests in Peru, including a 20 percent equity stake in Eloro
Resources and 2 percent NSR in their La Victoria property. Click her for more information
Nickel demand set to rise in 2020 along with growth in electric vehicle sales
China is stepping up its efforts to be a leader in autonomous cars and is aiming for a quarter of all cars sold in the country to be new-energy vehicles by 2025
500,000 tonnes of refined nickel will be used annually in lithium-ion batteries for EVs by 2025 Â
Nickel’s demand outlook looks bright, especially from the electric vehicle sector of the automotive industry
Fastmarkets analysts estimate that
500,000 tonnes of refined nickel will be used annually in lithium-ion
batteries for EVs by 2025, up from 100,000 tonnes in 2018.
That growth in nickel consumption comes
even before the wider adoption of the nickel-cobalt-manganese (NCM)
8-1-1 battery, which the market expects to become an industry staple.
A recent report drafted by the Ministry
of Industry & Information Technology indicates that China will step
up its efforts to be a leader in autonomous cars and is aiming for a
quarter of all cars sold in the country to be new-energy vehicles [NEVs]
by 2025.
NEVs include electric cars, hybrids and fuel-cell vehicles.
Ban on nickel exports in Indonesia
In response to the risk of increasing
demand tightening local supply, the Indonesian government announced a
ban on the export of raw nickel ores, bringing the ban forward from 2022
to January 2020.
According to GlobalData director of
analysis David Kurtz, this ban is intended to produce value-added nickel
products, stimulate domestic processing of ore, and make the country a
hub for electric vehicle production.
Indonesia is the largest global producer
of nickel and a major supplier of the metal to China’s stainless steel
industry. In anticipation of the ban, Chinese producers are building up
nickel inventories.
This has increased the price of nickel
significantly, with prices at the end of September 2019 reaching more
than $16,000 per tonne, an increase of more than 60% from January.
When the ban was announced, nickel prices increased by 8.8% to reach a peak of $18,620 per tonne, the highest price since 2014.
Posted by AGORACOM
at 7:53 PM on Friday, January 10th, 2020
SPONSOR: Gratomic Inc. (TSX-V: GRAT) Advanced materials company focused on mine to market commercialization of graphite products, most notably high value graphene based components for a range of mass market products. Collaborating with Perpetuus, Gratomic will use Aukam graphite to manufacture graphene products for commercialization on an industrial scale. For More Info Click Here
“Experts say we are approaching a tipping point for graphene commercialisation”
Andy Burnham, Mayor for Greater Manchester, made a fact-finding tour
of facilities that are pioneering graphene innovation at The University
of Manchester.
The Mayor toured the Graphene Engineering Innovation Centre
(GEIC) which is an industry-facing facility specialising in the rapid
development and scale up of graphene and other 2D materials
applications.
As well as state-of-the art labs and equipment, the Mayor was also shown examples of commercialisation – including the world’s first-ever sports shoes to use graphene which has been produced by specialist sports footwear company inov-8 who are based in the North.
Andy Burnham – a running enthusiast who has previously participated
in a number of marathons – has promised to put a pair of graphene
trainers to the test and feedback his own experiences to researchers
based at The University of Manchester.
“Manchester is the home of graphene – and when you see the
brilliant work and the products now being developed with the help of the
Graphene@Manchester team it’s clear why this city-region maintains
global leadership in research and innovation around this fantastic
advanced material.”
Andy Burnham, Greater Manchester Mayor
By collaborating with graphene experts in Manchester, inov-8 has been
able to develop a graphene-enhanced rubber which they now use for
outsoles in a new range of running and fitness shoes. In testing, the
groundbreaking G-SERIES shoes have outlasted 1,000 miles and are
scientifically proven to be 50% stronger, 50% more elastic and 50%
harder wearing.
“Manchester is the home of graphene – and when you see the brilliant
work and the products now being developed with the help of the Graphene@Manchester
team it’s clear why this city-region maintains global leadership in
research and innovation around this fantastic advanced material,†said
Andy Burnham.
“I have been very impressed with the exciting model of innovation the University has pioneered in our city-region, with the Graphene Engineering Innovation Centre playing
a vital role by working with its many business partners to take
breakthrough science from the lab and apply it to real world challenges.
“And thanks to world firsts, like the graphene running shoe, the
application of graphene is now gaining real pace. In fact, the experts
say we are approaching a tipping point for graphene commercialisation –
and this is being led right here in Greater Manchester.â€
Posted by AGORACOM
at 7:38 PM on Friday, January 10th, 2020
Definitive distribution agreement to partner on the sale of
Vertical’s wollastonite from its world-class St-Onge Deposit in place.
Supplying the fast growing cannabis and hemp industries.
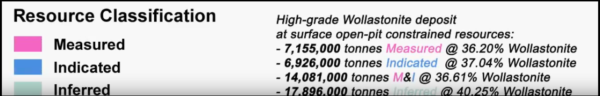
Vertical’s high quality Wollastonite has been shown to be beneficial to cannabis plants in a variety of ways
In every case the most optimal results occurred with an admixture rate of 10% to 15% wollastonite to the growth medium.
The
high-grade St-Onge Wollastonite deposit has pit-constrained mineral
resources of: 7,155,000 tonnes Measured@ 36.20% Wollastonite &
6,926,000 tonnes Indicated@ 37.04%
B.C. Buds Testing Confirmed Wollastonite is critical to marijuana growers
Engaged
AGRINOVA over the past year to conduct research and testing of
Vertical’s St-Onge wollastonite on a range of important agricultural end
uses.
WOLLASTONITE
St-Onge-Wollastonite Deposit located approximately 90 kilometres
Northwest of the city of Saguenay, in St-Onge township, in the
Saguenay-Lac-St-Jean region of Quebec, Canada.
Research and testing in the Phase 1 program for use in cannabis growth was managed and monitored by AGRINOVA, a highly-regarded Center for Research and Innovation in Agriculture in Quebec
Posted by AGORACOM
at 3:34 PM on Friday, January 10th, 2020
SPONSOR: Labrador Gold – Two successful gold explorers lead the way in the Labrador gold rush targeting the under-explored gold potential of the province. Exploration has already outlined district scale gold on two projects, including a 40km strike length of the Florence Lake greenstone belt, one of two greenstone belts covered by the Hopedale Project. Click Here for More Info
Excerpts from Crescat Capitals November Newsletter:
Precious Metals
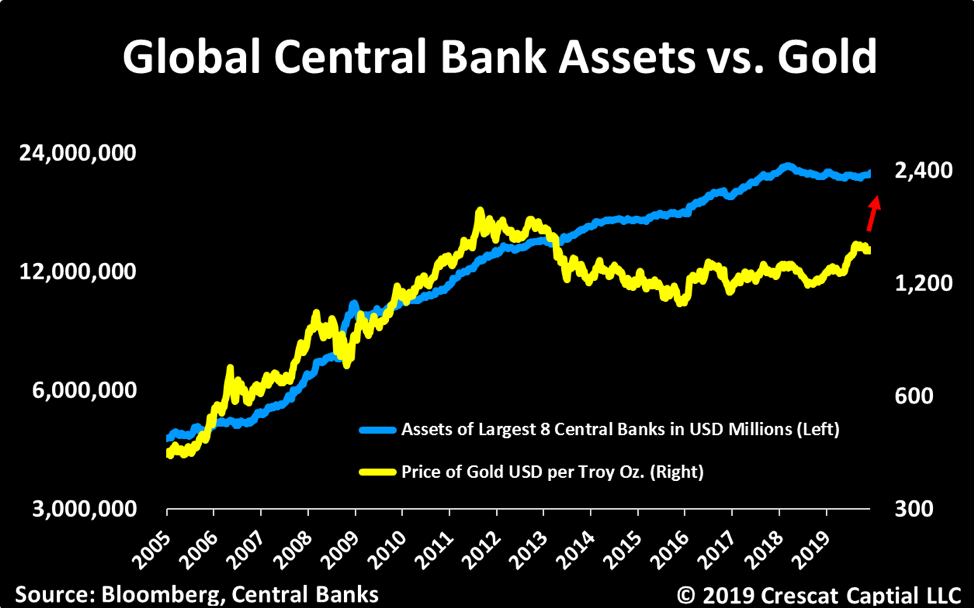
Precious metals are poised to benefit from what we consider to be the
best macro set up we’ve seen in our careers. The stars are all
aligning. We believe strongly that this time monetary policy will come
at a cost. Look in the chart below at how the new wave of global money
printing just initiated by the Fed in response to the Treasury market
funding crisis is highly likely to pull depressed gold prices up with
it.
The imbalance between historically depressed commodity prices
relative to record overvalued US stocks remains at the core of our macro
views. On the long side, we believe strongly commodities offer
tremendous upside potential on many fronts. Precious metals remain our
favorite. We view gold as the ultimate haven asset to likely outperform
in an environment of either a downturn in the business cycle, rising
global currency wars, implosion of fiat currencies backed by record
indebted government, or even a full-blown inflationary set up. These
scenarios are all possible. Our base case is that governments and
central banks will keep their pedals to the metal to attempt to fend off
credit implosion or to mop up after one has already occurred until
inflation becomes a persistent problem.
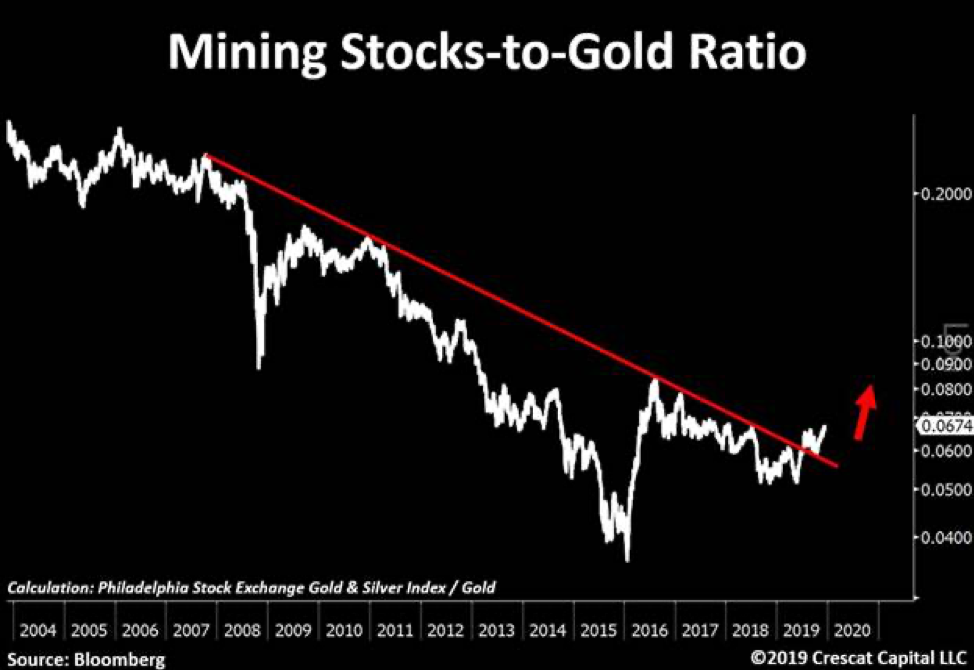
The gold and silver mining industry is precisely where we see one of
the greatest ways to express this investment thesis. These stocks have
been in a severe bear market from 2011 to 2015 and have been formed a
strong base over the last four years. They are offer and incredibly
attractive deep-value opportunity and appear to be just starting to
break out this year. We have done a deep dive in this sector and met
with over 40 different management teams this year. Combining that work
with our proprietary equity models, we are finding some of the greatest
free-cash-flow growth and value opportunities in the market today
unrivaled by any other industry. We have also found undervalued
high-quality exploration assets that will make excellent buyout
candidates.
We recently point out this 12-year breakout in mining stocks relative
to gold now looks as solid as a rock. In our view, this is just the
beginning of a major bull market for this entire industry. We encourage
investors to consider our new Crescat Precious Metals SMA strategy which
is performing extremely well this year.
Zero Discounting for Inflation Risk Today
With historic Federal debt relative to GDP and large deficits into
the future as far as the eye can see, if the global financial markets
cannot absorb the increase in Treasury debt, the Fed will be forced to
monetize it even more. The problem is that the Fed’s panic money
printing at this point in the economic cycle may hasten the unwinding of
the imbalances it is so desperate to maintain because it has perversely
fed the last-gasp melt up of speculation in already record over-valued
and extended equity and corporate credit markets. It is reminiscent of
when the Fed injected emergency cash into the repo market at the peak of
the tech bubble at the end of 1999 to fend off a potential Y2K computer
glitch that led to that market and business cycle top. After 40
years of declining inflation expectations in the US, there is a major
disconnect today between portfolio positioning, valuation, and economic
reality. Too much of the investment world is long the “risk parityâ€
trade to one degree or another, long stocks paired with leveraged long
bonds, a strategy that has back-tested great over the last 40 years, but
one that would be a disaster in a secular rising inflation environment.
With historic Federal debt relative to GDP and large deficits into
the future as far as the eye can see, rising long-term inflation, and
the hidden tax thereon, is the default, bi-partisan plan for the US
government’s future funding regardless of who is in the White House and
Congress after the 2020 elections. The market could start discounting
this sooner rather than later. The Fed’s excessive money printing
may only reinforce the unraveling of financial asset imbalances today as
it leads to rising inflation expectations and thereby a sell-off in
today’s highly over-valued long duration assets including Treasury bonds
and US equities, particularly insanely overvalued growth stocks. We
believe we are in the vicinity of a major US stock market and business
cycle peak.
Posted by AGORACOM
at 2:20 PM on Friday, January 10th, 2020
This article is an overview of the economic conditions that will
drive the gold price in 2020 and beyond. The turn of the credit cycle,
the effect on government deficits and how they are to be financed are
addressed.
In the absence of foreign demand for new US Treasuries
and of a rise in the savings rate the US budget deficit can only be
financed by monetary inflation. This is bound to lead to higher bond
yields as the dollar’s falling purchasing power accelerates due to the
sheer quantity of new dollars entering circulation. The relationship
between rising bond yields and the gold price is also discussed.
It
may turn out that the recent extraordinary events on Comex, with the
expansion of open interest failing to suppress the gold price, are an
early recognition in some quarters of the US Government’s debt trap.
The strains leading to a crisis for fiat currencies are emerging into plain sight.
Introduction
In 2019, priced in dollars gold rose 18.3% and silver by 15.1%. Or
rather, and this is the more relevant way of putting it, priced in gold
the dollar fell 15.5% and in silver 13%. This is because the story of
2019, as it will be in 2020, was of the re-emergence of fiat currency
debasement. Particularly in the last quarter, the Fed began aggressively
injecting new money into a surprisingly illiquid banking system through
repurchase agreements, whereby banks’ reserves at the Fed are credited
with cash loaned in return for T-bills and coupon-bearing Treasuries as
collateral. Furthermore, the ECB restarted quantitative easing in
November, and the Bank of Japan stands ready to ease policy further “if
the momentum towards its 2% inflation target comes under threat†(Kuroda
– 26 December).
The Bank of Japan is still buying bonds, but at
a pace which is expected to fall beneath redemptions of its existing
holdings. Therefore, we enter 2020 with money supply being expanded by
two, possibly all three of the major western central banks. Besides
liquidity problems, the central bankers’ nightmare is the threat that
the global economy will slide into recession, though no one will confess
it openly because it would be an admission of policy failure. And
policy makers are also terrified that if bankers get wind of a declining
economy, they will withdraw loan facilities from businesses and make
things much worse.
Of the latter concern central banks have good
cause. A combination of the turn of the credit cycle towards its
regular crisis phase and Trump’s tariff war has already hit
international trade badly, with exporting economies such as Germany
already in recession and important trade indicators, such as the Baltic
dry index collapsing. No doubt, President Trump’s most recent
announcement that a trade deal with China is ready for signing is driven
by an understanding in some quarters of the White House that over trade
policy, Trump is turning out to be the turkey who voted for Christmas.
But we have heard this story several times before: a forthcoming
agreement announced only to be scrapped or suspended at the last moment.
The
subject which will begin to dominate monetary policy in 2020 is who
will fund escalating government deficits. At the moment it is on few
investors’ radar, but it is bound to dawn on markets that a growing
budget deficit in America will be financed almost entirely by monetary
inflation, a funding policy equally adopted in other jurisdictions.
Furthermore, Christine Lagarde, the new ECB president, has stated her
desire for the ECB’s quantitative easing to be extended from government
financing to financing environmental projects as well.
2020 is
shaping up to be the year that all pretence of respect for money’s role
as a store of value is abandoned in favour of using it as a means of
government funding without raising taxes. 2020 will then be the year
when currencies begin to be visibly trashed in the hands of their
long-suffering users.
Gold in the context of distorted markets
At the core of current market distortions is a combination of
interest rate suppression and banking regulation. It is unnecessary to
belabour the point about interest rates, because minimal and even
negative rates have demonstrably failed to stimulate anything other than
asset prices into bubble territory. But there is a woeful lack of
appreciation about the general direction of monetary policy and where it
is headed.
The stated intention is the opposite of reality,
which is not to rescue the economy: while important, from a bureaucrat’s
point of view that is not the greatest priority. It is to ensure that
governments are never short of funds. Inflationary financing guarantees
the government will always be able to spend, and government-licenced
banks exist to ensure the government always has access to credit.
Unbeknown
to the public, the government licences the banks to conduct their
business in a way which for an unlicensed organisation is legally
fraudulent. The banks create credit or through their participation in QE
they facilitate the creation of base money out of thin air which is
added to their reserves. It transfers wealth from unsuspecting members
of the public to the government, crony capitalists, financial
speculators and consumers living beyond their means. The government
conspires with its macroeconomists to supress the evidence of rising
prices by manipulating the inflation statistics. So successful has this
scheme of deception been, that by fuelling GDP, monetary debasement is
presented as economic growth, with very few in financial mainstream
understanding the deceit.
The government monopoly of issuing
money, and through their regulators controlling the expansion of credit,
was bound to lead to progressively greater abuse of monetary trust. And
now, in this last credit cycle, the consumer who is also the producer
has had his income and savings so depleted by continuing monetary
debasement that he can no longer generate the taxes to balance his
government’s books later in the credit cycle.
The problem is not
new. America has not had a budget surplus since 2001. The last credit
cycle in the run up to the Lehman crisis did not deliver a budget
surplus, nor has the current cycle. Instead, following the Lehman crisis
we saw a marked acceleration of monetary inflation, and Figure 2 shows
how dollar fiat money has expanded above its long-term trend since then.
In recent years, the Fed’s attempt to return to monetary normality by
reducing its balance sheet has failed miserably. After a brief pause,
the fiat money quantity has begun to grow at a pace not seen since the
immediate aftermath of the Lehman crisis itself and is back in record
territory. Figure 1 is updated to 1 November, since when FMQ will have
increased even more.
In order to communicate effectively the
background for the relationship between gold and fiat currencies in 2020
it is necessary to put the situation as plainly as possible. We enter
the new decade with the highest levels of monetary ignorance imaginable.
It is a systemic issue of not realising the emperor has no clothes.
Consequently, markets have probably become more distorted than we have
ever seen in the recorded history of money and credit, as widespread
negative interest rates and negative-yielding bonds attest. In our
attempt to divine the future, it leaves us with two problems: assessing
when the tension between wishful thinking in financial markets and
market reality will crash the system, and the degree of chaos that will
ensue.
The timing is impossible to predict with certainty
because we cannot know the future. But, if the characteristics of past
credit cycles are a guide, it will be marked with a financial and
systemic crisis in one or more large banks. Liquidity strains suggest
that event is close, even within months and possibly weeks. If so, banks
will be bailed, of that we can be certain. It will require central
banks to create yet more money, additional to that required to finance
escalating government budget deficits. Monetary chaos promises to be
greater than anything seen heretofore, and it will engulf all western
welfare-dependent economies and those that trade with them.
We
have established that between keeping governments financed, bailing out
banks and perhaps investing in renewable green energy, the issuance of
new money in 2020 will in all probability be unprecedented, greater than
anything seen so far. It will lead to a feature of the crisis, which
may have already started, and that is an increase in borrowing costs
forced by markets onto central banks and their governments. The yield on
10-year US Treasuries is already on the rise, as shown in Figure 3.
Assuming no significant increase in the rate of savings and
despite all attempts to suppress the evidence, the acceleration in the
rate of monetary inflation will eventually lead to runaway increases in
the general level of prices measured in dollars. As Milton Friedman put
it, inflation [of prices] is always and everywhere a monetary
phenomenon.
Through QE, central banks believe they can contain
the cost of government funding by setting rates. What they do not seem
to realise is that while to a borrower interest is a cost to set against
income, to a lender it reflects time-preference, which is the
difference between current possession, in this case of cash dollars, and
possession at a future date. Unless and until the Fed realises and
addresses the time preference problem, the dollar will lose purchasing
power. Not only will it be sold in the foreign exchanges, but depositors
will move to minimise their balances and creditors their ownership of
debt.
If, as it appears in Figure 3, dollar bond yields are
beginning a rising trend, the inexorable pull of time preference is
already beginning to apply and further rises in bond yields will imperil
government financing. The Congressional Budget Office assumes the
average interest rate on debt held by the public will be 2.5% for the
next three years, and that net interest in fiscal 2020 will be $390bn,
being about 38% of the projected deficit of $1,008bn. Combining the
additional consequences for government finances of a recession with
higher bond yields than the CBO expects will be disastrous.
Clearly,
in these circumstances the Fed will do everything in its power to stop
markets setting the cost of government borrowing. But we have been here
before. The similarities between the situation for the dollar today and
the deterioration of British government finances in the early to
mid-1970s are remarkable. They resulted in multiple funding crises and
an eventual bail-out from the IMF. Except today there can be no IMF
bail-out for the US and the dollar, because the bailor gets its currency
from the bailee.
Nearly fifty years ago, in the UK gold rose
from under £15 per ounce in 1970 to £80 in December 1974. The peak of
the credit cycle was at the end of 1971, when the 10-year gilt yield to
maturity was 7%. By December 1974, the stock market had crashed, a
banking crisis had followed, price inflation was well into double
figures and the 10-year gilt yield to maturity had risen to over 16%.
History
rhymes, as they say. But for historians the parallels between the
outlook for the dollar and US Treasury funding costs at the beginning of
2020, and what transpired for the British economy following the Barbour
boom of 1970-71 are too close to ignore. It is the same background for
the relationship between gold and fiat currencies for 2020 and the few
years that follow.
Gold and rising interest rates
Received investment wisdom is that rising interest rates are bad for
the gold price, because gold has no yield. Yet experience repeatedly
contradicts it. Anyone who remembers investing in UK gilts at a 7% yield
in December 1971 only to see prices collapse to a yield of over 16%,
while gold rose from under £15 to £80 to the ounce over the three years
following should attest otherwise.
Part of the error is to
believe that gold has no yield. This is only true of gold held as cash
and for non-monetary usage. As money, it is loaned and borrowed, just
like any other form of money. Monetary gold has its own time preference,
as do government currencies. In the absence of state intervention, time
preferences for gold and government currencies are set by their
respective users, bearing in mind the characteristics special to each.
It is not a subject for simple arbitrage, selling gold and buying
government money to gain the interest differential, because the spread
reflects important differences which cannot be ignored. It is like
shorting Swiss francs and buying dollars in the belief there is no
currency risk.
The principal variable between the time
preferences of gold and a government currency is the difference between
an established form of money derived from the collective preferences of
its users, for which there is no issuer risk, and state-issued currency
which becomes an instrument of funding by means of its debasement.
The
time preference of gold will obviously vary depending on lending risk,
which is in addition to an originary rate, but it is considerably more
stable than the time preference of a fiat currency. Gold’s interest rate
stability is illustrated in Figure 4, which covers the period of the
gold standard from the Bank Charter Act of 1844 to before the First
World War, during which time the gold standard was properly implemented.
With the exception of uncontrolled bank credit, sterling operated as a
gold substitute.
Admittedly, due to problems created by the cycle of bank credit,
these year-end values conceal some significant fluctuations, such as at
the time of the Overend Gurney collapse in 1866 when borrowing rates
spiked to 10%. The depression following the Barings crisis of 1890
stalled credit demand which is evident from the chart. However,
wholesale borrowing rates, which were effectively the cost of borrowing
in gold, were otherwise remarkably stable, varying between 2-3½%. Some
of this variation can be ascribed to changing perceptions of general
borrower risk and some to changes in industrial investment demand,
related to the cycle of bank credit.
Compare this with dollar
interest rates since 1971, when the dollar had suspended the remaining
fig-leaf of gold backing, which is shown in Figure 5 for the decade
following.
In February 1972 the Fed Funds rate was 3.29%, rising eventually
to over 19% in January 1981. At the same time gold rose from $46 to a
high of $843 at the morning fix on 21 January 1980. Taking gold’s
originary interest rate as approximately 2% it required a 17% interest
rate penalty to dissuade people from hoarding gold and to hold onto
dollars instead.
In 1971, US Government debt stood at 35% of GDP
and in 1981 it stood at 31%. The US Government ran a budget surplus over
the decade sufficient to absorb the rising interest cost on its T-bill
obligations and any new Treasury funding. America enters 2020 with a
debt to GDP ratio of over 100%. Higher interest rates are therefore not a
policy option and the US Government, and the dollar, are ensnared in a
debt trap from which the dollar is unlikely to recover.
The seeds
of the dollar’s destruction were sown over fifty years ago, when the
London gold pool was formed, whereby central banks committed to help the
US maintain the price at $35, being forced to do so because the US
could no longer supress the gold price on its own. And with good reason:
Figure 6 shows how the last fifty years have eroded the purchasing
power of the four major currencies since the gold pool failed.
Over the last fifty years, the yen has lost over 92%, the
dollar 97.6%, the euro (and its earlier components 98.2% and sterling
the most at 98.7%. And now we are about to embark on the greatest
increase of global monetary inflation ever seen.
The market for physical gold
In recent years, demand for physical gold has been strong. Chinese
and Indian private sector buyers have to date respectively accumulated
an estimated 17,000 tonnes (based on deliveries from Shanghai Gold
Exchange vaults) and about 24,000 tonnes (according to WGC Director
Somasundaram PR quoted in India’s Financial Express last May).
It
is generally thought that higher prices for gold will deter future
demand from these sources, with the vast bulk of it being categorised as
simply jewellery. But this is a western view based on a belief in
objective values for government currencies and subjective prices for
gold. It ignores the fact that for Asians, it is gold that has the
objective value. In Asia gold jewellery is acquired as a store of value
to avoid the depreciation of government currency, hoarded as a central
component of a family’s long-term wealth accumulation.
Therefore,
there is no certainty higher prices will compromise Asian demand.
Indeed, demand has not been undermined in India with the price rising
from R300 to the ounce to over R100,000 today since the London gold pool
failed, and that’s despite all the government disincentives and even
bans from buying gold.
Additionally, since 2008 central banks
have accumulated over 4,400 tonnes to increase their official reserves
to 34,500 tonnes. The central banks most active in the gold market are
Asian, and increasingly the East and Central Europeans.
There
are two threads to this development. First there is a geopolitical
element, with Russia replacing reserve dollars for gold, and China
having deliberately moved to control global physical delivery markets.
And second, there is evidence of concern amongst the Europeans that the
dollar’s role as the reserve currency is either being compromised or no
longer fit for a changed world. Furthermore, the rising power of Asia’s
two hegemons continues to drive over two-thirds of the world’s
population away from the dollar towards gold.
Goldmoney estimates
there are roughly 180,000 tonnes of gold above ground, much of which
cannot be categorised as monetary: monetary not as defined for the
purposes of customs reporting, but in the wider sense to include all
bars, coins and pure gold jewellery accumulated for its long-term wealth
benefits through good and bad times. Annual mine production adds
3,000-3,500 tonnes, giving a stock to flow ratio of over 50 times. Put
another way, the annual increase in the gold quantity is similar to the
growth in the world’s population, imparting great stability as a medium
of exchange.
These qualities stand in contrast to the
increasingly certain acceleration of fiat currency debasement over the
next few years. Anyone prepared to stand back from the financial
coalface can easily see where the relationship between gold and fiat
currencies is going. Most of the world’s population is moving away from
the established fiat regime towards gold as a store of value, their own
fiat currencies lacking sufficient credibility to act as a dollar
alternative. And financial markets immersed in the fiat regime have very
little physical gold in possession. Instead, where it is now perceived
that there is a risk of missing out on a rise in the gold price,
investors have begun accumulating in greater quantities the paper
alternatives to physical gold: ETFs, futures, options, forward contracts
and mining shares.
Paper markets
From the US Government’s point of view, gold as a rival to the dollar
must be quashed, and the primary purpose of futures options and
forwards is to expand artificial supply to keep the price from rising.
In a wider context, the ability to print synthetic commodities out of
thin air is a means of suppressing prices generally and we must not be
distracted by claims that derivatives improve liquidity: they only
improve liquidity at lower prices.
When the dollar price of gold
found a major turning point on 17 December 2015, open interest on Comex
stood at 393,000 contacts. The year-end figure today is nearly double
that at 786,422 contracts, representing an increase of paper supply
equivalent to 1,224 tonnes. But that is not all. Not only are there
other regulated derivative exchanges with gold contracts, but also there
are unregulated over the counter markets. According to the Bank for
International Settlements from end-2015 unregulated OTC contracts
(principally London forward contracts) expanded by the equivalent of
2,450 tonnes by last June, taken at contemporary prices. And we must not
forget the unknown quantity of bank liabilities to customers’
unallocated accounts which probably involve an additional few thousand
tonnes.
In recent months, the paper suppression regime has
stepped up a gear, evidenced by Comex’s open interest rising. This is
illustrated in Figure 7.
There are two notable features in the chart. First, the rising
gold price has seen increasing paper supply, which we would expect from a
market designed to keep a lid on prices. Secondly instead of declining
with the gold price, open interest continued to rise following the price
peak in early September while the gold price declined by about $100.
This tells us that the price suppression scheme has run into trouble,
with large buyers taking the opportunity to increase their positions at
lower prices.
In the past, bullion banks have been able to put a
lid on prices by creating Comex contracts out of thin air. The recent
expansion of open interest has failed to achieve this objective, and it
is worth noting that the quantity of gold in Comex vaults eligible for
delivery and pledged is only 2% of the 2,446-tonne short position. In
London, there are only 3,052 tonnes in LBMA vaults (excluding the Bank
of England), which includes an unknown quantity of ETF and custodial
gold. Physical liquidity for the forward market in London is therefore
likely to be very small relative to forward deliveries. And of course,
the bullion banks in London and elsewhare do not have the metal to cover
their obligations to unallocated account holders, which is an
additional consideration.
Clearly, there is not the gold
available in the system to legitimise derivative paper. It now appears
that paper gold markets could be drifting into systemic difficulties
with bullion banks squeezed by a rising gold price, short positions and
unallocated accounts.
There are mechanisms to counter these
systemic risks, such as the ability to declare force majeure on Comex,
and standard unallocated account contracts which permit a bullion bank
to deliver cash equivalents to bullion obligations. But the triggering
of any such escape from physical gold obligations could exacerbate a
buying panic, driving prices even higher. It leads to the conclusion
that any rescue of the bullion market system is destined to fail.
A two-step future for the gold price
It has been evident for some time that the world of fiat currencies
has been drifting into ever greater difficulties of far greater
magnitude than can be contained by spinning a few thousand tonnes of
gold back and forth on Comex and in London. That appears to be the
lesson to be drawn from the inability of a massive increase in open
interest on Comex to contain a rising gold price.
It will take a
substantial upward shift in the gold price to appraise western financial
markets of this reality. In combination with systemic strains
increasing, a gold price of over $2,000 may do the trick. Professional
investors will have found themselves wrongfooted; underinvested in ETFs,
gold mines and regulated derivatives, in which case their gold demand
is likely to drive one or more bullion houses into considerable
difficulties. We might call this the first step in a two-step monetary
future.
The extent to which gold prices rise could be
substantial, but assuming the immediate crisis itself passes, banks
having been bailed in or out, and QE accelerated in an attempt to put a
lid on government bond yields, then the gold price might be deemed to
have risen too far, and due for a correction. But then there will be the
prospect of an accelerating loss of purchasing power for fiat
currencies as a result of the monetary inflation, and that will drive
the second step as investors realise that what they are seeing is not a
rising gold price but a fiat currency collapse.
The high levels
of government debt today in the three major jurisdictions appear to
almost guarantee this outcome. The amounts involved are so large that
today’s paper gold suppression scheme is likely to be too small in
comparison and cannot stop it happening. The effect on currency
purchasing powers will then be beyond question. Monetary authorities
will be clueless in their response, because they have all bought into a
form of economics that puts what will happen beyond their understanding.
As noted above, the path to a final crisis for fiat currencies
might have already started, with the failure by the establishment to
suppress the gold price through the creation of an extra 100,000 Comex
contracts. If not, then any success by the monetary authorities to
reassert control is likely to be temporary.
Perhaps we are
already beginning to see the fiat currency system beginning to unravel,
in which case those that insist gold is not money will find themselves
impoverished.
Posted by AGORACOM
at 5:48 PM on Thursday, January 9th, 2020
American Creek owns a 20% Carried Interest to Production at the Treaty Creek Project in the Golden Triangle. 2019’s first hole averaged 0.683 g/t Au over 780m in a vertical intercept. The Treaty Creek property is located in the same hydrothermal system as the Pretivm and Seabridge’s KSM deposits.
Low-cost gold-backed ETFs in the US have seen positive flows for 18 of the past 19 months
Global gold-backed exchange-traded funds (ETFs) and similar products
had $19.2 billion or 400 tonnes of net inflows in 2019 after holdings
rebounded in December, the World Gold Council (WGC) reports. In the fourth quarter, ETF holdings reached an all-time high of 2,900 tonnes.
Overall, gold-backed assets under management (AUM) grew by 37% in
dollar terms during the year owing to positive demand and an 18.4%
increase in the gold price.
From a regional perspective, North American funds led the way with
inflows of 206 tonnes ($10.1 billion, 14.4% AUM). SPDR Gold Shares – the
world’s biggest gold ETF—and iShares Gold Trust accounted for nearly
half of last year’s inflows.
Low-cost gold-backed ETFs in the US have seen positive flows for 18
of the past 19 months and increased their collective holdings by 60%,
according to the latest WGC data.
Elsewhere, holdings in European funds increased by 188 tonnes ($8.8
billion, 13.6%), while funds listed in Asia were nearly flat, recording
an outflow of 0.1 tonnes ($12 million, 0.3%). The remaining regions had
combined inflows of 6.3 tonnes ($311 million, 16.3%).
Looking ahead, WGC analysts said that they expect investor demand to remain robust through 2020.
“The strength of gold was mainly the byproduct of a dovish shift in monetary policy. Our research indicates that a shift from a hawkish or neutral stance to a dovish one has historically led gold to outperform,†a WGC analyst said.
About American Creek
American Creek is a Canadian mineral exploration company with a strong portfolio of gold and silver properties in British Columbia. Three of those properties are located in the prolific “Golden Triangleâ€; the Treaty Creek and Electrum joint venture projects with Tudor Gold/Walter Storm as well as the 100% owned past producing Dunwell Mine.
The Corporation also holds the Gold Hill, Austruck-Bonanza, Ample Goldmax, Silver Side, and Glitter King properties located in other prospective areas of the province.
For further information please contact Kelvin Burton at: Phone: 403 752-4040 or Email: [email protected]. Information relating to the Corporation is available on its website at www.americancreek.com
Posted by AGORACOM-JC
at 4:48 PM on Thursday, January 9th, 2020
SPONSOR: Spyder Cannabis (SPDR:TSXV) An established chain of high-end vape stores. Aggressive expansion plan is already in place that will focus on Canadian retail and US Hemp derived kiosks in high traffic areas. Click here for more info.
However, there seems to be a gap between cannabis demand and supply in Canada
It’s been a year since Canada legalized marijuana, but it seems consumers in the country are still struggling to obtain legal cannabis
This demand-supply imbalance took a toll on cannabis companies’ revenues and stock prices last year
Let’s take a closer look at the demand-supply imbalance in Canada.
The cannabis demand-supply landscape in Canada
Health Canada has come up with a national Cannabis Tracking System to
keep track of the cannabis produced and sold across the country. The
intention is to keep a check on illegal cannabis sales. Health Canada requires federal license holders and provincial and territorial growers to report this data on a monthly basis.
Another objective behind this move could be to ensure that cannabis
producers aren’t growing marijuana illegally. Such was the case last
year with CannTrust (NYSE:CTST). The company was found to be growing marijuana illegally and was reportedly in violation of Health Canada’s regulations.
The monthly report tracks the sales of medical and recreational
marijuana. It also takes into account the cannabis inventories held by
retailers and distributors. Here are a few details from the report for
the period that ended on September 30, 2019:
Total sales of dried cannabis fell by 0.4% to 12,922 kilograms on a month-to-month basis.
Cannabis oil total sales rose by 4.8% to 11,187 liters on a month-to-month basis.
The total amount of finished dried cannabis inventory rose by 5% to 64,151 kilograms on a month-to-month basis.
The total amount of finished cannabis oil inventory rose by 1.1% to 102,060 liters on a month-to-month basis.
“Finished inventory†here implies that the products are ready and
packed for sale. The finished inventory for dried cannabis was higher
for both provincial and territorial distributors and retailers and
federal license holders.
For dried cannabis, federal license holders saw a 5.7% increase in
finished inventories, while provincial and territorial distributors and
retailers saw a 4.3% increase. Additionally, for cannabis oil, federal
license holders saw a 2.6% increase in inventories, while provincial and
territorial distributors and retailers saw a 1.4% decrease.
What caused the imbalance?
Canada legalized marijuana in October 2018. The demand for marijuana
was high in the country. Thus, producers cultivated more cannabis,
hoping to meet this demand. However, regulatory procedures were slow and
strenuous, which resulted in a delay in the licensing and opening of
new legal stores. The delay resulted in higher inventories and caused
supply issues. Hence, cannabis sales
were affected across Canada. Looking at the data for September, we can
conclude that most retailers had products ready for sale. However, the
lack of stores caused a supply issue and a rise in inventory.
Moreover, the licensing process isn’t that simple. A Cannabiz Media article stated,
“The amount of time to obtain a license to grow marijuana in Canada’s
legal market was excessive with some cultivators waiting months or even a
year. Once a grower obtained a cultivation license, it needed to
produce two full crops, have them tested, get its sales software
audited, and apply for a sales license, which could take another year.â€
How’s the marijuana demand and supply situation in the US?
While we’re on the subject, let’s talk about the demand and supply
situation in the US. Marijuana isn’t legal at the federal level in the
US. However, 33 states and the District of Columbia allow medical
marijuana. Additionally, 11 states and the District of Columbia allow
recreational marijuana.
Black market sales are a matter of concern even in the US. California,
which legalized medical marijuana in 1996 and adult-use marijuana in
2016, also suffers from illicit cannabis activity. An article by
Cannabis Business Plan discussed how cannabis consumers in the state
will initially be inclined toward the illegal market to avoid regulatory costs. The article also stated
that predictions show that by 2022, the marijuana market in the state
could be worth $7.7 billion driven mostly by recreational marijuana.
Cannabiz Media also discussed how states such as Michigan are facing
supply shortages due to a lack of licensed growers. Recently, recreational marijuana sales went live in Michigan. Pennsylvania faced similar problems when demand for medical cannabis couldn’t match supply in the state.
Furthermore, the abundance of marijuana resulted in losses for many
licensed cultivators as prices fell. Obtaining capital for cannabis
businesses is still an issue in the US. Banks and financial institutions
are scared to provide help to cannabis companies because marijuana is
still illegal federally. However, hopes are that the passing of the SAFE
Act could smooth this process.
How are cannabis companies coping with the demand-supply situation?
The demand-supply imbalance hit cannabis companies’ revenues and
profitabilities last year. After Canada legalized cannabis, companies
increased their production capacities to match demand. However, the lack
of legal stores caused a supply issue. Initially, Ontario was strict
with its cannabis laws. Recently, though, after the second phase of
legalization, Ontario relaxed its laws to tackle the problem of black market sales. Canada’s three largest provinces now expect higher sales this year from the Cannabis 2.0 expansion.
Cannabis edibles are in high demand among marijuana products. Hence,
consumers turned to the black market to obtain these products when
Canada hadn’t legalized edibles. The prices of cannabis products on the
black market are also lower than they are on the legal market. Now, with
Cannabis 2.0 products ready to hit the stores, marijuana companies
expect to recover their losses in 2020. These companies are ready with a
variety of edibles, vapes, and beverages.
Though analysts expect a turnaround in 2020,
they’ve kept a subdued outlook on marijuana companies’ 2020 revenues.
Some analysts feel regulations and licensing delays could still affect
Cannabis 2.0 revenues this year. Companies’ 2020 revenue estimates are
as follows:
Cronos Group’s fiscal 2020 revenue could be around 146.1 million Canadian dollars.
HEXO’s fiscal 2020 revenue could be around 79.1 million Canadian dollars.
Final thoughts
The demand-supply imbalance in the cannabis market is an important
issue. However, we also have to consider that the industry is a growing
one and will have its ups and downs. Currently, the flow of regulations
isn’t smooth, which is causing licensing and cultivation delays. It may
take some time for things to smooth out in the industry.
Many also feel that federal legalization will help balance the demand-supply issue in the US. Nevertheless, considering the efforts by Canada and certain states in the US, we can expect a turnaround in 2020.
Stay tuned to learn more about the ins and outs of the marijuana industry.