Agoracom Blog Home

Posts Tagged ‘#Anomaly’

Advance Gold $AAX.ca – Gold Prepares For Next Phase Of Bull Market $SIL.ca $FA.ca $ANG.jo $ABX.ca $NGT.ca $MGG.ca $TECK.ca

Posted by AGORACOM at 4:48 PM on Tuesday, October 22nd, 2019

SPONSOR: Advance Gold AAX.v – Advance Gold controls 100% interest in the Tabasquena Silver Mine in Zacatecas, Mexico. A cluster of 30 Epithermal veins have been discovered, with recent emphasis on exploring a large anomaly to drill. Advance also owns 15% of the Kakamega JV attached to Barrick Takeover Offer for Acacia Mining. Click Here For More Info

This image has an empty alt attribute; its file name is AAX-square-Logo.png
  • Fears of a Trans-Atlantic trade war have increased gold’s safety bid.
  • U.S. economic data also continues to attract safety seekers to gold.
  • All signs point to a continuation of the metal’s bull market in Q4.

After a brief respite last month, fear and uncertainty have returned with a vengeance in October. Recent world events have given investors plenty of reasons to fear an expansion of the global trade war.

Meanwhile on the domestic front, investors are becoming increasingly alarmed by soft economic data which some interpret as a harbinger of recession. Gold’s “fear factor” has thus been resuscitated, bringing with it the promise of stronger prices in the months ahead. Here we’ll discuss the growing number of variables which suggest gold is consolidating its recent gains ahead of the next stage of its long-term bull market.

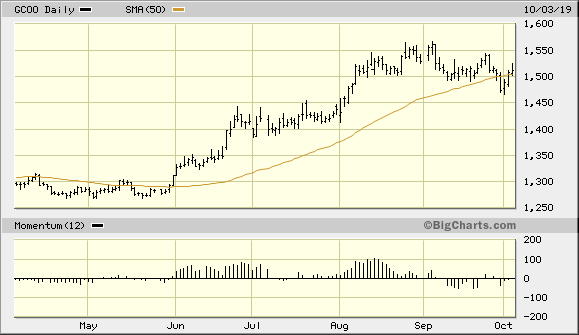
One sign of a market controlled by the bulls is the steadfast refusal of prices, following a correction, to stay down for long. Bull markets have a tendency to consolidate gains achieved during extended rallies in the form of a lateral trading range, or sideways drift. That appears to be the form of gold’s most recent correction in September following a productive three-month rally.

Although gold prices briefly violated a key short-term trend line earlier this week, the bulls fought back fiercely and pushed prices back above the widely, followed 50-day moving average within two days of the violation. It may take several more days for gold to regain enough strength and build the support necessary to stay above the 50-day MA. But the signs are plainly evident that the bulls are clawing their way back to controlling gold’s immediate-term (1-4 week) trend.
Source: BigCharts

And while gold prices haven’t kept pace with its nearest competitor in the rush to safety – namely U.S. Treasury bonds – it’s instructive that gold has so far responded favorably to most of the latest negative economic and political news. For instance, gold jumped nearly 1.5% on Oct. 2 after the release of the latest ADP National Employment Report. The report showed that private payroll growth by U.S. employers slowed in September and wasn’t as strong in August as previously estimated, according to a Reuters article. Reuters reporter Lucia Mutikani, capturing the sentiment which has overtaken many gold investors, observed:

The longest economic expansion on record, now in its 11th year, is losing ground with the blame largely put on a 15-month trade war between the United States and China, which has eroded business confidence.”

It’s further believed by many investors that the growing signs of a slowing U.S. economy could influence the Federal Reserve to further lower its benchmark interest rate this fall. Lower rates are widely regarded as bullish for gold since it reduces the competition vs. interest-bearing assets for the non-yielding metal.

Elsewhere on the U.S. economic front, the recent disappointments in the Purchasing Managers’ Index (PMI) is another reason for the revival of gold’s fear factor. The PMI has now fallen for seven consecutive months and is below 50.0, which indicates contraction in the manufacturing sector.

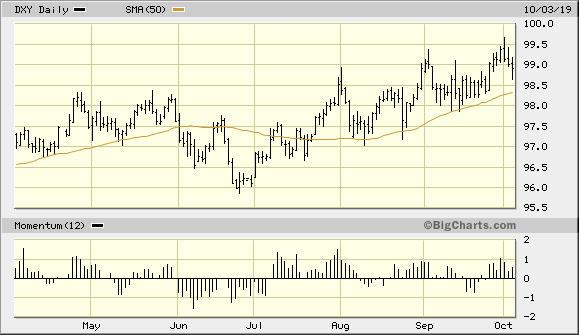
The latest disappointing PMI readings also have weighed heavily on the U.S. dollar index (DXY) of late. The dollar fell to one-week lows against the euro and yen on Oct. 3. However, the dollar index is still close to a multi-year high, which means that gold doesn’t yet enjoy support from its currency component (see chart below). Nonetheless, gold has proven to be stalwart enough this year under the influence of the fear factor alone and in spite of a strong dollar. Thus, a weaker dollar isn’t necessarily a prerequisite for a Q4 gold rally.
Source: BigCharts

Aside from a weakening manufacturing sector, the U.S. service sector also is showing signs of slowing. The latest ISM survey released on Oct. 3 showed service-sector activity for September fell to its lowest level in three years. Some analysts blamed the U.S.-China trade dispute for the slowdown. The latest ISM Non-Manufacturing Index fell to 52.6 last month as new orders fell more than expected. This disappointed economists’ expectations of 55.3. This increased gold’s allure as a safe haven in the eyes of many investors and should provide some underlying support for the metal going forward.

In yet another development which bolsters gold’s safety bid, the U.S. won approval on Oct. 2 from the World Trade Organization to levy tariffs on $7.5 billion worth of European goods. The WTO’s decision relates to illegal subsided given to Airbus (EASDF) and Boeing (NYSE:BA). Consequently, many investors fear the outbreak of yet another front in the ongoing global trade war.

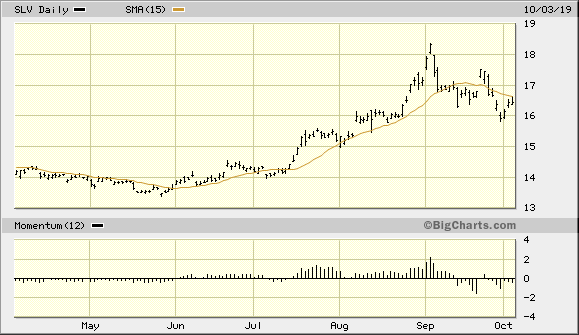
In view of the above-mentioned factors, gold’s intermediate-term (3-6 month) upward trend looks secure. The only thing standing in the way of a renewed immediate-term gold buy signal, however, is confirming strength in gold’s sister metal. Silver remains below its 15-day moving average, as can be seen in the iShares Silver Trust (ETF) below. As I mentioned in a previous report, we need to see silver confirm gold’s returning strength before we get a confirmed re-entry signal. A lack of confirmation from silver normally means that gold’s rally will fail due to the lack of institutional demand. Historically, when market-moving institutional investors are bullish enough to buy gold, they usually buy silver as an adjunct.
Source: BigCharts

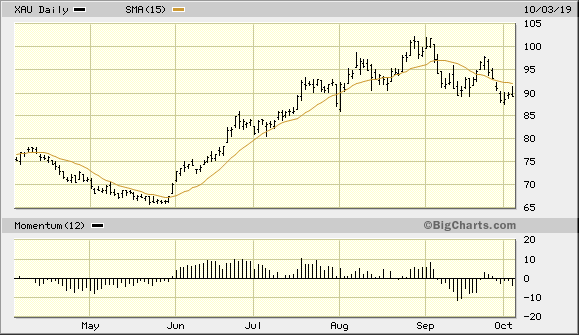
Another sign that should accompany gold’s next confirmed breakout is a return to strength in the actively traded U.S. mining shares. Shown below is the PHLX Gold/Silver Index (XAU), which remains below its 15-day moving average as of Oct. 3. To get a renewed buy signal for gold stocks in the aggregate, we should see a two-day higher close above the 15-day in the XAU. Moreover, a gold stock rally tends to accompany a rally in bullion prices due to the leverage factor of the miners, which attracts precious metals investors.
Source: BigCharts

In summary, a growing number of worries on the U.S. economic and global trade fronts has provided gold with a renewed safety bid. The evidence reviewed here suggests that gold prices are consolidating ahead of another breakout attempt this fall. Confirming strength in the silver price would increase gold’s bullish prospects in Q4, as would a breakout in the leading gold mining stocks. With trade war threats on the rise, however, gold is poised to benefit from safe-haven demand and keep its bull market intact. Investors are therefore justified in maintaining longer-term investment positions in the yellow metal.

On a strategic note, I’m waiting for both the gold price and the gold mining stocks to confirm a breakout before initiating a new trading position in the VanEck Vectors Gold Miners ETF (GDX), my preferred trading vehicle for the mining stocks. I’m currently in a cash position in my short-term trading portfolio

SOURCE: https://seekingalpha.com/article/4295225-gold-prepares-next-phase-bull-market
CLIENT FEATURE: Advance Gold $AAX.ca – IP Survey Showing Potential for Large System Beneath Tabasquena Mine $SIL.ca $FA.ca $ANG.jo $ABX.ca $NGT.ca $MGG.ca $TECK.ca $FNLPF $PAAS.ca

Posted by AGORACOM at 2:55 PM on Thursday, October 17th, 2019
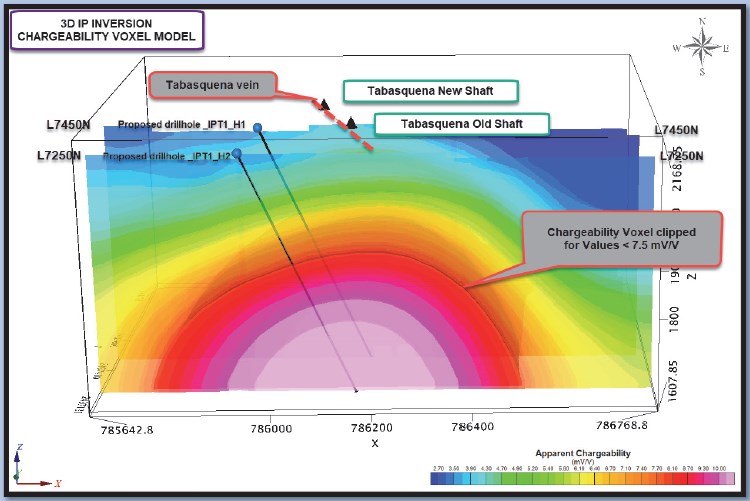
  • A 3D Induced Polarization (IP) geophysical survey on its Tabasquena project in Zacatecas, Mexico has outlined a significant continuous chargeability anomaly.
  • This anomaly has an east-west width of approximately 250 metres and an apparent strike length of over 800 metres.
  • 2nd planned IP surgery to extend the grid approximately 1000 metres to the south where due to the elevation change the anomaly is closest to surface.
  • The anomaly remains open to the north and to the south and at depth.
  • Drilling to commence once the IP survey has been completed.
The chargeability anomaly is approximately 250 metres below historical mining and was designed for 500 to 550 metres of vertical depth investigation.

The IP data also clearly shows that the large polarisable body/target is apparently quickly deepening northward and getting closer to surface southward. The IP anomaly starts at around 100 metres below the past drill hole intersections that contained widespread gold and silver mineralization in epithermal veins.

Tabasquena

  • Previous drilling found a network of veins with widespread gold and silver mineralization.
  • The first phase geophysical survey revealed a large chargeability anomaly right below these veins and is getting nearer to the surface as it trends south.
  • Geophysical advisor described the anomaly as ‘quite remarkable in its size and continuity.
  • Advance is in a region with very large mines, including the El Coronel open pit, 12 miles to the south of Tabasquena.

Advance Gold Hub on Agoracom

FULL DISCLOSURE: Advance Gold is an advertising client of AGORA Internet Relations Corp.

Advance Gold $AAX.ca – Begins Second Phase Geophysical Survey to Expand Large and Continuous Chargeability Anomaly $SIL.ca $FA.ca $ANG.jo $ABX.ca $NGT.ca $MGG.ca $TECK.ca

Posted by AGORACOM at 10:10 AM on Thursday, October 10th, 2019
  • Previous drilling found a network of veins with widespread gold and silver mineralization.
  • The first phase geophysical survey revealed a large chargeability anomaly right below these veins.
  • The anomaly is quite large, allowing AAX to expand the grid to the south with fewer lines so we expect to complete this survey within 2 weeks and then begin drilling
  • 12 miles to the west is the San Nicolas VMS mine owned by Teck Corporation and 12 miles to the south is the El Coronel open pit gold mine located in the same geological environment as the Tabasquena project.

Kamloops, British Columbia–(Newsfile Corp. – October 10, 2019) – Advance Gold Corp. (TSXV: AAX) (“Advance Gold” or “the Company”) is pleased to announce that the second phase of geophysics is underway on the Company’s Tabasquena project in Zacatecas, Mexico. The goal of this second 3D induced polarization (IP) survey is to expand the grid completed in the first phase to the south where the anomaly comes closest to surface.

The first phase survey identified a large continuous chargeability anomaly just below an area of widespread gold and silver mineralization in epithermal veins. The anomaly is approximately 250 metres wide and 800 metres long from north to south. The second phase IP survey will extend the grid approximately 1000 metres to the south where due to the elevation change the anomaly is closest to surface. The chargeability anomaly remains open to the north, south and at depth.

An IP survey is a geophysical imaging technique used to identify the electrical chargeability of subsurface materials such as ore. The technique involves the measurement of the slow decay of voltage in the ground following the cessation of an excitation current. The method makes use of the capacitive action of the subsurface to locate zones where chargeable minerals are present. Disseminated sulphides and other chargeable minerals have distinct IP signatures.

It is important to note that approximately 12 miles to the west is the San Nicolas VMS mine owned by Teck Corporation and 12 miles to the south is the El Coronel open pit gold mine located in the same geological environment as the Tabasquena project.

Allan Barry Laboucan, President and CEO of Advance Gold Corp. commented: “It’s a very exciting time for Advance Gold, previous drilling found a network of veins with widespread gold and silver mineralization. Following this the first phase geophysical survey revealed a large chargeability anomaly right below these veins. Another impressive aspect of the first IP survey is that as we move to the south there is a decrease in the depth to the IP anomaly that would indicate that the anomaly is getting nearer to the surface as we move to the south. A possible reason for this is that the elevation decreases as we go southward, so it is important for us to extend the IP grid to the south before we drill test the IP anomaly. In our recent news release announcing the addition of our geophysical advisor, he described the anomaly as ‘quite remarkable in its size and continuity.’ As the anomaly is quite large, we are able to expand the grid to the south with fewer lines so we expect to complete this survey within 2 weeks and then begin drilling. We are in a region with very large mines, including El Coronel which is an open pit mine in production since 2008 which is 12 miles to the south of Tabasquena. Our team looks forward to further advancing the Tabasquena project with the second phase of geophysics and upcoming drilling.”

Julio Pinto Linares is a QP, Doctor in Geological Sciences with specialty in Economic Geology and Qualified Professional No. 01365 by MMSA., and QP for Advance Gold and is the qualified person as defined by National Instrument 43-101 and he has read and approved the accuracy of technical information contained in this news release.

About Advance Gold Corp. (AAX.V)

Advance Gold is a TSX-V listed junior exploration company focused on acquiring and exploring mineral properties containing precious metals. The Company acquired a 100% interest in the Tabasquena Silver Mine in Zacatecas, Mexico in 2017, and the Venaditas project, also in Zacatecas state, in April 2018.

The Tabasquena project is located near the Milagros silver mine near the city of Ojocaliente, Mexico. Benefits at Tabasquena include road access to the claims, power to the claims, a 100-metre underground shaft and underground workings, plus it is a fully permitted mine.

Venaditas is well located adjacent to Teck’s San Nicolas mine, a VMS deposit, and it is approximately 11km to the east of the Tabasquena project, along a paved road.

In addition, Advance Gold holds a 13.23% interest on strategic claims in the Liranda Corridor in Kenya, East Africa. The remaining 86.77% of the Kakamega project is held by Barrick Gold Corporation.

For further information, please contact:

Allan Barry Laboucan, President and CEO 
Phone (604) 505-4753
www.advancegold.ca

Advance Gold $AAX.ca Gold Prices Shoot Higher After ISM Service Sector Drops Sharply in September $SIL.ca $FA.ca $ANG.jo $ABX.ca $NGT.ca $MGG.ca

Posted by AGORACOM at 1:52 PM on Thursday, October 3rd, 2019

SPONSOR: Advance Gold AAX.v – Advance Gold controls 100% interest in the Tabasquena Silver Mine in Zacatecas, Mexico. A cluster of 30 Epithermal veins have been discovered, with recent emphasis on exploring a large anomaly to drill. Advance also owns 15% of the Kakamega JV attached to Barrick Takeover Offer for Acacia Mining. Click Here For More Info

Recession fears are once again gripping financial markets and pushing gold prices higher as sentiment within the U.S. service sector fell more than expected, according to the latest data from the Institute for Supply Management (ISM).

Thursday, the ISM said its nonmanufacturing index showed a reading of 52.6% for September, down from August’s reading of 56.4%. The data was much weaker than expected as consensus forecasts were calling for a reading of 55.1%.

According to reports this is the lowest reading in three years.

Readings above 50% in such diffusion indexes are seen as a sign of economic growth, and vice-versa. The farther an indicator is above or below 50%, the greater or smaller the rate of change.

Ahead of the report, the gold market was holding its own above $1,500 an ounce, recovering from a 2% selloff at the start of the week. The latest economic data has added to gold’s gains. December gold futures last traded at $1,518.80 an ounce, up 0.72% on the day.

Economists and analysts warned that disappointing service sector data could boost recession fears as this is the largest component of the U.S. economy.

The nonmanufacturing data comes just two days after the ISM said that its manufacturing index fell even further into contraction territory, also missing economist expectations.

“The non-manufacturing sector pulled back after reflecting strong growth in August. The respondents are mostly concerned about tariffs, labor resources and the direction of the economy,” said Anthony Nieves, chair of the ISM Non-Manufacturing Business Survey Committee.

Looking at the components of the report, the Business Activity Index dropped to a reading of 55.2%, down from August’s level of 61.5%.

The labor market also lost some momentum in September, with the Employment Index falling to 50.4%, down from August’s level of 53.1%. This indicator is closely watched by economists as it is used as a predictor for Friday’s nonfarm employment report.

Some economists have noted that the miss in the ISM employment data points to downside risk to Friday’s employment report.

Source: By Neils Christensen

Advance Gold’s $AAX.ca Completed Geophysical Survey at Tabasquena Project Identifies a Large Continuous IP Anomaly $ANG.jo $ABX.ca $NGT.ca $MGG.ca $SIL.ca $FA.ca $LON

Posted by AGORACOM at 1:41 PM on Thursday, September 5th, 2019
http://www.smallcapepicenter.com/AAX%20square.png

Kamloops, British Columbia–(Newsfile Corp. – September 5, 2019) – Advance Gold Corp. (TSXV: AAX) (“Advance Gold” or “the Company”) is pleased to announce that the recently completed 3D Induced Polarization (IP) geophysical survey on its Tabasquena project in Zacatecas, Mexico has outlined a significant continuous chargeability anomaly. This anomaly has an east-west width of approximately 250 metres and an apparent strike length of over 800 metres. The anomaly remains open to the north and to the south and at depth.

The complete geophysical report on this work is available on the company’s web site. Image below are cross sections representing a key portion of the overall anomaly.

Figure 10b


To view an enhanced version of this graphic, please visit:
https://orders.newsfilecorp.com/files/5492/47558_57611db644a9aab6_001full.jpg

Allan Barry Laboucan, President and CEO of Advance Gold Corp. commented: “Based on the size and number of vein intersections in the near surface drilling in the andesites, our exploration team has felt that we have found a very large system. The IP survey has now identified such a possible system. Where the IP anomaly starts is approximately 100 metres below the past drilling and almost directly under the main Tabasquena vein. This depth is very important because it is approximately where the graphitic phyllite horizon begins. The major mines nearby, operated by Fresnillo Plc., and MAG Silver’s Juanicipio mine currently under construction, are epithermal veins systems focused on zones within the graphitic phyllites. We have now established the existence of a large IP anomaly, below the widespread gold and silver mineralized veins, in the graphitic phyllite horizon. We are currently making plans to extend the IP grid to the north and south, and to commence our next drilling campaign. To put the size of the anomaly into perspective, while taking into consideration the widespread gold and silver mineralization above it, it is safe to say that this is the size that all major gold and silver mining companies would be interested in. It is clear to see that our small gold and silver exploration company is sitting on a very large target at a time when the industry is dramatically in need of new gold and silver discoveries.”

Details of Geophysical Survey

The 3D Induced Polarization survey was carried out by GEOFISICA TMC SA de CV, between August 3rd and August 14th, 2019. Approximately 9.6 kms of IP data was collected over the central portion of the company’s claims. The IP grid consisted of nine, east-west lines, 100 metres apart. Lines were approximately 1 km long. An off-set pole dipole array was used.

Data processing and inversion of the data was carried out using RES3DINV software. The inversion model was extended to approximately 550 meters below surface. 3D Voxel images together with a series of depth slices were generated (all available on the company’s website).

The main purpose of the IP survey was to map, laterally and at depth the evolution of the known silver veins and to identify new mineralised structures. The survey was designed in such a way to allow approximately 500 to 550 metres of vertical depth investigation.

The IP survey area encompassed the historic and new shafts that are located to the east of the Tabasquena and Nina veins that define a mineralised system that outcrops at surface for 2.0 km. From past exploration work, the Tabasquena vein was recognized over approximately 70 m along strike near the shaft but only at shallow depth (< 100 m).

The nine (9) vertical sections that were extracted from the 3D IP inversion voxels suggest the presence of (4) four main stratigraphic horizons (lithological units) mainly characterized by their resistivity signatures.

The IP data also clearly shows that the large polarisable body/target is apparently quickly deepening northward and getting closer to surface southward. The IP anomaly starts at around 100 metres below the past drill hole intersections that contained widespread gold and silver mineralization in epithermal veins.

Chargeability and resistivity anomalies are indicated on the IP sections (see report on company’s website) and are graded as per their relative strength. Those chargeability anomalies that are deemed to be caused by the same anomalous target are grouped together in what is called a polarisable axis. Only one main axis was delineated following the review of the IP data, which was labeled IPT-1 (Map C351-3 & Figure 11, report on company website). This axis is a single large amplitude continuous anomaly running north-south, coincident with the two shafts at Tabasquena and the surface projection of the mineralised veins. This anomaly has been categorized as having a high chargeability and is conductive. The anomaly has an average depth of approximately 250 to 300 meters. The most southerly line (L7150N) clearly shows that this anomaly is becoming shallower as one moves to the south. It should also be mentioned that this anomaly is visible on every line, albeit less intense on the most northerly line, as the target is becoming deeper to the north.

In conclusion

This geophysical work has identified a large consistent chargeability anomaly that can be seen on all lines, implying a strike extent of at least 800 meters and an apparent width of 250 meters. This observed IP anomaly could define a much wider mineralised system at depth.

The main recommendation of the geophysical report is to extend the 3D IP survey to the southeast for at least 1 km in the direction of the Tesorito shaft, which will determine the southerly extension of the main anomaly and establish whether this main target is becoming shallower. Following this a number of proposed boreholes are planned to intersect this anomaly.

Julio Pinto Linares is a QP, Doctor in Geological Sciences with specialty in Economic Geology and Qualified Professional No. 01365 by MMSA., and QP for Advance Gold and is the qualified person as defined by National Instrument 43-101 and he has read and approved the accuracy of technical information contained in this news release.

About Advance Gold Corp. (AAX.V)

Advance Gold is a TSX-V listed junior exploration company focused on acquiring and exploring mineral properties containing precious metals. The Company acquired a 100% interest in the Tabasquena Silver Mine in Zacatecas, Mexico in 2017, and the Venaditas project, also in Zacatecas state, in April, 2018.

The Tabasquena project is located near the Milagros silver mine near the city of Ojocaliente, Mexico. Benefits at Tabasquena include road access to the claims, power to the claims, a 100-metre underground shaft and underground workings, plus it is a fully permitted mine.

Venaditas is well located adjacent to Teck’s San Nicolas mine, a VMS deposit, and it is approximately 11km to the east of the Tabasquena project, along a paved road.

In addition, Advance Gold holds a 14.63% interest on strategic claims in the Liranda Corridor in Kenya, East Africa. The remaining 85.37% of the Kakamega project is held by Acacia Mining (63% owned by Barrick Gold Corporation).

For further information, please contact:

Allan Barry Laboucan,
President and CEO

Phone: (604) 505-4753
Email: [email protected]