
- Life of mine (LOM) of 14 years, with 6 million tonnes annually of potential process plant feed at an average grade of 0.88 g/t Palladium Equivalent (PdEq) and process recovery rate of 80%, resulting in an annual average payable Pd production of 119,000 ounces
- Pre-Production capital requirements: $495 M
- Undiscounted cash flow before income and mining taxes of $586M
- Undiscounted cash flow after income and mining taxes of $384M
June 27th, 2019 – Rockport, Canada – New Age Metals Inc. (NAM) (TSX.V: NAM; OTCQB: NMTLF; FSE: P7J.F) Harry Barr, Chairman & CEO, stated; “We are pleased to update our shareholders and interested parties as to the results of the initial Preliminary Economic Assessment (PEA) for the company’s 100% owned River Valley PGM Project in Sudbury, Ontario Canada. The PEA has been developed by various independent consultants – P&E Mining Consultants Inc. (P&E) was responsible for the open pit mining, surface infrastructure, tailings facility, and project economics; DRA Americas Inc. (“DRA”) was responsible for all metallurgical test work and processing aspects of the Project; and WSP Canada Inc. (“WSP”) was responsible for the Mineral Resource Estimate. The PEA demonstrates positive economics for a large-scale mining open pit operation, with 14 years of Palladium and Platinum production.”
Go-Forward Plan: In order to enhance the Project, the PEA has outlined a phased work approach to completing a Pre-Feasibility study. This includes advanced metallurgical testing to improve / confirm process recoveries and more accurately estimate concentrate grades, geotechnical logging of drill core, with new geotechnical holes to create a 3D geomechanical block model and estimate pit wall angles, hydrogeological studies that will estimate water inflows to the open pits and generate a site water and management plan. The Pre-Feasibility study will update the Project study to a higher level of precision.
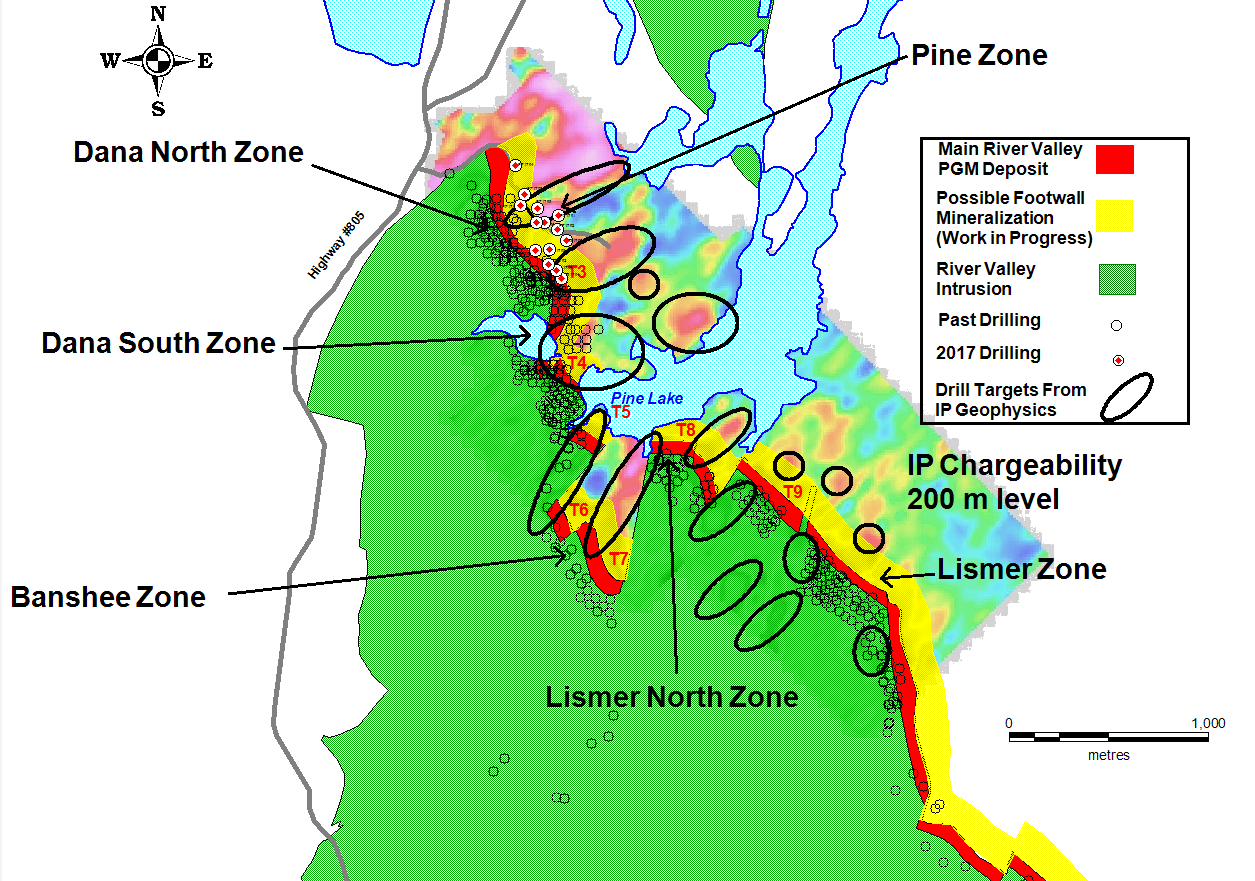
NAM plans to continue to improve the River Valley Project’s value proposition by drill testing geophysical anomalies found during the 2018 geophysics campaign, continuing the geophysical program throughout the 16 kilometres of the contact mineralization adding significant potential to find new deposits, drilling near the defined open pit shells to increase the mine life, drilling deeper to test the open-ended Deposit at depth, and re-assaying existing drill core for Rhodium in order that Rhodium may be added to the Project’s metal suite.
Technical Report: For readers to fully understand the information in this news release, they should read the PEA Technical Report in its entirety which the Company expects to file in accordance with NI 43-101 within 45 days from the date of this news release on SEDAR (www.sedar.com) and it will also be available at that time on the New Age Metals website, including all qualifications, assumptions and exclusions that relate to the PEA. The Technical Report is intended to be read in its entirety, and sections should not be read or relied upon out of context.
PEA Highlights (CDN$ unless otherwise noted):
- – Life of mine (LOM) of 14 years, with 6 million tonnes annually of potential process plant feed at an average grade of 0.88 g/t Palladium Equivalent (PdEq) and process recovery rate of 80%, resulting in an annual average payable Pd production of 119,000 ounces
- – Pre-Production capital requirements: $495 M
- – Undiscounted cash flow before income and mining taxes of $586M
- – Undiscounted cash flow after income and mining taxes of $384M
- – Average unit operating cost of $19.50/tonne over the life-of-mine
- – LOM average operating cash cost of $971 per ounce (US$709/oz) and all-in sustaining cash cost of $972 per ounce (US$709/oz) at a 1.37 CDN: USD exchange rate.
- – A mining contractor will be engaged for the open pit mining
- – Pre-tax NPV (5%): $262M, After-tax NPV (5%): $139 M
- – Pre-tax IRR: 13%, After-tax IRR: 10%
- – Assumed metal prices of US$1,200/oz Pd, US$1,050/oz Pt, US$1,350/oz Au, US$3.25/lb Cu, US$8.00/lb Ni, US$35/lb Co
- – Using a + 20% Pd price sensitivity (to the base case of US$1,200/oz Pd) US$1,440 /oz Pd returns a pre-tax IRR of 19% and an after tax-IRR of 15%. Palladium price as of June 25, 2019 is US$1,510/oz Pd, which would return a pre-tax IRR of 21% and an after-tax IRR of 16%.
- – River Valley process plant feed will be treated by a conventional sulphide flotation process plant to produce a single saleable PGM concentrate that will be transported to the Sudbury area for smelting/refining
- – Potential for up to 325 jobs at the peak of production
PEA Summary
The PEA parameters are summarized in Table 1.
(*) Cautionary statement NI 43-101: The PEA was prepared in accordance with National Instrument 43-101 Standards of Disclosure for Mineral Projects (“NI 43-101”). Readers are cautioned that the PEA is preliminary in nature. It includes Inferred Mineral Resources that are considered too speculative geologically to have the economic considerations applied to them that would enable them to be categorized as Mineral Reserves, and there is no certainty that the PEA will be realized. Mineral Resources that are not Mineral Reserves do not have demonstrated economic viability. All currency is stated as CDN$ unless stated otherwise.
Table 1: PEA Summary Parameters
| Assumptions | |
| Palladium Price (Base case) US$/oz | 1,200 |
| Exchange Rate US$:CDN$ | 1.37 |
| Production Profile | |
| Total Tonnes Processed | 78,100,000 |
| Process Plant Head Grade PdEq g/t | 0.88 |
| Mine Life (years) | 14 |
| Daily process plant throughput (tpd) | 16,440 |
| Palladium Process Plant Recovery | 80% |
| Total Payable Palladium Equivalent Ounces | 1,600,000 |
| Average annual Palladium Production Ounces | 119,000 |
| Operating Costs | |
| Unit Operating Costs (per tonne processed) | 19.50 |
| Mining Costs | 10.20 |
| Processing Costs | 8.44 |
| G&A | 0.90 |
| LOM Average Cash Cost US$/oz | 709 |
| Capital Requirements | |
| Pre-Production Capital Cost | $495.1 M |
| Sustaining Capital Cost (Life of Mine) Including Salvage | $1.0 M |
| Project Economics | |
| Royalties | 3% (Buy down to 1.5% with $1,500,000 payment) |
| Royalty Payable After $1.5M Payment | $39.7 M |
| Taxes | $202.3 M |
| Pre-Tax | |
| NPV (5% Discount Rate) | $262 M |
| IRR | 13% |
| Payback (years) | 6.6 |
| Cumulative Undiscounted Cash Flows | $586 M |
| After-Tax | |
| NPV (5% Discount Rate) | $139 M |
| IRR | 10% |
| Payback (years) | 7.0 |
| Cumulative Undiscounted Cash Flows | $384 M |
Operating Cost
Table 2: Operating Cost Summary.
| OPERATING COST | LOM ($/t) | |
| Mining Cost | $/t material | 2.28 |
| Mining Cost | $/t feed | 10.20 |
| Processing Cost | $/t feed | 8.44 |
| G&A | $/t feed | 0.90 |
| Unit Operating | $/t feed | 19.50 |
Capital Cost
Table 3: Capital Cost Summary
| Development Capital | Initial (Y-2, Y-1) ($ M) | Sustaining ($’ M) | Total LOM ($’ M) |
| Mine Pre-Stripping | 17.3 | 17.3 | |
| Process Plant Incl. Indirects | 401.3 | 401.3 | |
| TMF | 8.0 | 8.0 | |
| Mine Site Infrastructure | 10.0 | 10.0 | |
| Office, Warehouse, Shops | 10.0 | 10.0 | |
| Owner Cost | 5.0 | 5.0 | |
| 10% Contingency | 43.4 | 43.4 | |
| Initial Project Capital | 495.1 | 495.1 | |
| Sustaining Capital | |||
| Closure Bond | 26.0 | 26.0 | |
| Salvage Value | -25.0 | -25.0 | |
| Total Sustaining Capital | 1.0 | 1.0 | |
| Total Capital | 495.1 | 1.0 | 496.1 |
Project Economics and Sensitivities
The economic results of the PEA are summarized in Table 4 on an after-tax basis. The sensitivities and the impact of cash flows have been calculated for +/- 20% variations against the base case.
Table 4: Project Economics Sensitivity.
| Project Sensitivity Analysis | ||||||||||
| Pd Price Sensitivity | ||||||||||
| % | -20% | -15% | -10% | -5% | Base Case | +5% | +10% | +15% | +20% | Spot |
| US$/oz | 960 | 1,020 | 1,080 | 1,140 | 1,200 | 1,260 | 1,320 | 1,380 | 1,440 | 1,510 |
| NPV (CDN$ M) | -23 | 16 | 59 | 98 | 139 | 179 | 220 | 260 | 300 | 347 |
| IRR (%) | 4 | 6 | 7 | 8 | 10 | 11 | 12 | 13 | 15 | 16 |
| OPEX Sensitivity | ||||||||||
| % | -20% | -15% | -10% | -5% | Base Case | +5% | +10% | +15% | +20% | |
| Cost Per Tonne | 16 | 17 | 18 | 18 | 19 | 20 | 21 | 22 | 23 | |
| NPV (CDN$ M) | 212 | 194 | 175 | 157 | 139 | 120 | 102 | 83 | 68 | |
| IRR (%) | 14 | 12 | 11 | 10 | 10 | 9 | 8 | 7 | 7 | |
| CAPEX Sensitivity | ||||||||||
| % | -20% | -15% | -10% | -5% | Base Case | +5% | +10% | +15% | +20% | |
| CAPEX (CDN$ M) | 397 | 422 | 446 | 471 | 496 | 521 | 546 | 570 | 595 | |
| NPV (CDN$ M) | 284 | 248 | 212 | 175 | 139 | 102 | 64 | 28 | -6 | |
| IRR (%) | 14 | 13 | 12 | 11 | 10 | 8 | 7 | 6 | 5 |
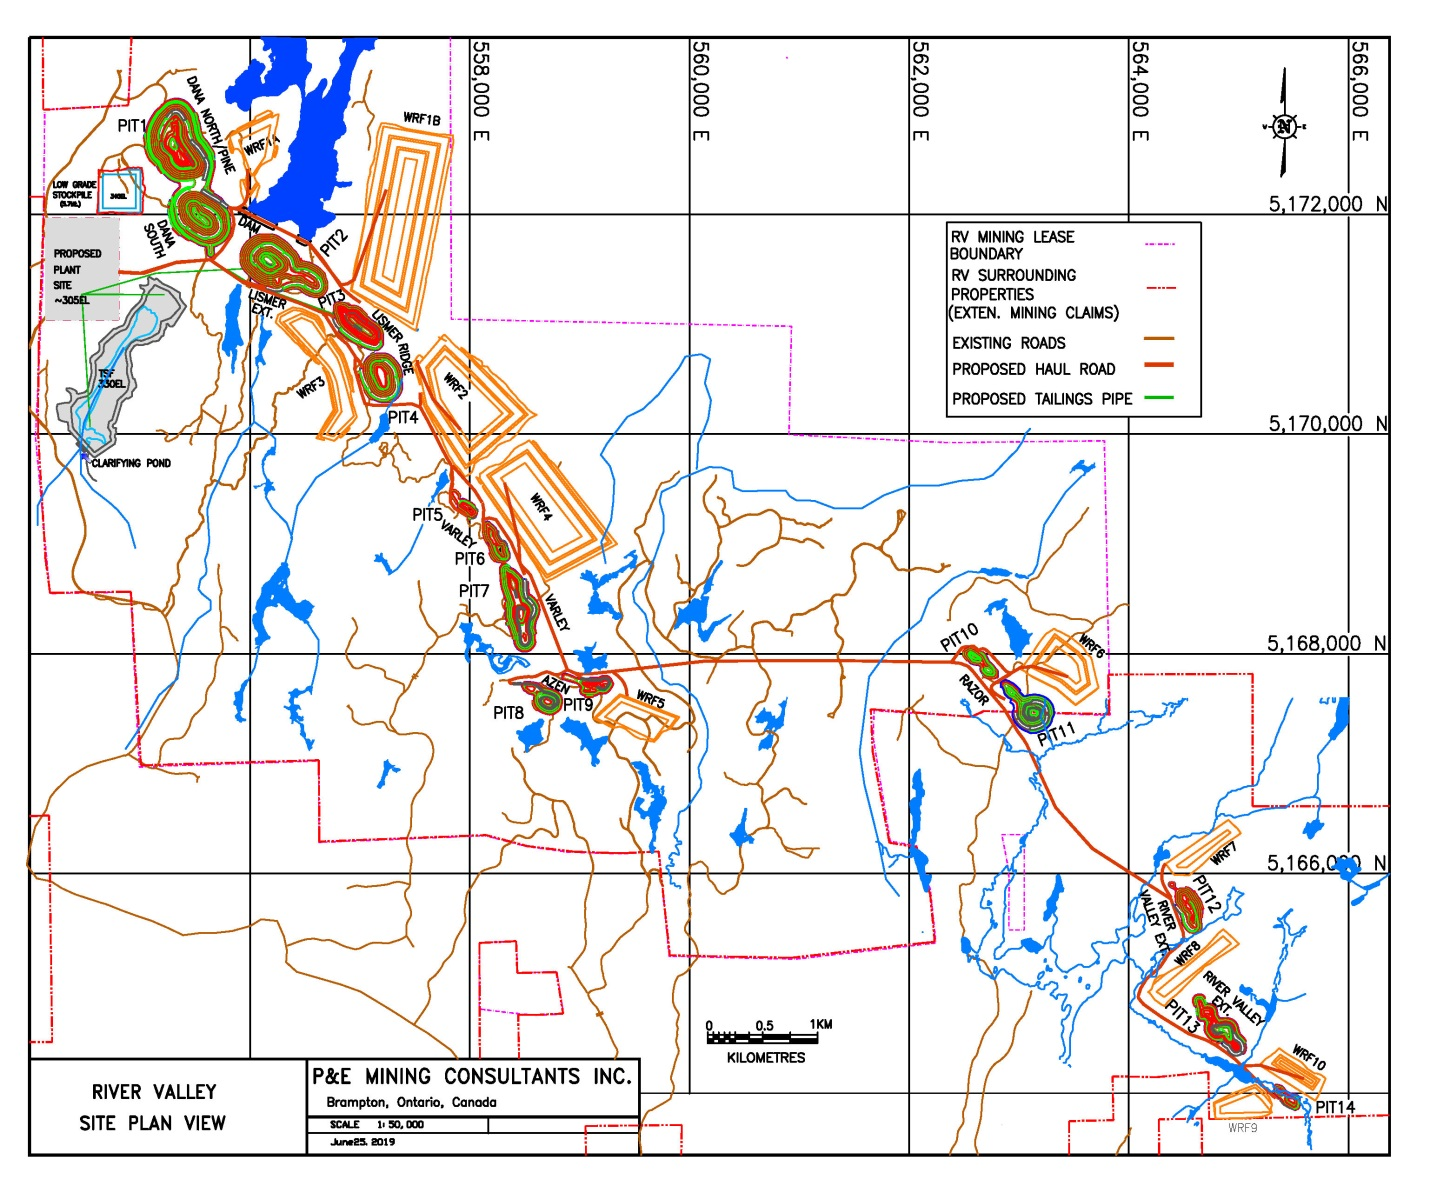
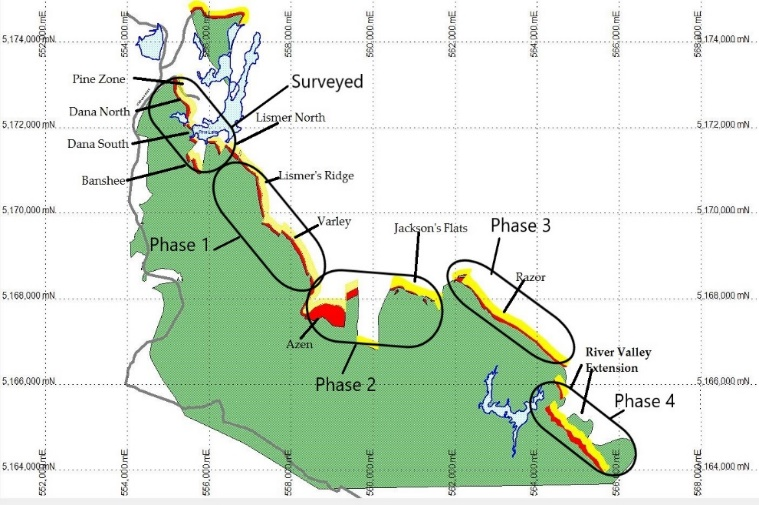
River Valley Project Site Plan
See the image below that shows a site plan from the River Valley PEA. The map shows all of the 14 open pits that have been used in the engineering design of the Project as well as the proposed process plant site, low-grade stockpile, waste rock storage facilities, tailings storage facility and site infrastructure.
Click Image To View Full Size
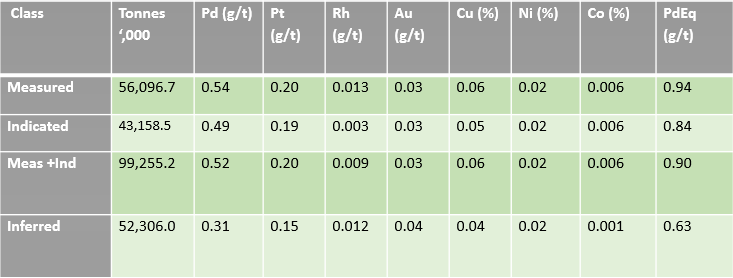
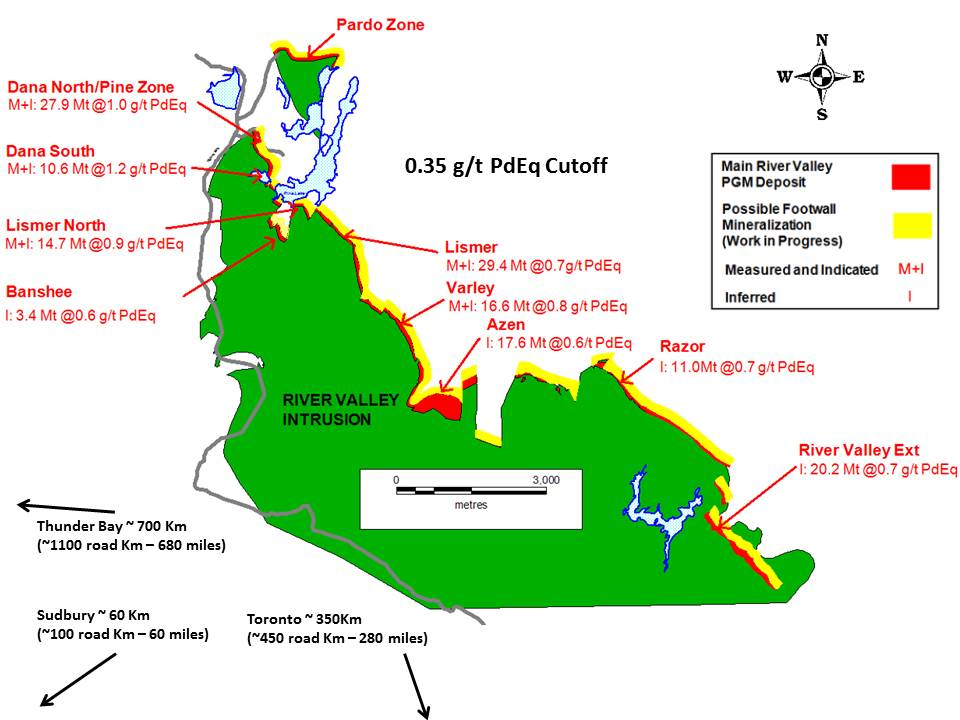
Mineral Resource
The pit constrained Mineral Resource Estimate which formed the basis of the PEA, is set out in Table 5 and was prepared by WSP under the supervision of Todd McCracken, P. Geo., an “Independent Qualified Person”, as defined in NI 43-101. The effective date of this Mineral Resource Estimate is January 9, 2019. The Mineral Resource database contains 710 boreholes with 106,554 assays records in the database, and 2,642 surface channel samplings. The Mineral Resource Estimate update was completed on the Dana North, Dana South, Pine, Banshee, Lismer, Lismer Extension, Varley, Azen, Razor, and River Valley Extension Zones, using the ordinary kriging (OK) methodology on a capped and composited borehole dataset consistent with industry standards. Validation of the results was conducted thought the use of visual inspection, swath plots and global statistical comparison of the model against inverse distance squared (ID2) and nearest neighbour (NN) models.
Table 5: Pit Constrained Mineral Resource Estimate for River Valley PGM Project – Effective January 9, 2019.
Click Image To View Full Size
| Class | PGM + Au (oz) | PdEq (oz) | PtEq (oz) |
| Measured | 1,394,000 | 1,701,000 | 1,701,000 |
| Indicated | 983,000 | 1,166,000 | 1,166,000 |
| Meas +Ind | 2,377,000 | 2,867,000 | 2,867,000 |
| Inferred | 841,000 | 1,059,000 | 1,059,000 |
Notes:
- 1.CIM definition standards were followed for the Mineral Resource Estimate.
- 2.The 2018 Mineral Resource models used Ordinary Kriging grade estimation within a three-dimensional block model with mineralized zones defined by wireframed solids.
- 3.A base cut-off grade of 0.35 g/t PdEq was used for reporting Mineral Resources in a constrained pit and 2.00 g/t PdEq was used for reporting the Mineral Resources under the pit.
- 4.Palladium Equivalent (PdEq) calculated using (US$): $950/oz Pd, $950/oz Pt, $1,275/oz Au, $1,500/oz Rh, $2.75/lb Cu, $5.25/lb Ni, $36/lb Co.
- 5.Numbers may not add exactly due to rounding.
- 6.Mineral Resources that are not Mineral Reserves do not have economic viability
7. The Inferred Mineral Resource in this estimate has a lower level of confidence than that applied to an Indicated Mineral Resource and must not be converted to a Mineral Reserve. It is reasonably expected that the majority of the Inferred Mineral Resource could be upgraded to an Indicated Mineral Resource with continued exploration.
Mining and Processing
The PEA is preliminary in nature, and includes Inferred Mineral Resources that are considered too speculative geologically to have the economic considerations applied to them that would enable them to be categorized as Mineral Reserves. There is no certainty that the Preliminary Economic Assessment will be realized.
The River Valley Project is expected to be mined by a contractor. Initial mining will occur at the northwest end of the Deposit, close to the proposed process plant site. A series of 14 open pits will be mined, and will progress in a southeasterly direction. Pit numbers 1 to 4 contain the bulk of the mineralized process plant feed.
Annual process plant feed of up to 6 Mtpy (0.5 Mtpm) is planned, at an average strip ratio of 3.6:1 over the life-of-mine. It is anticipated that a fleet of 221 t haul trucks, 29 m3 excavators and 254 mm diameter hole rotary drills will be utilized, following industry standard conventional open pit mining techniques.
The process plant is designed to produce a single saleable PGM concentrate using conventional sulphide flotation techniques. The concentrate will be trucked to a smelter/refinery in the Sudbury area.
The Run-Of-Mine (ROM) feed from the mine will be crushed in a single primary jaw crushing stage prior to the grinding circuit. The crusher discharge will be conveyed to a live stockpile, which will provide an operating buffer between the crushing and grinding circuits.
The grinding circuit will consist of a SAG mill in closed circuit with a pebble crusher and two ball mills in parallel.
The process plant design considers three stages of cleaner flotation and is designed to process 21,920 tpd (6.0 Mtpy) of ROM feed.
The flotation circuit configuration and design are based on the locked cycle tests conducted by SGS Canada in 2013.
Concentrate and tailings products will be dewatered using high-rate thickeners and the concentrate will be further dewatered by conventional plate and frame vacuum filtration.
Process water will be recovered from the concentrate and tailings thickener overflow. Raw water is assumed to be sourced from the local environment and will be used as makeup water. It is assumed that 10% of the raw water requirement will be recycled from the tailings pond.
Conventional tailings deposition techniques will be utilized.
A 230 kV transmission line is located passing through the village of Warren, approximately 22 km from the Project. A 115 kV transmission line passes through the village of Field, located approximately 15 km to the east of the Project. It is assumed that electrical power will be provided by the local utility via either of these overland power lines. Diesel generators will be used to supply emergency power.
Project Enhancement Opportunities
The PEA demonstrates that River Valley has the potential to be economically viable. The PEA also outlines several opportunities to enhance Project value. Additional opportunities include:
Qualified Persons and NI 43-101 Disclosure
The PEA was prepared under the supervision of Eugene Puritch, P.Eng. of P&E Mining Consultants Inc. The Mineral Resource Estimate was prepared by Todd McCracken, P.Geo. of WSP Canada Inc. Metallurgical testwork and process plant design and cost estimates were prepared by Jim Kambossos, P. Eng. of DRA Americas Inc. All three are independent Qualified Persons in accordance with NI 43-101. Mr. Puritch has reviewed and approved the technical information in this release. Michael Neumann, P.Eng. Managing Director for NAM is the company Qualified Person as defined by National Instrument 43-101 and has reviewed and approved the technical content of this news release.
On behalf of the Board of Directors
“Harry Barr”
Harry G. Barr, Chairman and CEO
For further information on New Age Metals, please contact Harry Barr and/or Anthony Ghitter, Business Development at 613-659-2773, or [email protected]
Neither the TSX Venture Exchange nor its Regulation Services Provider (as that term is defined in the policies of the TSX Venture Exchange) accepts responsibility for the adequacy or accuracy of this release.
Cautionary Note Regarding Forward Looking Statements: This release contains forward-looking statements that involve risks and uncertainties. These statements may differ materially from actual future events or results and are based on current expectations or beliefs. For this purpose, statements of historical fact may be deemed to be forward-looking statements. In addition, forward-looking statements include statements in which the Company uses words such as “continue”, “efforts”, “expect”, “believe”, “anticipate”, “confident”, “intend”, “strategy”, “plan”, “will”, “estimate”, “project”, “goal”, “target”, “prospects”, “optimistic” or similar expressions. These statements by their nature involve risks and uncertainties, and actual results may differ materially depending on a variety of important factors, including, among others, the Company’s ability and continuation of efforts to timely and completely make available adequate current public information, additional or different regulatory and legal requirements and restrictions that may be imposed, and other factors as may be discussed in the documents filed by the Company on SEDAR (www.sedar.com), including the most recent reports that identify important risk factors that could cause actual results to differ from those contained in the forward-looking statements. The Company does not undertake any obligation to review or confirm analysts’ expectations or estimates or to release publicly any revisions to any forward-looking statements to reflect events or circumstances after the date hereof or to reflect the occurrence of unanticipated events. Investors should not place undue reliance on forward-looking statements.


