- Retained Ms. Patricia Stirbys, J.D., LL.M, to help develop a comprehensive indigenous engagement and community relations program
- Ms. Stirbys is a member of Cowessess First Nation and specializes in engaging Indigenous groups
VANCOUVER, British Columbia, Sept. 10, 2019 (GLOBE NEWSWIRE) — Labrador Gold Corp. (TSX-V: LAB) (“Labrador Gold†or the “Companyâ€) is pleased to announce that it has retained Ms. Patricia Stirbys, J.D., LL.M, a member of Cowessess First Nation, to help it develop a comprehensive indigenous engagement and community relations program.
Ms. Stirbys has over 20 years of experience in law, negotiations and policy, specializing in engagement with Indigenous groups. She has an excellent understanding of Indigenous peoples, issues and challenges along with an understanding of the mining sector. Ms. Stirbys has engaged with Indigenous communities in most provinces, including First Nations in B.C., Saskatchewan, Ontario, Quebec and Newfoundland-Labrador. She has successfully negotiated agreements with Indigenous groups across Northern Ontario, particularly First Nation communities within the Ring of Fire.
“We are very pleased to have Ms. Stirbys join the Labrador Gold team,†said Roger Moss, President and Chief Executive Officer of Labrador Gold. “Her significant experience in indigenous relations will be a valuable asset as we move forward with engagement and consultation with the community of Matimekush-Lac John.â€
The Company is committed to maintaining respectful relations with the community and to understanding their concerns as we find a way to work in the region to the benefit of all stakeholders.
The Company also announces the grant of 100,000 options to purchase common shares of the Company to Ms. Stirbys. The options vest 50% on grant and 50% after six months and are exercisable for a price of $0.25 for a period of five years.
Roger Moss, PhD., P.Geo., is the qualified person responsible for all technical information in this release.
About Labrador Gold:
Labrador Gold is a Canadian based mineral exploration company focused on the acquisition and exploration of prospective gold projects in the Americas. In 2017 Labrador Gold signed a Letter of Intent under which the Company has the option to acquire 100% of the 896 square kilometre (km2) Ashuanipi property in northwest Labrador and the Hopedale (458 km2) property in eastern Labrador.
The Hopedale property covers much of the Hunt River and Florence Lake greenstone belts that stretch over 80 km. The belts are typical of greenstone belts around the world, but have been underexplored by comparison. Initial work by Labrador Gold during 2017 shows gold anomalies in soils and lake sediments over a 3-kilometre section of the northern portion of the Florence Lake greenstone belt in the vicinity of the known Thurber Dog gold showing where grab samples assayed up to 7.8g/t gold. In addition, anomalous gold in soil and lake sediment samples occur over approximately 40 kilometres along the southern section of the greenstone belt (see news release dated January 25th 2018 for more details). Labrador Gold now controls approximately 57km strike length of the Florence Lake Greenstone Belt.
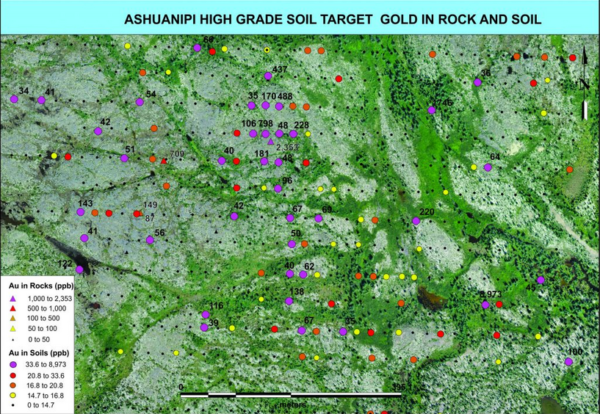
The Ashuanipi gold project is located just 35 km from the historical iron ore mining community of Schefferville, which is linked by rail to the port of Sept-Iles, Quebec in the south. The claim blocks cover large lake sediment gold anomalies that, with the exception of local prospecting, have not seen a systematic modern day exploration program. Results of the 2017 reconnaissance exploration program following up the lake sediment anomalies show gold anomalies in soils and lake sediments over a 15 kilometre long by 2 to 6 kilometre wide north-south trend and over a 14 kilometre long by 2 to 4 kilometre wide east-west trend. The anomalies appear to be broadly associated with magnetic highs and do not show any correlation with specific rock types on a regional scale (see news release dated January 18th 2018). This suggests a possible structural control on the localization of the gold anomalies. Historical work 30 km north on the Quebec side led to gold intersections of up to 2.23 grams per tonne (g/t) Au over 19.55 metres (not true width) (Source: IOS Services Geoscientifiques, 2012, Exploration and geological reconnaissance work in the Goodwood River Area, Sheffor Project, Summer Field Season 2011). Gold in both areas appears to be associated with similar rock types.
The Company has 57,039,022 common shares issued and outstanding and trades on the TSX Venture Exchange under the symbol LAB.