Agoracom Blog Home

Posts Tagged ‘#Drilling’

Countries Went On A Gold-Buying Spree Before Coronavirus Took Hold SPONSOR: American Creek $AMK.ca $TUD.ca $SII.ca $GTT.ca $AFF.ca $SEA.ca $SA $PVG.ca $AOT.ca $ESK.ca

Posted by AGORACOM at 10:58 AM on Friday, May 22nd, 2020

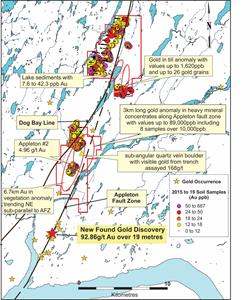
SPONSOR: American Creek owns a 20% Carried Interest to Production at the Treaty Creek Project in the Golden Triangle. 2019’s first hole averaged 0.683 g/t Au over 780m in a vertical intercept. 2020 drilling plans 18,000 to 20,000 metres from 7-10 drill platforms with four diamond drill rigs. The Treaty Creek property is located in the same hydrothermal system as the Pretivm and Seabridge’s KSM deposits and is fully funded for exploration in 2020. Click Here For More Info

The global economy was flashing danger signs long before the pandemic. For one thing, many countries were clamouring to get hold of as much gold as possible. For the past decade, they have been buying new reserves and bringing it home from overseas storage to an extent never seen in modern times. Then just before the pandemic, there was a pause. What does all this mean?

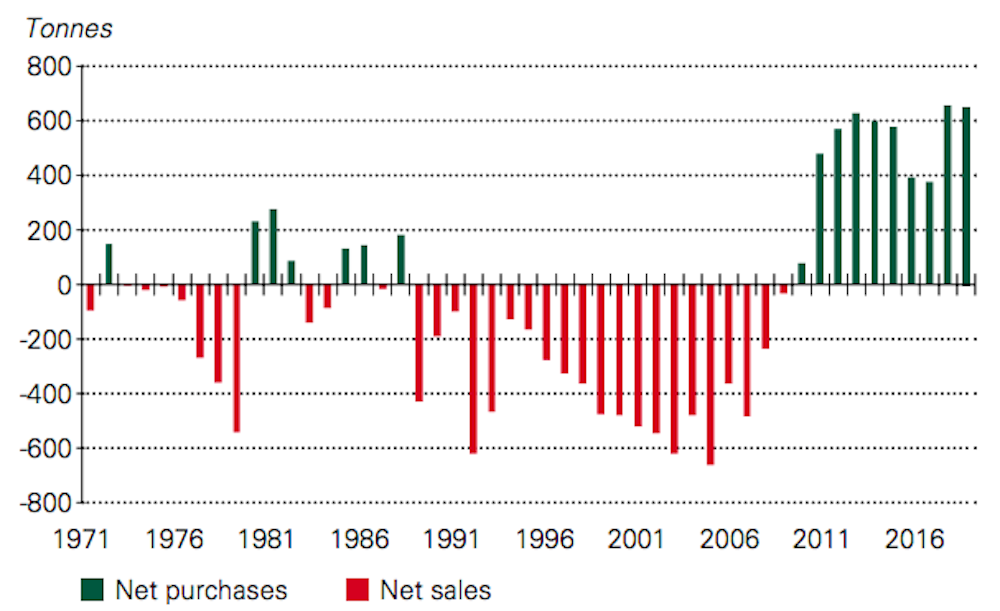
Central banks added 650 tons to their reserves in 2019, the second highest shift in 50 years, after the 656 tons added in 2018. Before the 2007-09 financial crisis, central banks were net sellers of gold worldwide for decades. Leading the recent spree has been China, Russia, Turkey, Kazakhstan and Uzbekistan.

Central bank gold buying 1971-2019

We have also seen a large effort by central banks to repatriate their gold from other countries, mostly from storage in New York and London.

Gold has enthralled humanity since ancient times. Still it glitters from central bank vaults to jewellery bazaars the world over. The Conversation brings you five essential briefings by academic experts on the world’s favourite precious metal. For more articles written by experts, join the hundreds of thousands who subscribe to our newsletter

Venezuela started repatriating its gold in 2011, shipping 160 tonnes from New York. A third of its holdings remain in London, but only because the Bank of England won’t repatriate them – declaring it doesn’t recognise the government in Caracas. Venezuela has now made this the subject of a legal claim.

Between 2012 and 2017, Germany repatriated most of its massive reserve from Paris and New York to Frankfurt. The Netherlands did likewise in 2014, followed by Austria.

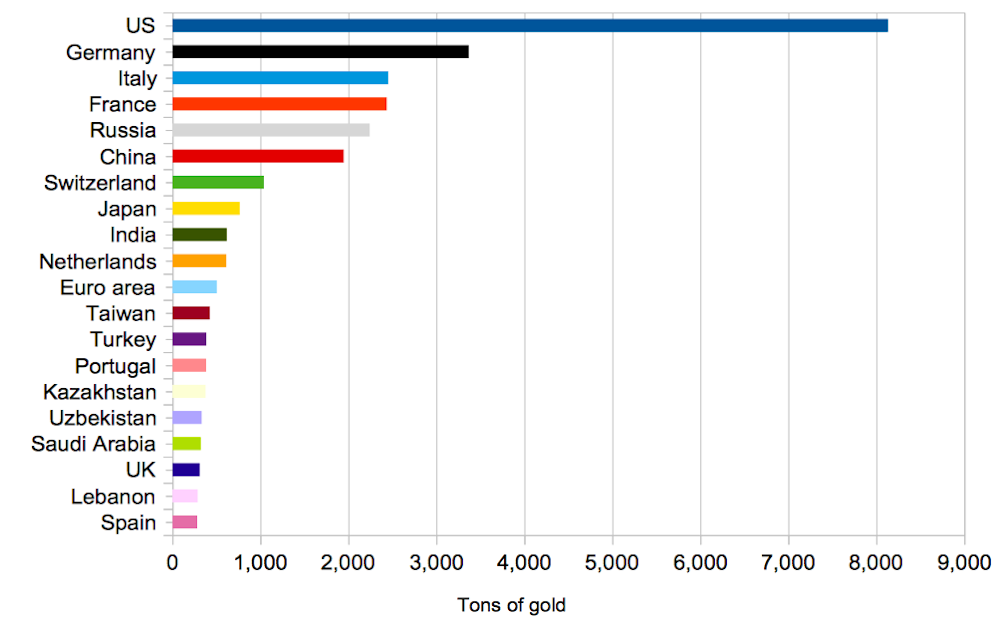
Top 20 national gold reserves

Then came Eastern Europe. In 2018, Hungary announced it would repatriate nearly 3 tons of gold from London, while greatly boosting its reserves. Poland repatriated 100 tons from London a year later, about half of its national reserve. Next was Romania, while Slovakia and Serbia have been considering moving gold home from England too.

Why it is happening?

This dash to gold is about geopolitics and economics. Gold serves as a patch mark of nationalist identity. To quote Adam Glapinski, governor of the National Bank of Poland, “gold symbolises the strength of [a] country”.

Stocking up has made sense to many countries in the populist climate. It is also a sign of countries diversifying from dollars. The likes of Russia, China and even countries in Western Europe want to break the US dominance of the financial system, having seen it used as leverage in everything from economic sanctions to trade threats.

Following the last financial crisis, many also feared there was more to come. When former Slovak prime minister Robert Fico last year urged his parliament to compel the central bank to repatriate gold from London, he argued that overseas reserves could be at risk in a new global economic crisis.

Citing the 1938 Munich pact between France, Britain, Italy and Germany that allowed the German invasion of Czechoslovakia, he said that “sometimes your international partners can betray you”.

Countries also seem unnerved by the row over Venezuela’s gold, plus the fact that Germany’s repatriated bars from the US appeared different to what it thought was in store. This suggested the Federal Reserve was trading them.

Fiat vs gold

In an era where everything is digital, fast and smart, it might sound strange that a static piece of metal could still have a major monetary role. Central banks abandoned the gold standard in the 1970s, led by US President Richard Nixon, which meant that paper currencies were no longer exchangeable for gold. This was necessary because there were too many dollars in the international system and too many countries exercising their right to exchange them for US gold reserves.

After Nixon’s decision, currencies became fiat, meaning that countries could freely decide how much to have in circulation. Currencies now had value not because they were backed by gold, but because the state standing behind them said they had value. Central banks effectively declared gold to be a relic. Fiat money was seen as superior, thanks to central bankers’ supposedly scientific oversight of monetary policy.

The new dash for gold makes economists pause and wonder what is happening. It seems to show many countries looking for a safe haven in these years in which interest rates have been very low and central banks have been printing large amounts of money to stimulate the global economy. Gold continues to have intrinsic value, so it reassures countries – especially if they fear inflation and downturns.

And yet, just as economic uncertainty was about to move to a whole new level with the pandemic, this trend lost momentum. Additions to the gold holdings of central banks and other international institutions in the three months to January 2020 – the most recent figure available – were just 67 metric tons, the least since August 2018.

In truth, this was not entirely surprising. Purchasing bullion at close to a seven-year high, and after a month of prices fluctuating plus or minus about 13%, is no particularly prudent way to consolidate economic and geopolitical power.

It will be a few months before we see how the pandemic has affected central banks’ attitude to gold. It could yet convince them that gold will still move higher. So don’t be surprised if this dash to gold has resumed in recent weeks – in a leading indicator of troubling times ahead.

SOURCE: https://www.yahoo.com/news/countries-went-gold-buying-spree-143228896.html

Affinity Metals Corp. Congratulates Advisor Ronni Stoeferle on Upcoming “In Gold We Trust” 2020 Publication and Announces Granting of Incentive Option $SII.ca $TUD.ca $GTT.ca $AMK.ca $OSK.ca $RKR.ca

Posted by AGORACOM at 10:00 AM on Thursday, May 21st, 2020
This image has an empty alt attribute; its file name is Affinity_Metals_Corp_Logo.png

Vancouver, British Columbia–(Newsfile Corp. – May 21, 2020) – Affinity Metals Corp. (TSXV: AFF) (“the Corporation”) (“Affinity”) congratulates Advisor Ronni Stoerferle regarding the upcoming much anticipated May 27th publication of the 2020 edition of the “In Gold We Trust” report.

The “In Gold We Trust” report is the preeminent research report for the gold industry as it relates to the state of the global economy in general. The 2020 edition will be in excess of 350 pages of all things gold (and silver). The Wall Street Journal has referred to the report as the “Gold Standard of Gold Research”. The report is free and is available for download on May 27th at the following web address:

Startseite 2024

In Gold We Trust

Ronni Stoeferle, Founding Affinity Advisory Board Member, and Rob Edwards, Affinity CEO were recently interviewed on the Agoracom network. The interview covers key information regarding the present state of the gold and silver market as well as Affinity’s Regal Project. The interview may be viewed here:

https://agoracom.com/ir/AffinityMetals/forums/discussion/topics/740923-interview-affinity-metals-discusses-strengthening-gold-market-and-developments-at-regal-project/messages/2268065#message

Granting of Incentive Options

The Corporation has granted a total of 1,000,000 incentive stock options under the Corporation’s stock option plan to certain Directors, Officers, Contractors and Advisors of the Corporation. The options were granted at a deemed price of $0.17 and are exercisable until May 20, 2030. The incentive options are subject to a hold period of four months and a day from issuance.

The granting of options is subject to approval by the TSX Venture Exchange.

About Affinity

Affinity Metals is a Canadian mineral exploration company focused on advancing the Regal polymetallic project located near Revelstoke, British Columbia.

Drill results from preliminary drilling on the Regal project were recently announced and included a significant new silver discovery in the Allco area of the property with drill hole #10 intersecting 11.10 meters of 143.29 g/t silver including 0.55 meters of 2612.0 g/t silver. This intersection also carried high grade zinc and lead with some copper.

Planning for the upcoming Regal exploration program is underway with details to be announced once finalized.

On behalf of the Board of Directors

Robert Edwards, CEO and Director of Affinity Metals Corp.

Contact information for Mr. Edwards is [email protected]

INTERVIEW: Affinity Metals $AFF.ca Discusses Strengthening Gold Market and Developments at Regal Project $SII.ca $TUD.ca $GTT.ca $AMK.ca $OSK.ca $RKR.ca

Posted by AGORACOM-JC at 9:13 AM on Thursday, May 21st, 2020
This image has an empty alt attribute; its file name is Affinity_Metals_Corp_Logo.png

Recent interview with Ronni Stoerferle, Founding Affinity Advisory Board member and Rob Edwards, Affinity CEO regarding the strengthening gold market and the developments at Affinity’s Regal Project. Some good perspective on future potential of Affinity in this strengthening bull market.

Silver Begins to Accelerate Higher Faster Than Gold SPONSOR: Affinity Metals $AAF.ca $SII.ca $TUD.ca $GTT.ca $AMK.ca $OSK.ca $RKR.ca

Posted by AGORACOM at 9:15 AM on Wednesday, May 20th, 2020
This image has an empty alt attribute; its file name is Affinity_Metals_Corp_Logo.png

Sponsor: Affinity Metals Corp. (TSX-V: AFF) is a Canadian mineral exploration company building a strong portfolio of mineral projects in North America. The Corporation’s flagship property is the drill ready Regal Property near Revelstoke, BC where Affinity Metals is making preparations for a spring drill program to test two large Z-TEM anomalies. Click Here for More Info

  • The current Gold to Silver ratio high is nearly 120

Precious metals have been on our radar for many months and, if you’ve been paying attention, you probably already know our research suggests Gold and Silver are one of the best investments you can make right now.  Recently, we shared this article suggesting Gold would need to rally above our proprietary Fibonacci Price Amplitude Arc (GREEN Arc) level near $1745 before it would attempt a bigger upside price move.  Additionally, just a few days ago we published this article suggesting Silver would begin to rally even faster than gold.

Today, both Gold and Silver are making bigger upside price moves with Silver up over 3% while Gold is up 1.3%.  We believe this nearly 250% faster Silver advance may be the start of what we have been predicting for many months – an incredible parabolic upside price advance in BOTH Gold and Silver.

Earlier research by our team suggested that a set up would happen in Precious Metals where Silver began advancing much faster than Gold and that this move would likely prompt a downside move in the Gold to Silver Ratio targeting the 50 to 65 level.  Our earlier research suggests when this move/setup begins, we could begin to experience a nearly 250% to 350% rally in gold, targeting $3750 or higher, and a 550% to 650% rally in Silver, targeting over $70, over a 12+ month span of time.  This article, today, is alerting our readers that we believe this SETUP is happening right now and the upside rally in precious metals should begin to really accelerate over the next 5+ months.

Weekly Gold to Silver Ratio Chart

This Gold to Silver ratio chart (including GOLD and SILVER price levels) clearly illustrates what happens when the Gold to Silver ratio starts to collapse.  In 2009, the BLUE Gold to Silver ratio level began to collapse from 85 to 32 – well over 50 points (58%).  The current Gold to Silver ratio high is nearly 120. Another 58% collapse from that level would suggest the Gold to Silver ratio could fall to 50 (or further) which would indicate that both Gold and Silver could rally extensively throughout the next 12+ months.

Daily Gold Futures Chart

This Daily Gold chart highlights our proprietary Fibonacci Price Amplitude Arc system as well as our Fibonacci price modeling system.  Our researchers believe once Gold rallies above the GREEN Arc, it should begin to skyrocket higher in a series of upside price advances over the next few months or longer.  This 1.618 Fibonacci Price Amplitude Arc is acting as a strong resistance level currently.  Once Gold breaks above this level, a big rally may take place in Gold – which will drive further a bigger rally in Silver.

Weekly Gold Futures Chart

This Weekly Gold chart shows you what we expect to see happen over the next 30 to 60 days.  First, once Gold breaks the GREEN Arc level, a rally will take place driving Gold up to near $1999.  Then, Gold prices should stall and rotated downward a bit – targeting the $1900 to $1920 level.  After that, Gold will begin another upside price rally targeting $2100 or higher.

Ultimately, our upside price target for Gold is $3750 (many months into the future).  Yet we continue to believe this move in precious metals could be one of the biggest and fastest upside price moves in over 100 years.  We believe once this move really gets started, it will be almost impossible to accurately predict where the top will setup in Gold and Silver.

Weekly Silver Futures Chart

This Weekly Silver chart highlights the Pennant/FLAG formation that recently APEX’ed.  We suggested this setup would prompt a fairly strong upside price move in Silver targeting the $21 to $22 – establishing a new price high.  Just after the Apex completed, Silver stalled a bit before beginning a bigger upside move.  We believe this is the start of a Parabolic upside price move in metals that should not be overlooked by skilled technical traders.

Concluding Thoughts:

If there is one thing you should understand about this setup and the potential for the future is that between 2008 and 2011, Gold rallied over 300% while Silver rallied over 600% just after the Credit Crisis event. The current COVID-19 global economic crisis is likely much bigger than the 2008-09 Credit Crisis event and that is why we believe this is an incredible opportunity for skilled technical investors.

SOURCE:https://www.kitco.com/commentaries/2020-05-15/Silver-begins-to-accelerate-higher-faster-than-gold.html

Here’s 5 Reasons Why Gold Miners Have Massive Outperformance in the Tank SPONSOR: Labrador Gold $LAB.ca $RIO.ca $WHM.ca $SIC.ca $NXS.ca $NVO.ca

Posted by AGORACOM at 11:57 AM on Tuesday, May 19th, 2020

SPONSOR: Labrador Gold – Two successful gold explorers lead the way in the Labrador gold rush targeting the under-explored gold potential of the province. Exploration has already outlined district scale gold on two projects, including a 40km strike length of the Florence Lake greenstone belt, one of two greenstone belts covered by the Hopedale Project. Recently acquired 14km of the potential extension of the new discovery by New Found Gold’s Queensway project to the south. Click Here for More Info

As I write this note on a dreary Friday afternoon from Boulder, CO I am reminded of my town’s origin. Its first non-native settlers established the town 1858 as a base camp for gold and silver miners. Nestled literally at the foot of the Rockies, its location was ideal for supplying the Colorado mining boom at that time and by 1871 a railroad had been built to connect Denver, Golden, Boulder and the mining operations directly to the West of Boulder. One such mining operation was in what is still known as Gold Hill, which I highly recommend visiting for a live music and BBQ event the next time you are in Colorado (COVID permitting).

Today we may be in the early days of a different kind of gold boom. This time the boom isn’t because there are new gold reserves to be dug out of the ground. Rather, the steady supply of gold compared to the extraordinary growth of new money requires that the dollar value of the former must rise to keep parity with the latter. Indeed, the US money supply has grown by approximately 23% over the last 65 days, or about a 90% annualized rate. No wonder the price of gold is sitting near a cycle high of $1743/oz as of this writing. But even as the price of gold has risen in recent months, the gold miners themselves may be even larger beneficiaries of the US dollar supply shock. Below, we’ll list 5 simple reasons the gold miners could be in for a period of massive outperformance.

  • The price of gold miners relative to the price of gold is basically at a 25 year low. This implies quite a catch up trade if the price of the commodity produced by the miners remains at elevated levels or even rises from here. The price performance of the miners would have to outperform the price of gold by 500% to reach the old 2011 highs in relative performance.
  • The relative performance of gold miners relative to the S&P 500 remains at near a 25 year low. Gold miners would have to outperform the S&P 500 by 400% to get back to the 2011 highs in relative performance.
  • Valuation. Based on the price to EBITDA ratio (and about all the other valuation ratios), gold miners are cheaper than the overall market. From 2005-2016 gold miners pretty much always traded at a premium to the S&P 500, but now the miners are trading at a 15% discount.
  • Liquidity. In the age of COVID, stocks with the ability to service their debt obligations should arguably trade at a premium to the market. The gold miners have a current ratio (current assets/current liabilities) nearly twice that of the S&P 500 as a whioe (2.06 vs 1.28).
  • Solvency. In the age of COVID, stocks with balance sheets in line with their income statements should arguably trade at a premium to the market. The gold miners have debt to EBITDA about 75% lower than the overall market (1.16 vs 4.69).
  • Bonus chart. The global aggregate market value of gold miners is $260bn. This compares to the aggregate market value of the FAAMG (Facebook, Amazon, Apple, Microsoft, Google) stocks of $5.4tn and the market value of US Treasury debt outstanding of $25tn. So the gold miners, in aggregate, are worth about 5% of the value of just those 5 FAAMG stocks and 1% of the value of all the Treasury debt outstanding. What do you think would happen to the price of the gold miners if some of that capital left the FAAMGs or Treasury bonds and flowed into the gold miners?

SOURCE: https://www.knowledgeleaderscapital.com/2020/05/15/heres-5-reasons-why-gold-miners-have-massive-outperformance-in-the-tank/

Lack of New Major Gold Deposits: Discovery Numbers Dive in the Last Decade SPONSOR: Loncor Resources $LN.ca $ABX.ca $TECK.ca $RSG $NGT.to $GOLD $NEM

Posted by AGORACOM at 12:13 PM on Friday, May 15th, 2020

Sponsor: Loncor, a Canadian gold explorer controlling over 3.6 million high grade ounces outside of a Barrick JV. The Ngayu JV property is 200km southwest of the Kibali gold mine, operated by Barrick, which produced 814,000 ounces of gold in 2019. Barrick manages and funds exploration at the Ngayu project until the completion of a pre-feasibility study on any gold discovery meeting their Tier One investment criteria. Newmont $NGT $NEM owns 7.8%, Resolute $RSG owns 27% Management owns 29% Click Here for More Info

This image has an empty alt attribute; its file name is Loncor-Small-Square.png

New major gold discoveries have been on a decline this past decade, according to a report by S&P Global Market Intelligence.

During the past three years there were no major new gold discoveries, the report said. And during the past decade, there were only 25 new major discoveries.

Dwindling numbers are due to miners focusing on exploration around older mines, S&P Global said.

“The lack of new discoveries is the result of exploration focusing on older discoveries and later-stage assets,” wrote S&P Global principal research analyst Kevin Murphy. “While there are still plenty of gold assets to be developed, the lack of new major deposits being discovered means that the project pipeline is increasingly short of large, high-quality assets needed to replace ageing major gold mines.”

The 25 major deposits discovered in the last decade represent 154.3 million ounces or only 7% of all gold discovered since 1990. According to the S&P Global data, there were 278 major new gold deposits found between 1990-2019, totaling 2.19 billion ounces of gold reserves.

A major factor responsible for the drastic decline in the last ten years is the budget dedicated to new discoveries, Murphy pointed out. Instead of looking for new discoveries, explorers were zeroing in on known deposits around operating mines.

“The total for the past decade might only rise to about 266 million ounces once subsequent exploration efforts are completed,” Murphy noted. 

On top of lower budgets for new explorations, the COVID-19 outbreak is likely to negatively contribute to the lower discoveries rate going forward. 

“We do not expect the trend to reverse in the near term,” Murphy stated. “We expect quite the opposite in 2020 as COVID-19 impacts exploration plans by companies of all sizes.”

The junior miners’ exploration programs are likely to be affected the most by the coronavirus. “The largest impact will be reductions due to lockdowns or companies exercising caution with their personnel. We expect gold budgets to decline about 20% in 2020,” Murphy said. 

And this is not just in the gold sector with Murphy estimating total mining exploration spending to fall in 2020.

“Producers will not be spared, as they face lower metals prices and country-wide closures in areas in which they operate, sending their budgets an estimated 23% lower. As a result, we now expect global exploration budgets to fall 29% in 2020 to a total of US$6.9 billion,” Murphy said in another report published in April.

SOURCE:https://www.kitco.com/news/2020-05-14/-Lack-of-new-major-gold-deposits-Discovery-numbers-dive-in-the-last-decade-S-P-Global-Market-Intelligence.html

Barrick Rigs to Commence Drilling This Quarter on Several Priority Targets in the Ngayu Greenstone Belt, D.R. Congo $ABX.ca $TECK.ca $RSG $NGT.to $GOLD $NEM

Posted by AGORACOM at 9:34 AM on Thursday, May 14th, 2020
This image has an empty alt attribute; its file name is Loncor-Small-Square.png

TORONTO, May 14, 2020 (GLOBE NEWSWIRE) — Loncor Resources Inc. (“Loncor” or the “Company“) (TSX: “LN”; OTCQB: “LONCF”) is pleased to provide an update on its activities within the Ngayu Greenstone Belt, where the Company has a dominant foot-print through its joint venture with Barrick Gold (Congo) SARL (“Barrick”) and on its own majority-owned exploration licences and exploitation concessions, including the Imbo exploitation concession (76.29%) that contains the Adumbi deposit and its wholly-owned exploration licence containing the Makapela deposit

Barrick Joint Venture

Loncor recently received the quarterly exploration report from joint venture partner Barrick for the first quarter of 2020. As announced in February 2020, joint venture partner and operator Barrick had identified a number of priority drill targets within the 1,894 square kilometre joint venture land package at Ngayu and drilling was due to commence in March. Some delays were encountered at the border due to additional permitting requirements resulting from the COVID-19 situation but the two drill rigs are now at the Kibali mine site and are planned to be mobilised to Ngayu in the second quarter.

The first drill target is expected to be at Anguluku where an initial six core holes are planned. Depending on results, additional holes will be drilled at Anguluku or the drills will be moved to Salisa/Lybie where an initial twelve holes are planned. Other targets to be drilled include Yambenda/Yasua (see Figures 1 and 2 below).

A large component of Barrick’s Q1 2020 exploration program was focused on reconnaissance follow up. The goal of these reconnaissance studies was to delineate new targets for prioritisation and assess existing targets to advance them to the drilling stage or remove them from the resource triangle. At the time of reporting, of the eleven Areas of Interest identified during the last quarter, eight had been evaluated for potential of hosting tier 1 deposits. Two of the eight assessed did not pass the preliminary indicators to host tier 1 deposits.  This quarter’s further assessment was completed on the Andagbowa, Zunguluka, Makapela West and Imva South blocks. At Andagbowa, two new targets were delineated for follow up work.

Andagbowa is located to the northeast corner of the Ngayu concession and about 32 kilometres northeast of the Mambati base camp. It is characterised by complex lithological and structural settings, which includes the presence of folded and fractured banded ironstone formation (“BIF”) and the hinge of a belt scale fold. Previous work has shown localized low grade BLEG anomaly basins, intense alluvial artisanal activities and a lack of quartz pebbles in the streams which could suggest potential for disseminated style gold mineralization.

Exploration fieldwork completed during the quarter at Andagbowa aimed at gaining geological characteristics of the area in order to evaluate its potential and perspectivity for future detailed work. The fieldwork undertaken included preliminary exploration study combining geological, structure and alteration mapping and sampling for gold analysis. Structural data confirmed the interpreted open folding system with NNW fold axis occurring within the area close to the Makapela Intrusive. The identified NE-SW, E-W and NW-SE moderate to steeply dipping mineralized sheared zones are aligned along the regional fold and parallel to the interpreted domain boundary subsidiary fault which could play a part in controlling the distribution of gold mineralization, either hosting mineralization or by acting as conduit for hydrothermal fluids.

The preliminary exploration work at Andagbowa area revealed two potential prospects for future work; namely Bon Marche and Tozali.  The two prospects are characterized by sheared and brecciated rocks including BIF containing either stockworks of quartz veinelts or sheeted stringers of silica associated with pervasive sericite and weak disseminated fine to coarse sulphides.

Bon Marché prospect is located about 5 kilometres east of Bole Bole village; the area occurs structurally in the interpreted regional hinge and is characterized by:

  • NE and ENE trending mineralized shear zones (up to 12 metres wide) containing sheeted quartz stringers and veinlets associated with pervasive sericite hosted by metasediment rock. Each of the two shear zones is mined along 100 metre length by artisanal miners.  Assay results of up to 2 metres @ 1.07g/t Au was intercepted from channel sampling.
  • 2.5 kilometres folded and fractured BIF with weak disseminated sulphide and pervasive silica with 0.83 g/t Au from litho samples.
  • The potential hinge at Bon Marche is located 1.5 kilometres north of soil anomalies localized almost within the same hinge zone. 

While the Tozali prospect is located 6 kilometres south-east of Bon Marché and shows:

  • 1.5 kilometre potential NW trending brecciated BIF containing disseminated boxworks and stockworks of quartz-carbonate stringers. Received results revealed anomalised values up to 0.76g/t Au.

At the beginning of the quarter, LIDAR (Light Detection and Ranging remote sensing) surveys were also conducted on four exploration blocks in the joint venture. The benefits of LIDAR data compared to traditional aerial-photo-based interpretation are in more detailed identification of possible surface deposits, mapping lithology, structures and more precise edging of the geomorphologies, which could hold large scale deposits. This method also reflects more accurately the true ground surface in areas of dense vegetation. The results of the LiDAR surveys are being collated with other existing geological and geophysical layers to further generate and prioritise more targets.

Imbo Exploitation Permit (Loncor 76.29%)

Outside of the Barrick joint venture, exploration activities have continued on Loncor’s Imbo exploitation concession (76.29%) in the east of the Ngayu belt. Fieldwork by Loncor geologists have focused on the Imbo East prospect 12 kilometres west-southwest of Adumbi along the same mineralised structural trend. Gridding, soil and rock sampling are being undertaken over a strike length of 3.6 kilometres. Additional follow up will be dependent on assay results which are pending.

Qualified Person
Peter N. Cowley, who is President of Loncor and a “qualified person” as such term is defined in National Instrument 43-101, has reviewed and approved the technical information in this press release. 

About Loncor Resources Inc.
Loncor is a Canadian gold exploration company focussed on the Ngayu Greenstone Belt in the Democratic Republic of the Congo (the “DRC”).  The Loncor team has over two decades of experience of operating in the DRC.  Ngayu has numerous positive indicators based on the geology, artisanal activity, encouraging drill results and an existing gold resource base.  The area is 200 kilometres southwest of the Kibali gold mine, which is operated by Barrick Gold (Congo) SARL (“Barrick”).  In 2019, Kibali produced record gold production of 814,000 ounces at “all-in sustaining costs” of US$693/oz.  Barrick has highlighted the Ngayu Greenstone Belt as an area of particular exploration interest and is moving towards earning 65% of any discovery in 1,894 km2 of Loncor ground that they are exploring.  As per the joint venture agreement signed in January 2016, Barrick manages and funds exploration on the said ground at the Ngayu project until the completion of a pre-feasibility study on any gold discovery meeting the investment criteria of Barrick.  In a recent announcement Barrick highlighted six prospective drill targets and are moving towards confirmation drilling in 2020. Subject to the DRC’s free carried interest requirements, Barrick would earn 65% of any discovery with Loncor holding the balance of 35%.  Loncor will be required, from that point forward, to fund its pro-rata share in respect of the discovery in order to maintain its 35% interest or be diluted.

In addition to the Barrick JV, certain parcels of land within the Ngayu project surrounding and including the Makapela and Adumbi deposits have been retained by Loncor and do not form part of the joint venture with Barrick. Barrick has certain pre-emptive rights over the Makapela deposit.  Loncor’s Makapela deposit (which is 100%-owned by Loncor) has an indicated mineral resource of 614,200 ounces of gold (2.20 million tonnes grading 8.66 g/t Au) and an inferred mineral resource of 549,600 ounces of gold (3.22 million tonnes grading 5.30 g/t Au).  Adumbi and two neighbouring deposits hold an inferred mineral resource of 2.5 million ounces of gold (30.65 million tonnes grading 2.54 g/t Au), with 76.29% of this resource being attributable to Loncor via its 76.29% interest in the project.  

Resolute Mining Limited (ASX/LSE: “RSG”) owns 26% of the outstanding shares of Loncor and holds a pre-emptive right to maintain its pro rata equity ownership interest in Loncor following the completion by Loncor of any proposed equity offering. 

Additional information with respect to Loncor and its projects can be found on Loncor’s website at www.loncor.com.

For further information, please visit our website at www.loncor.com, or contact: Arnold Kondrat, CEO, Toronto, Ontario, Tel: + 1 (416) 366 7300.

Figure 1 Ngayu Belt.  Developing Prospectivity, Work Programs and Drill Targets for 2020

https://www.globenewswire.com/NewsRoom/AttachmentNg/572d4a28-b6e1-48d5-91bc-a419b7da1825

(From Barrick Q1 2020 joint venture report)

Figure 2 Geology of Lybie-Salisa with proposed drill holes

https://www.globenewswire.com/NewsRoom/AttachmentNg/3c3bbe85-9561-43ab-811b-8ad43e2b6e9d

(From Barrick Q1 2020 joint venture report)

Figure 1
Ngayu Belt. Developing Prospectivity, Work Programs and Drill Targets for 2020 (From Barrick Q1 2020 joint venture report)
Figure 2
Geology of Lybie-Salisa with proposed drill holes (From Barrick Q1 2020 joint venture report)

Labrador Gold $LAB.ca Provides Update on Kingsway Project $RIO.ca $WHM.ca $SIC.ca $NXS.ca $NVO.ca

Posted by AGORACOM at 8:23 AM on Wednesday, May 13th, 2020
  • Review of historical work as well as more recent exploration over the past four years shows excellent potential for a gold mineralized system at Kingsway.
  • Historical work showing subangular gold grains recovered from till samples indicate a source of 100 to 500 metres up ice.
  • A sub-angular boulder of quartz vein containing visible gold recovered from a trench with gold grains in till assayed 168 g/t Au. The source of the boulder has not been found.

TORONTO, May 13, 2020 (GLOBE NEWSWIRE) — Labrador Gold Corp. (TSX-V: LAB) (“LabGold” or the “Company”) is pleased to provide an update on its Kingsway Property near Gander, Newfoundland.

The two claim blocks that comprise the Kingsway Property cover over 14 kilometres of strike length of the potential extension of the Appleton fault zone which is associated with many of the gold showings, including the new discovery (downhole drill intersection of 92.86g/t Au over 19 metres), on New Found Gold’s Queensway project to the south. (Note that mineralization hosted on adjacent and/or nearby properties is not necessarily indicative of mineralization hosted on the Company’s property).

Since the Company acquired the option to acquire a 100% interest in the property (see news release dated March 3, 2020) it has been compiling historical data from work completed between 1989 and 2005. More recent exploration over the past four years has confirmed and expanded on this historical data and indicates the potential for a gold mineralized system at Kingsway.

Historical sampling of glacial till over the southern claim block showed gold values from below detection (<5ppb) to 89,000ppb (89g/t Au) in heavy mineral concentrates with 8 samples assaying over 10,000ppb (10g/t Au). Gold anomalies in the concentrates extend over three kilometres along the Appleton fault zone. Panning of till samples for gold grains showed between 2 and 13 grains in five samples from the south claim block and between 6 and 26 gold grains in six samples from the north claim block. Shape analysis of the gold grains showed many of them to be subangular, suggesting that they did not travel far from their source which was estimated to be between 100m and 500m up ice.

In addition, trenching in the vicinity of the high gold values in heavy mineral concentrates uncovered a subangular boulder of quartz vein containing visible gold which assayed 168 g/t Au. Neither the source of the boulder nor of the gold grains has been found.

Previous work suggests that gold mineralization is associated with regional structures, particularly where second order cross structures occur. This has been further demonstrated by the New Found Gold discovery to the south of the Kingsway Property, where gold mineralization appears to be related to structures cross cutting the Appleton fault zone. Despite the recognition of this control on mineralization early on, there does not appear to have been an attempt to target such structures in the drilling to date on the property. While historical drilling did not result in a discovery, there were indications of proximity to a mineralized system. In particular, a hole drilled near the heavy mineral concentrates with high gold values intersected approximately 22 metres of brecciated and silicified siltstone with numerous quartz stringers and quartz carbonate veins containing pyrite mineralization as stringers and blebs.

Exploration over the past four years by Torq Resources and Shawn Ryan included over 1,758 till samples 3,724 vegetation (spruce tips) samples 2,381 till XRF samples and 2,958 soil samples taken over a 45km by 15km (675 square kilometre) area. This work resulted in the identification of an area of 66 square kilometres most prospective for gold mineralization covered by the Kingsway north and south claim blocks. Till and vegetation sampling over the south claim block confirms the results of the historical work and identified new gold anomalies while the work on the northern claim block identified new gold anomalies associated with north-northeast trending magnetic lineaments that need to be followed up. On both claim blocks there is a close association between the gold anomalies and the Appleton or Dog Bay structures.

Gold anomalies in soil samples on the southern claim block occur to the west (up ice) of the historical gold anomalies in heavy mineral concentrates and may indicate a potential source area. More detailed sampling on a tighter spacing is required to test this interpretation.

On the northern claim block, which is covered by a historical detailed airborne Dighem survey, most of the gold anomalies are associated with north trending resistivity high/low contacts and NE cross cutting magnetic lineaments. Significant gold in soil anomalies occur both to the northwest and to the south east of three gold in lake sediment anomalies. The anomalies to the northwest also occur over anomalous gold in vegetation samples, whereas those to the south, where there is no detailed vegetation or till samples, occur in the vicinity of historical till samples assaying between 163 and 1,398 ppb Au that also contain gold grains.

The assays from the historical work presented here, while considered accurate, have not yet been verified by independent sampling as the Company has not been able to conduct fieldwork since acquiring the Project.

Roger Moss, President and CEO stated: “Historical exploration and more recent work has clearly demonstrated the potential of the Kingsway project for the discovery of orogenic gold deposits associated with deep seated structures. The presence of the Appleton and Dog Bay structures on the property with evidence of gold in till, vegetation, soil, stream sediments, lake sediments and float suggest the presence of a significant mineralized system. Detailed soil sampling combined with ground magnetic and VLF-EM are planned for the coming field season to define targets for subsequent drill testing. In the meantime, compilation and interpretation of the historical work continues to define the most prospective areas for successful follow up.”

Shawn Ryan, technical advisor stated: “The Kingsway Project covers some of the first claims I staked outside of the Yukon. It was based on extensive research and ground follow up. The government till sampling and historical work was very compelling in showing that the Appleton and Dog Bay Line structures are very anomalous in gold. The previous option holder conducted extensive regional till and vegetation sampling that outlined nice anomalous gold areas. I pared down the large claim block to the two best areas. The subsequent announcement of the New Found Gold high-grade intersection south of Kingsway has given the district the evidence needed that good gold grades are associated with regional NNE (Appleton) structures cross cut by NE trending structures. These same structural patterns are seen in the geophysics on the Kingsway project. I look forward to the follow up work to be conducted over the next couple of seasons.”

Roger Moss, PhD., P.Geo., is the qualified person responsible for all technical information in this release.

About Labrador Gold:

Labrador Gold is a Canadian based mineral exploration company focused on the acquisition and exploration of prospective gold projects in the Americas.

In early March 2020, Labrador Gold acquired the option to earn a 100% interest in the Kingsway project in the Gander area of Newfoundland. The property is along strike to the northeast of New Found Gold’s discovery of 92.86 g/t Au over 19.0 metres on their Queensway property. The two licenses comprising the Kingsway project cover approximately 16km of the Appleton fault zone which is associated with gold occurrences in the region, including the New Found Gold discovery. Historical work over the area covered by the Kingsway licenses shows evidence of gold in till, vegetation, soil, stream sediments, lake sediments and float. Infrastructure in the area is excellent located just 18km from the town of Gander with road access to the project, nearby electricity and abundant local water.

The Hopedale property covers much of the Florence Lake greenstone belt that stretches over 60 km. The belt is typical of greenstone belts around the world but has been underexplored by comparison. Initial work by Labrador Gold during 2017 show gold anomalies in soils and lake sediments over a 3 kilometre section of the northern portion of the Florence Lake greenstone belt in the vicinity of the known Thurber Dog gold showing where grab samples assayed up to 7.8g/t gold. In addition, anomalous gold in soil and lake sediment samples occur over approximately 40 kilometres along the southern section of the greenstone belt (see news release dated January 25th 2018 for more details).

The Ashuanipi gold project is located just 35 km from the historical iron ore mining community of Schefferville, which is linked by rail to the port of Sept Iles, Quebec in the south. The claim blocks cover large lake sediment gold anomalies that, with the exception of local prospecting, have not seen a systematic modern day exploration program. Results of the 2017 reconnaissance exploration program following up the lake sediment anomalies show gold anomalies in soils and lake sediments over a 15 kilometre long by 2 to 6 kilometre wide north-south trend and over a 14 kilometre long by 2 to 4 kilometre wide east-west trend. The anomalies appear to be broadly associated with magnetic highs and do not show any correlation with specific rock types on a regional scale (see news release dated January 18th 2018). This suggests a possible structural control on the localization of the gold anomalies. Historical work 30 km north on the Quebec side led to gold intersections of up to 2.23 grams per tonne (g/t) Au over 19.55 metres (not true width) (Source: IOS Services Geoscientifiques, 2012, Exploration and geological reconnaissance work in the Goodwood River Area, Sheffor Project, Summer Field Season 2011). Gold in both areas appears to be associated with similar rock types.

The Company has 57,039,022 common shares issued and outstanding and trades on the TSX Venture Exchange under the symbol LAB.

For more information please contact:

Roger Moss, President and CEO
Tel: 416-704-8291

Or visit our website at: 

www.labradorgold.com

Kingsway Compilation

Geochemical Anomalies on Kingsway Project

‘Something Big is Coming’; Gold’s Narrowing Range to Lead To Major Price Move SPONSOR Labrador Gold $LAB.ca $RIO.ca $WHM.ca $SIC.ca $NXS.ca

Posted by AGORACOM at 1:28 PM on Tuesday, May 12th, 2020

SPONSOR: Labrador Gold – Two successful gold explorers lead the way in the Labrador gold rush targeting the under-explored gold potential of the province. Exploration has already outlined district scale gold on two projects, including a 40km strike length of the Florence Lake greenstone belt, one of two greenstone belts covered by the Hopedale Project. Recently acquired 14km of the potential extension of the new discovery by New Found Gold’s Queensway project to the south. Click Here for More Info

(Kitco News) – Gold futures are behaving like a restless person taking a nap – with the market not moving much in either direction lately but yet tossing and turning a lot.

The metal has been in a narrowing range for nearly a month now, but sometimes making violent moves within that trading band. However, the pattern is forming a so-called wedge formation that should lead to a breakout in the not-too-distant future, some observers said.

“Something big is coming here,” said Sean Lusk, co-director of commercial hedging with Walsh Trading.

The formation is setting up for either an extension to the upside or a correction to the downside, he continued.

“I don’t see this being range-bound for much longer. The next couple of weeks should be tell-tale.”

The metal sold off in mid-March with other asset classes as investors had to generate cash when stocks were falling. The June futures bottomed at $1,453 an ounce in mid-March. The contract then climbed as high as $1,788.80 an ounce on April 14, then backed off to a low of $1,666.20 on April 21.

Since, the range has been narrowing, confined to a $1,676-$1,1735.50 band so far this month. The range narrowed even further to $1,692.10-$1,713.80 this week. So far on Tuesday, the metal is having an “inside day” on the charts in which the high and low are within the prior day’s trading range. The contract was up $12.80 to $1,710.80 an ounce as of 10:23 a.m. EDT.

“We leapt, then we’ve been basically in a pretty violent trading range, fighting to hang onto $1,700 an ounce with people looking for record highs in the future,” said Phil Flynn, senior market analyst with Price Futures Group. “We’ve seen a lull.”

Flynn described the underlying fundamental backdrop as still solid for gold, with governments undertaking massive fiscal stimulus and central bankers ultra-loose monetary policy. However, gold is being held back for the moment by a strong stock market and U.S. dollar, traders said.

“We are seeing a run back toward stocks and away from gold as a safe-haven play,” Flynn said. “So it’s been struggling a little bit.”

Lusk characterized the stock-market recovery as “outstanding” since the sell-off to the March lows that occurred on worries about the economic impact of the coronavirus pandemic.

“If the Dow Jones makes a run for 25,000, or perhaps 26,000, it seems ridiculous considering what’s going on with the economy shutting down,” Lusk said. “But those are things that will probably drive some money out of gold.”

Should stocks remain strong, gold conceivably could get “whacked” another $100, he said. Further, Lusk added, recent highs in the U.S. dollar have probably prompted some selling in gold.

But for now, the range has been narrowing, with buying on price dips.

“There’s a lack of conviction on both sides,” Lusk said. “You see a little bit of profit-taking. Then when we break below $1,700, we see some bargain buying come back into the market. That tells me it’s not over yet.”

There is still much uncertainty in the world, Lusk said. If economies open up, will they have to shut down again due to another wave of the cornonavirus? Markets are also watching to see whether a trade war between the U.S. and China heats up again.

“I think we’re pausing here and waiting for the next shoe to drop,” Lusk said. “The market is looking for a new catalyst one way or another.”

Longer-term structural issues in the economy are not likely to be resolved quickly, even if a vaccine for the virus is found, Lusk said. He also suggested there could be a stalemate between lawmakers in an election year.

Flynn commented that the underlying fundamentals for gold are still “very bullish” because of actions taken by the Federal Reserve.

“We know that low interest rates are supportive for gold,” Flynn said. “We know that quantitative easing is bullish for gold.”

Further, with markets hopeful that economies will start to reopen, physical demand for gold jewelry should start to improve, Flynn added.

On top of this, Lusk pointed out that lawmakers in Washington D.C. are talking about another round of massive fiscal stimulus of perhaps $3 trillion on top of what has already occurred. That could eventually weigh on the U.S. dollar.

Yet, Lusk continued, that doesn’t mean gold can’t correct lower again, especially since late spring and early summer tend to be seasonally weak periods for physical demand. In the current environment, Indian and Chinese demand has been soft, in particular.

Lusk commented that the market could fall to just below $1,600 an ounce or alternatively take off to $1,827.

“It’s kind of frustrating,” he said about the uncertainty facing traders art the moment. “I look for a more pronounced move in the next couple of weeks for sure.”

SOURCE: https://www.kitco.com/news/2020-05-12/-Something-big-is-coming-Gold-s-narrowing-range-to-lead-to-a-major-price-move-analysts.html

American Creek $AMK.ca Sells Minority Interest in Electrum Property Joint Venture to Tudor Gold $TUD.ca $SII.ca $GTT.ca $AFF.ca $SEA.ca $SA $PVG.ca $AOT.ca $ESK.ca

Posted by AGORACOM at 9:18 AM on Tuesday, May 12th, 2020

Cardston, Alberta–(Newsfile Corp. – May 12, 2020) – American Creek Resources Ltd. (TSXV: AMK) (“the Corporation”) (“American Creek”) today announced that it has executed an agreement with Tudor Gold Corp. (“Tudor”) whereby Tudor is buying out the Corporation’s 40% interest in the Electrum Project Joint Venture located near Stewart, British Columbia.

Tudor will pay American Creek $250,000 cash and issue 1,400,000 Tudor shares upon the transaction closing. The shares are subject to a standard four month hold period and a voluntary eight month hold as well.

This transaction is subject to approval by the TSX Venture Exchange.

Darren Blaney, American Creek CEO stated: “We think this transaction makes sense for American Creek and its shareholders as we are trading a minority interest in the Electrum property for non-dilutive operating cash as well as a substantial share position in Tudor which gives us more exposure to the upcoming Treaty Creek developments which we believe will be very significant.”

About American Creek

American Creek holds a strong portfolio of gold and silver properties in British Columbia.

Three of those properties are located in the prolific “Golden Triangle”; the Treaty Creek and Electrum joint venture projects with Tudor (Walter Storm) as well as the 100% owned past producing Dunwell Mine.

The Corporation also holds the Gold Hill, Austruck-Bonanza, Ample Goldmax, Silver Side, and Glitter King properties located in other prospective areas of the province.

For further information please contact Kelvin Burton at: Phone: 403 752-4040 or Email: [email protected]. Information relating to the Corporation is available on its website at www.americancreek.com