Posted by AGORACOM
at 3:16 PM on Tuesday, December 10th, 2019
SPONSOR: Advance Gold AAX.v – Advance Gold controls 100% interest in the Tabasquena Silver Mine in Zacatecas, Mexico. A cluster of 30 Epithermal veins have been discovered, with recent emphasis on exploring a large anomaly to drill. Advance also owns 13.5% of the Kakamega JV attached to Barrick Takeover Offer for Acacia Mining. Click Here For More Info
Opportunities
2019 is on track to be a 50-year high in central banks’ net gold
purchases. Bloomberg Intelligence reports that central banks have been
absorbing about 20 percent of global gold mine supply. Based on the
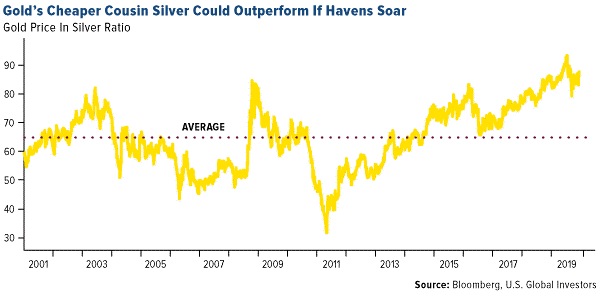
gold-to-silver ratio, it looks like silver might have more upside if
demand for safe haven assets rises. Bloomberg’s Eddie van der Walt
writes that the gold-silver ratio has dropped to 86 from 93 in July and
that means silver has outperformed on the back of gold’s gains. UBS
analyst Giovanni Staunovo is bullish on palladium and platinum. Staunovo
wrote in a December 5 report that palladium will likely enter its ninth
straight year of market deficit in 2020 and could climb above $2,000 an
ounce. Even as platinum is set to enter a surplus, its price could be
driven by gold. “As platinum is highly correlated to gold, our bullish
view for gold should mean higher platinum prices, which we expect to
trade at around $1,000 an ounce next year.â€
Zijin Mining Group Co. has agreed to buy Continental Gold in a
rare all-cash deal worth C$1.37 billion – the second big takeover in a
few weeks of a junior Canadian gold miner. Bloomberg reports the offer
reflects a 29 percent premium to the Continental Gold share price from
the past 20 days and that major shareholder Newmont Goldcorp was
supportive of the deal. In hostile M&A news, Centamin Plc rejected
Endeavour Mining Corp.’s $1.9 billion takeover offer saying that it
undervalues its assets, reports Bloomberg News. Centamin has been a
takeover candidate since the size of its Egyptian mine was discovered at
the start of the decade, though the company has faced many operational
setbacks.
Kinross Gold has been busy raising cash. Kinross announced this
week that it has agreed to sell its remaining shares of Lundin Gold for
C$150 million to Newcrest Mining and the Lundin Family Trust. Kinross
earlier announced that it has sold its royalty portfolio to Maverix
Metals for $74 million.
Threats
ABN Amro strategist Georgette Boele says they see gold weakening in the coming weeks and months with a price average of $1,400 an ounce. However, they do expect prices to increase to $1,600 by December of 2020. Before this happens, extreme net-long positioning would clear u p because “these positions currently hang over the market and prevent prices from moving substantially higher.â€
Another sign of a weakening economy was released last week. The ISM manufacturing PMI unexpectedly declined to 48.1 in November, below the median forecast of 49.2. The reading remains below the 50 level that indicates activity is shrinking.
Bloomberg’s Enda Curran writes that cheap borrowing costs have sent global debt to another record – $250 trillion of government, corporate and household debt. This level is almost three times global economic output and policymakers are now grappling with how to keep economies afloat – with more debt? According to Cornerstone Macro’s head of technical analysis Carter Worth, his S&P 500 chart signals a 5 to 8 percent decline in the coming months. Bloomberg reports that the S&P 500 fell 1.4 percent on Tuesday, pushing it below an upward trend line established in October.
Posted by AGORACOM
at 6:41 PM on Monday, December 9th, 2019
Sponsor: Affinity Metals (TSX-V: AFF) a Canadian mineral exploration company building a strong portfolio of mineral projects in North America. The Corporation’s flagship property is the Drill ready Regal Property near Revelstoke, BC. Recent sampling encountered bonanza grade silver, zinc, and lead with many samples reaching assay over-limits. Further assaying of over-limits has been initiated, results will be reported once received. Click Here for More Info
Posted by AGORACOM
at 2:21 PM on Thursday, December 5th, 2019
Ken Konkin Discusses the Goldstorm Deposit at Treaty Creek (including recent outstanding drill results like 0.725 g/t over 838.5m), it’s Potential, and 2020 Development Plans
American
Creek is a Canadian junior mineral exploration company with a strong
portfolio of gold and silver properties in British Columbia.
Three
of those properties are located in the prolific “Golden Triangleâ€; the
Treaty Creek and Electrum joint venture projects with Tudor Gold/Walter
Storm as well as the 100% owned past producing Dunwell Mine.
The
Treaty Creek Project is a Joint Venture with Tudor Gold owning 60% and
acting as operator. American Creek and Teuton Resources each have 20%
interests in the project. American Creek and Teuton are both fully
carried until such time as a Production Notice is issued, at which time
they are required to contribute their respective 20% share of
development costs. Until such time, Tudor is required to fund all
exploration and development costs while both American Creek and Teuton
have “free ridesâ€.
The
Corporation also holds the Gold Hill, Austruck-Bonanza, Ample Goldmax,
Silver Side, and Glitter King properties located in other prospective
areas of the province.
For further information please contact Kelvin Burton at: Phone: 403 752-4040 or Email: [email protected]. Information relating to the Corporation is available on its website at www.americancreek.com.
Hub on Agoracom FULL DISCLOSURE: American Creek is an advertising client of AGORA Internet Relations Corp.
Posted by AGORACOM
at 3:30 PM on Monday, December 2nd, 2019
Sponsor: Affinity Metals (TSX-V: AFF) a Canadian mineral exploration company building a strong portfolio of mineral projects in North America. The Corporation’s flagship property is the Drill ready Regal Property near Revelstoke, BC. Recent sampling encountered bonanza grade silver, zinc, and lead with many samples reaching assay over-limits. Further assaying of over-limits has been initiated, results will be reported once received. Click Here for More Info
Slovakia joins a host of countries seeking to repatriate
Serbia, Poland and Hungary have boosted their bullion reserves
Gold is all that nationalist leaders in Europe’s east can talk about these days.
Just
this week, Poland’s government touted its economic might after
completing the repatriation of 100 tons of the metal. Over in Hungary,
anti-immigrant Prime Minister Viktor Orban has been ramping up holdings
of the safe-haven asset to boost the security of his reserves.
Viktor Orban Photographer: Akos Stiller/Bloomberg
The gold rush mirrors steps by Russia and China to diversify reserves exceeding $3 trillion away from the dollar amid flaring geopolitical tensions with the U.S. Motivations in Europe’s ex-communist wing, however, can vary.
Take the latest example. Former Slovak Premier Robert Fico, who has a shot at returning to power, urges parliament to compel the central bank into bringing home gold stocks stored in the U.K.
The reason? Sometimes your international partners can betray you,
Fico said, citing a 1938 pact by France, Britain, Italy and Germany
allowing Adolf Hitler to annex a chunk what was then Czechoslovakia, and
— more recently — the Bank of England’s refusal to return Venezuela’s gold stock over political differences.
“You can hardly trust even the closest allies after the Munich Agreement,†Fico told reporters. “I guarantee that if something happens, we won’t see a single gram of this gold. Let’s do it as quickly as possible.â€
His comments came despite the U.K. being one of
Slovakia’s closest allies after the Soviet empire crumbled, helping ease
the path to European Union and NATO. Fico said Brexit and the risk of a global economic crisis put Slovak gold stored in Britain in a dangerous situation.
The gold Poland brought back also came from the U.K., though
there was no questioning of Britain’s reliability by central bank
Governor Adam Glapinski.
Adam GlapinskiPhotographer: Piotr Malecki/Bloomberg
Instead, he said he wanted to demonstrate the strength of his nation’s $586 billion
economy — the largest in the EU’s east. Poland has doubled its gold
holdings in the past two years and now has the region’s biggest
stockpile.
Hungary, though, has been an active buyer too. Gold reserves
surged 10-fold last year, setting the clamor for the metal in the
countries around it in motion.
Serbia’s strongman leader
Aleksandar Vucic took note, ordering the central bank to boost reserves
and prompting the purchase of nine tons in October. Vucic said last week
that more should be bought because “we see in which direction the
crisis in the world is moving.â€
The biggest nation to emerge from
the breakup of Yugoslavia still keeps some of its gold abroad, the
central bank said by email. The region is buying more of the metal
because of global uncertainty over trade and politics, Brexit and low
interest rates, it said.
Romania had also sought to relocate some
of its gold reserves from the U.K., but those plans were put on hold
when the government behind them was ousted in October.
For the
no-nonsense leaders that have come to dominate eastern Europe, the main
benefit may be the message to voters that hefty holdings of the precious
metal conveys.
“Gold is a symbol,†said Vuk Vukovic, a political
economist in Zagreb. “When states purchase it, people everywhere see it
as a sign of economic sovereignty.â€
Posted by AGORACOM
at 11:25 AM on Monday, December 2nd, 2019
SPONSOR: Advance Gold AAX.v – Advance Gold controls 100% interest in the Tabasquena Silver Mine in Zacatecas, Mexico. A cluster of 30 Epithermal veins have been discovered, with recent emphasis on exploring a large anomaly to drill. Advance also owns 13.5% of the Kakamega JV attached to Barrick Takeover Offer for Acacia Mining. Click Here For More Info
Just 215.5 million ounces has been discovered in 41 discoveries over the past decade, compared with 1.72 billion ounces in 222 discoveries in the preceding 18-year period.
S&P Global Market Intelligence’s annual Gold Discoveries report found that gold exploration budgets peaked in 2012, but remain at historically high levels.
Explorers have allocated US$54.3 billion to gold exploration over the
past decade, 60% higher than the $32.2 billion spent over the preceding
18 years.
Despite the effort, just 215.5 million ounces has been discovered in
41 discoveries over the past decade, compared with 1.72 billion ounces
in 222 discoveries in the preceding 18-year period.
Over half of that amount is contained in just 10 discoveries, with
Zhaojin Mining Industry Co’s 16.4Moz Haiyu deposit in China the largest.
Other deposits in the top 10 including Barrick Gold’s Goldrush, White
Rivers Exploration/Harmony Gold’s JV, SolGold’s Cascabel and Cardinal
Gold’s Namdini.
S&P says that even after adjusting for more recently identified
deposits that might eventually surpass its threshold for a major
discovery, and for major discoveries with potential to expand, it
forecasts that the gold in major discoveries might only increase to
about 363Moz over the next decade.
S&P Metals & Mining senior research analyst Kevin Murphy said
previous research into gold lead times showed that it took about 20
years for an asset to advance from early exploration to production.
“This timeline implies that the reduced discovery rates of the last
decade will limit the pool of projects that could come online in 15 to
20 years,” he said.
“Unless discovery rates begin an upswing in the near future, there
could be a lack of quality assets available for development in the
longer term.
“The declining discovery rate shows the importance of continuing
exploration and funding companies responsible for exploration to
maintain a healthy future pipeline of assets available for development.”
Majors Barrick and Newcrest Mining reported declines in reserves this year.
Barrick’s reserves dropped to 64.4Moz from 86Moz, mainly due to
divestments and reclassification, while Newcrest’s dropped by 3Moz to
62Moz.
Newmont Mining’s remained unchanged at 68.5Moz, though the average grade fell by 5%.
Newmont has increased its 2018 exploration budget to US$350-400
million from $200 million last year, Barrick is boosting its spend to
$185-225 million from $149 million, and Newcrest is spending $70-90
million in FY18, up from $58 million.
Posted by AGORACOM
at 2:33 PM on Wednesday, November 27th, 2019
Kamloops,
British Columbia–(Newsfile Corp. – November 27, 2019) – Advance Gold
Corp. (TSXV: AAX) (“Advance Gold” or “the Company”) is pleased to
announce drilling has started to test the large chargeability anomaly
identified in recent 3D Induced Polarization (IP) geophysical surveys on
its Tabasquena project in Zacatecas, Mexico. Two phases of IP surveys
identified a 1000 metres by 500 metres continuous chargeability anomaly.
The anomaly remains open to the north and to the south and at depth.
Allan Barry Laboucan, President and CEO of Advance Gold Corp. commented: “We
are very excited to drill this large chargeability anomaly as these
kinds of targets are not easily found, especially in regions well known
for big mines. What makes it particularly stand out is that the high
chargeability is consistent from east to west on each survey line, and
from line to line over the entire grid. One always has to be aware of
possible false positives, such as the possibility of disseminated
magnetite causing the chargeability anomaly. However, in this case there
has been no magnetite found in the area and an historical magnetic
geophysical survey by the Geological Survey of Mexico showed no magnetic
anomaly. There are a few potential explanations for the anomaly of this
size from mines in Zacatecas. At the Real de Angeles mine and the mine
at Fresnillo there were large stockwork vein systems. Previous drilling
at Tabasquena has found a near surface network of epithermal veins with
widespread gold and silver mineralization, although the IP survey did
not pick up that network of drilled veins. Another possibility is a
porphyry intrusion that are known to be below epithermal vein systems.
Finally, volcanogenic massive sulphide deposits (VMS) are known to occur
in clusters, so far, there is only one found in the area, Teck’s San
Nicolas VMS deposit. The San Nicolas discovery was found with the first
drill hole into a large IP chargeability anomaly. For a small company
like Advance Gold to have such a significant anomaly, in a prolific
region for mines is exceptional, now we are drilling to better
understand what we have at the Tabasquena project.”
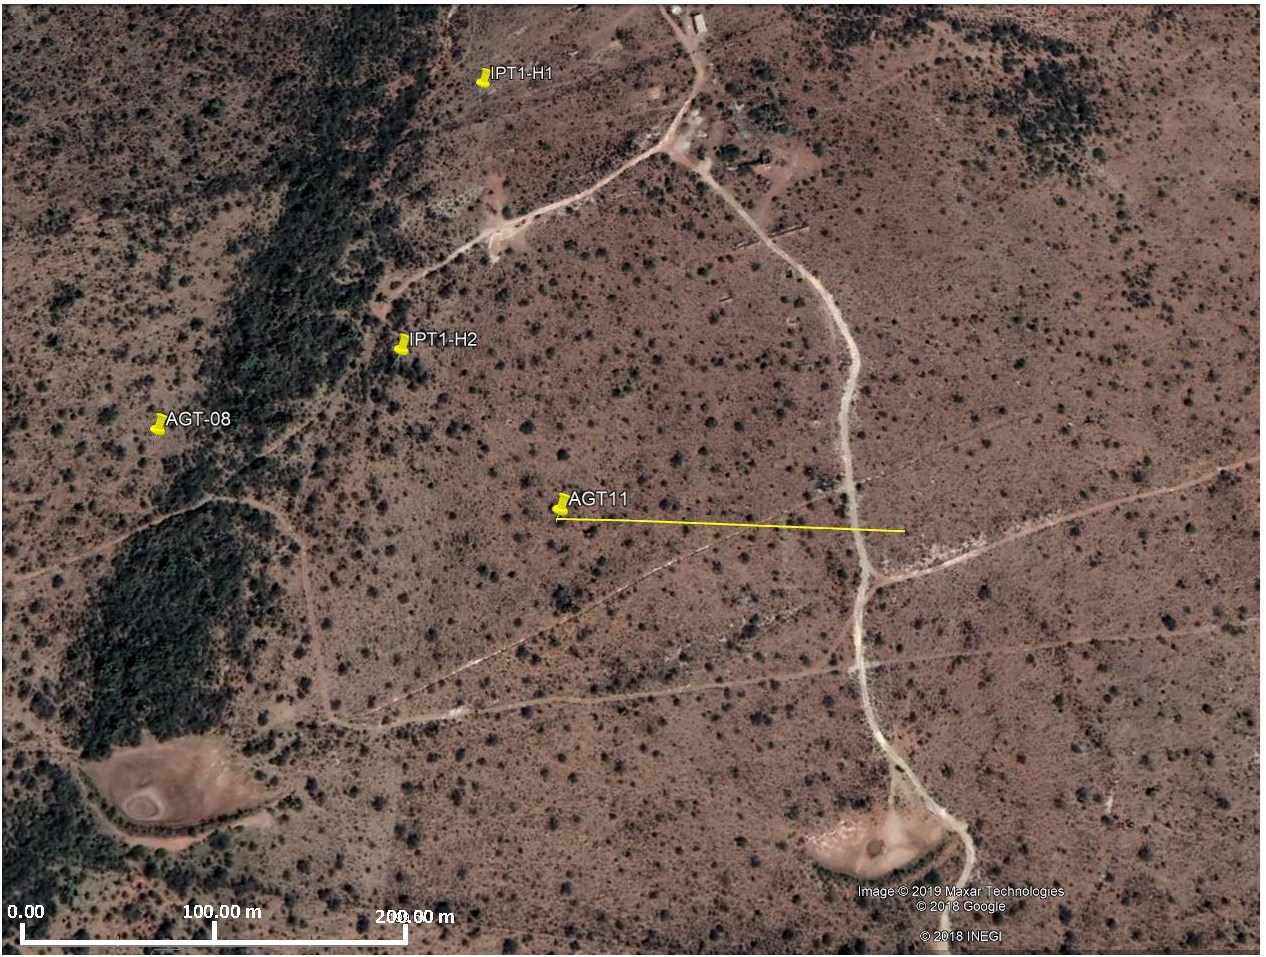
The
first drill hole to test the chargeability anomaly will be
approximately in the middle of the anomaly. It will be drilled at a 65
degree angle, from west to east. The first image below shows the collar
location and direction of the hole. In the north part of the image, you
can see the Tabasquena shaft area, where historical mining was done in
the oxide zone of the Tabasquena vein, and just off the image to the
south is the Tesorito shaft also used historically to mine the
Tabasquena vein in the oxides.
The
image below is a plan view, with past drill holes outside the purple
area which is the projected chargeability anomaly to surface. Those
drill holes intersected a series of veins, with widespread gold and
silver mineralization. None of the holes reached the chargeability
anomaly.
The
final image below, is a cross section of the new drill hole, which has
been designed to cover approximately 100 metres from west to east, plus
go down to 500 metres and hit the middle of the chargeability anomaly.
The anomaly remains open at depth beyond the planned 500 metres and a
decision will be made during drilling to extend it.
Julio
Pinto Linares is a QP, Doctor in Geological Sciences with specialty in
Economic Geology and Qualified Professional No. 01365 by MMSA., and QP
for Advance Gold and is the qualified person as defined by National
Instrument 43-101 and he has read and approved the accuracy of technical
information contained in this news release.
About Advance Gold Corp. (TSXV: AAX)
Advance
Gold is a TSX-V listed junior exploration company focused on acquiring
and exploring mineral properties containing precious metals. The Company
acquired a 100% interest in the Tabasquena Silver Mine in Zacatecas,
Mexico in 2017, and the Venaditas project, also in Zacatecas state, in
April, 2018.
The
Tabasquena project is located near the Milagros silver mine near the
city of Ojocaliente, Mexico. Benefits at Tabasquena include road access
to the claims, power to the claims, a 100-metre underground shaft and
underground workings, plus it is a fully permitted mine.
Venaditas
is well located adjacent to Teck’s San Nicolas mine, a VMS deposit, and
it is approximately 11km to the east of the Tabasquena project, along a
paved road.
In
addition, Advance Gold holds a 13.23% interest on strategic claims in
the Liranda Corridor in Kenya, East Africa. The remaining 86.77% of the
Kakamega project is held by Barrick Gold Corporation.
For further information, please contact:
Allan Barry Laboucan, President and CEO Phone: (604) 505-4753 Email: [email protected]Reply
Posted by AGORACOM
at 3:21 PM on Tuesday, November 26th, 2019
SPONSOR: Advance Gold AAX.v – Advance Gold controls 100% interest in the Tabasquena Silver Mine in Zacatecas, Mexico. A cluster of 30 Epithermal veins have been discovered, with recent emphasis on exploring a large anomaly to drill. Advance also owns 13.5% of the Kakamega JV attached to Barrick Takeover Offer for Acacia Mining. Click Here For More Info
Gold mining stocks have soared approximately 30% so far in 2019, based on the performance of the NYSE Arca Gold Miners Index (GDM) as of November 15.1 Over the last 12 months, the sector is up nearly 50%. Some investors may assume that gold stocks have run their course. On the contrary, we think that the gold mining equities still have a great deal of upside to offer.
In brief, we think we’re in the early stages of a prolonged bull market for gold. While the relationship between the prices for gold bullion and gold stocks isn’t a linear one, rising demand for the yellow metal commodity has historically driven stock performance. Moreover, despite the recent rally, gold mining stocks have yet to recover from the beating they suffered starting in 2011. Still, recent outperformance — coupled with improving fundamentals — creates momentum, a key factor in many quantitative strategies.
Gold has been a store of value since the beginning of civilization, and yet the nuances of investing in gold — be it the metal or miners — is still a source of confusion. As we see it, that also means opportunity.
Here are five reasons to consider investing in gold equities now.
REASON #1. Rising Gold Prices Drive Demand
Figure 1. Gold Bull Market is Just Getting Started
Source: Bloomberg as of 11/15/19. Gold was $1,514 on 11/1/19, and $1,468 as of 11/15/19.
Gold recently broke past $1,500 an ounce for the first time since 2013 (Figure 1), as global political and macroeconomic trends are driving demand for the yellow metal. Along with other strategists, we think gold bullion could surpass its all-time high of $1,900 within the next couple of years. Key factors driving long-term demand for gold as a store of value and defensive asset, especially among central banks and institutions, include low-to-negative interest rates, rising debt levels, trade tensions and intensifying geopolitical risk.
Price movements for physical gold and gold-mining stocks aren’t perfectly in sync, but the relationship between them is strong and persistent, across economic cycles.
Historically, rising (and falling) gold prices have a three-times multiplier effect on gold stocks: If the value of gold bullion increases by 10%, mining stocks tend to increase by 30%, and vice versa. The reason: Miners have significant fixed operating costs and high operating leverage, meaning big swings in physical gold prices have a larger impact on miners’ profitability.
This relationship cuts both ways, as we saw after physical gold prices peaked in late 2011. As the value of gold subsequently declined (Figure 2), the value of gold stocks plummeted even more. Between 2011 and 2018, the sector posted negative returns in six out of eight calendar years. Even with recent gains, gold mining stocks have yet to recover relative to historical valuations. Since the sector peak in April 2011, gold mining equities are still off by more than 60%.
Figure 2. Gold Mining Equities are Very Undervalued
Source: Bloomberg as of 11/12/19.
Figure 3. Gold Demand Has Rebounded: Purchases by Central Banks
Central banks have been net buyers of gold over the past 10 years. Gold plays an important part in central banks’ reserves management, and they are significant holders of gold. According to the World Gold Council: “Today, central banks own almost 34,000 tonnes (t) of gold, making it the third-largest reserve asset in the world. The increase in central bank demand for gold reflects current geopolitical, political and economic conditions, as well as structural changes in the global economy. Gold is both a liquid, counter-cyclical asset and a long-term store of value. As such, it can help central banks meet their core objectives of safety, liquidity and return.â€
Source: Metals Focus, Refinitiv GFMS, World Gold Council. As of June 30, 2019.
REASON #2. Gold Stocks are Severely Undervalued
Given the amplified volatility of gold stocks relative to gold, investors need to go in with their eyes wide open. Nevertheless, multi-year declines may now set the stage for significant upside.
While miners as a group still trade below their net asset values, the discounts of smaller, “junior†miners are especially extreme, as much of the recent rally has been driven by the largest, “senior†gold miners. In fact, the valuation gap between North American junior and senior gold miners is the widest it’s ever been.
Figure 4. The Valuation Gap Between Senior and Juniors is at Historic Extremes
Source: BMO Capital Markets, FactSet. North American senior vs. junior gold miners. As of 7/19/19.
Reason #3. Supplies are Limited
Most investors grasp the importance of investing in companies whose business models are protected by “competitive moats.†Gold miners have this in spades, as it can take 15 years from discovery of a new gold mine to successful ore production. The barriers to entry are enormous for newcomers in this sector, given the need for expensive and specialized equipment, environmental regulations and political considerations.
Meanwhile, the supply of gold is finite and there have been increasingly fewer gold discoveries in recent years. This dynamic — combined with depressed valuations of junior gold miners — is driving consolidation in the industry. It is far cheaper for senior miners to buy new gold production than to “build†capacity themselves. In fact, based on an analysis of recent transactions, there is a 35% discount for buying ounces in the market via acquisitions versus discovering new ounces (according to Scotiabank).
Figure 5. Major Gold Discoveries have Declined Significantly
Investors love momentum — following positive trends in prices, earnings and other factors — and the rise of quantitative strategies has made this market phenomenon even more pervasive. For the last eight years, momentum has largely worked against the gold mining sector, but now there are signs the wind is shifting, and that momentum could soon work in its favor.
Analysts covering the sector have understandably been conservative in their estimates and may soon be playing catch up, given higher gold prices and a leveling off of mining costs. Any improvements in earnings outlooks could potentially accelerate positive momentum for the sector. As my colleague Paul Wong wrote earlier this month in The Sweet Spot for Gold Equities: â€At this stage in the gold cycle, we are in the sweet spot for gold mining company earnings. A starting low gold price base will result in earnings changes with a high percentage increase when measured quarter-over-quarter or year-over-year.â€
In Figure 6, we highlight the progression of 2020E EPS (estimates of earnings-per-share) revisions for the top-10 gold mining companies in SGDM2 versus the average 2020E EPS for the top-20 companies in the S&P 500 Index.3 Since January 2019, the average 2020E EPS for the top-10 gold mining companies had increased from $0.65 to $0.98 by the end of October, representing a 50% jump, compared to a decline of 9% for the S&P 500. After the Q3 reporting season, we would expect that 2020E EPS for gold miners will be revised even higher.
Figure 6. Sweet Spot for Gold Mining Company Earnings
Source: Bloomberg as of 10/31/19.
REASON #5. Gold Stocks Play a Different Role than Bullion
As with any investment, it’s important to think about the role of gold stocks in the context of a broader portfolio. One common misconception is that gold stocks and physical gold are two sides of the same coin. While their fates are certainly correlated, as asset classes they could not be more different.
Physical gold, whether it’s in the form of coin, bar or a trust (for example, Sprott Physical Gold Trust, NYSE Arca: PHYS), should be viewed as a stable store of value. It’s counter-cyclical and has proven over millennia to be an effective hedge against market turbulence and volatility.
As such, we recommend that investors allocate between 5% to 10% of their assets to physical gold and precious metals.
Gold stocks, conversely, should be viewed in the context of an investor’s overall equity portfolio; the size of the allocation will depend on many factors, including risk tolerance. Strategists advocate owning gold stocks continuously, in part because they have low correlations to the broader market. However, most investors view gold stocks as tactical investments. When valuations are severely depressed, as they are now, gold stocks may have the potential to outperform.
At Sprott, we believe that it may be time to consider investing in gold stocks, in addition to physical gold.
Posted by AGORACOM
at 1:42 PM on Monday, November 25th, 2019
Sponsor: Loncor is a Canadian gold exploration company focused on two projects in the DRC – the Ngayu and North Kivu projects. Both projects have historic gold production. Exploration at the Ngayu project is currently being undertaken by Loncor’s joint venture partner Barrick Gold. The Ngayu project is 200km southwest of the Kibali gold mine, operated by Barrick, which produced 800,000 ounces of gold in 2018. Barrick manages and funds exploration at the Ngayu project until the completion of a pre-feasibility study on any gold discovery meeting the investment criteria of Barrick. Click Here for More Info
Rising US liabilities for entitlements could undermine the dollar
The Dutch Central Bank recently
argued in an article that if there were to be a major monetary reset,
“gold stock can serve as a basis†to rebuild the global monetary system.
“Gold bolsters confidence in the stability of the central bank’s
balance sheet and creates a sense of security.â€
Talk of gold, however, does not. Investor Ray Dalio recently spooked attendees at the Institute for International Finance conference when he mentioned the possibility of a flight to gold because of his concerns about America’s fiscal position.
That is not a new point. Since at least 2016, financial titans including JPMorgan chief Jamie Dimon and hedge fund manager Stanley Druckenmiller have
pointed out that unfunded pension and healthcare entitlements are a
looming iceberg for the US economy. Indeed, one theory about the recent
crisis in the “repo†overnight lending market is that it was caused by the federal deficit and the increasing unwillingness of investors outside the US to fund it.
But
Mr Dalio went further, concluding that the American entitlement crisis
meant the US Federal Reserve would have to continue to inflate its own
balance sheet indefinitely, and keep rates low (or even negative) well
into the future so the US could keep paying its bills.
That
would depreciate the US dollar. Taken to its extreme, that never ends
well. Prior experiments with rapidly falling currencies include
late-third century Rome, Germany’s interwar Weimar Republic and Zimbabwe.
At some point, Mr Dalio argued, nobody would want to own US debt or the
dollar, and investors would look to other assets for safety. “The
question is, what else?†he asked. “That’s the environment I think that
we’ll be in. And there’s a saying that gold is the only asset you can
have that’s not somebody else’s liability.â€
I
haven’t bought any gold yet myself, though I did sell out of equities
entirely in August. That decision has been somewhat painful given the recent upsurge in
the S&P 500, and yet it is one that I do not regret. There is logic
in believing — as I do — that US blue-chips and bonds are no longer a
safe haven while also believing that prices could stay high for some
time to come. After all, holding two seemingly contradictory thoughts in
your head at once is the sign of a mature mind. I believe US stock
prices are staying up for precisely the same reason that investors might
need to be in gold someday.
Analyst
Luke Gromen laid out the mathematical logic of this very well in a
recent newsletter. He calculates that US annual entitlement payments,
which he defines as Medicare, Medicaid and Social Security, plus defence
spending plus interest on the federal debt adds up to 112 per cent of
US federal tax receipts.
That
total has risen from 103 per cent only 15 months ago and 95 per cent
two years ago, as government revenue fell due to President Donald
Trump’s tax cuts. The proceeds of those cuts helped to further inflate
equity prices. The US has become “utterly dependent on asset price
inflation for tax receiptsâ€, Mr Gromen writes, adding that the only way
the US will be able pay its yearly bills is for asset prices to climb on
their own, or for the Fed to “print enough money to make asset prices
riseâ€.
I
expect the Fed will, like every central bank before it, do what is
politically required. Neither the US nor the world can afford for
America to nominally default on its Treasury bills. So, stock prices
will rise — for now. The essence of economic policy is, as Joseph
Schumpeter reportedly put it, “politics, politics, politicsâ€.
Share
price inflation has been under way since the Fed switched gears and
began lowering rates in July. It will probably be helped along by the easing of financial regulations enacted
after the 2008 crisis, and possibly even a new round of tax cuts before
the 2020 elections. Mr Trump measures his own success by that of the
market.
But
in the longer run, this financially engineered growth must erode
confidence in the dollar, particularly at a time when the US and China
are going in different directions. China is now the world’s largest natural gas buyer,
and is looking to start setting prices for this and other commodities
in its own currency. China is also doing more business in euros, as it
tries to woo Europe into its own economic orbit. China recently issued
its first euro-denominated bonds in 15 years. It is also moving away from buying oil in dollars and strengthening ties with EU companies such as Airbus.
The
de-dollarisation of Eurasia would support Mr Dalio’s worldview. So
would a shift to a non-dollar reserve asset such as gold. Such a change
would force the US to sell dollars in order to settle its balance of
payments in the new, neutral reserve asset.
One could argue that even if the US dollar were to weaken and creditors to lose faith in America’s ability to repay its debt, markets might still remain high for a period of time. But we are undergoing a period of deglobalisation. And history shows that when that happens, it eventually tends to trigger asset price collapses in whatever country is associated with the “old orderâ€. No wonder gold bugs abound. Source: [email protected]
Posted by AGORACOM
at 10:56 AM on Monday, November 25th, 2019
Sponsor: Affinity Metals is a Canadian mineral exploration company building a strong portfolio of mineral projects in North America. The Corporation’s flagship property is the Drill ready Regal Property near Revelstoke, BC. Recent sampling encountered bonanza grade silver, zinc, and lead with many samples reaching assay over-limits. Further assaying of over-limits has been initiated, results will be reported once received. (TSX-V: AFF) Click Here for More Info
Gold mining stocks have soared approximately 30% so far in 2019, based on the performance of the NYSE Arca Gold Miners Index (GDM) as of November 15.1
Over the last 12 months, the sector is up nearly 50%. Some investors
may assume that gold stocks have run their course. On the contrary, we
think that the gold mining equities still have a great deal of upside to
offer.
In brief, we think we’re in the early stages of a prolonged bull
market for gold. While the relationship between the prices for gold
bullion and gold stocks isn’t a linear one, rising demand for the yellow
metal commodity has historically driven stock performance. Moreover,
despite the recent rally, gold mining stocks have yet to recover from
the beating they suffered starting in 2011. Still, recent outperformance
— coupled with improving fundamentals — creates momentum, a key factor
in many quantitative strategies.
Gold has been a store of value since the beginning of civilization,
and yet the nuances of investing in gold — be it the metal or miners — is still a source of confusion. As we see it, that also means opportunity.
Here are five reasons to consider investing in gold equities now.
REASON #1. Rising Gold Prices Drive Demand
Figure 1. Gold Bull Market is Just Getting Started
Source: Bloomberg as of 11/15/19. Gold was $1,514 on 11/1/19, and $1,468 as of 11/15/19.
Gold recently broke past $1,500 an ounce for the first time since
2013 (Figure 1), as global political and macroeconomic trends are
driving demand for the yellow metal. Along with other strategists, we
think gold bullion could surpass its all-time high of $1,900 within the
next couple of years. Key factors driving long-term demand for gold as a
store of value and defensive asset, especially among central banks and
institutions, include low-to-negative interest rates, rising debt
levels, trade tensions and intensifying geopolitical risk.
Price movements for physical gold and gold-mining stocks aren’t
perfectly in sync, but the relationship between them is strong and
persistent, across economic cycles.
Historically, rising (and falling) gold prices have a three-times
multiplier effect on gold stocks: If the value of gold bullion increases
by 10%, mining stocks tend to increase by 30%, and vice versa. The
reason: Miners have significant fixed operating costs and high operating
leverage, meaning big swings in physical gold prices have a larger
impact on miners’ profitability.
This relationship cuts both ways, as we saw after physical gold
prices peaked in late 2011. As the value of gold subsequently declined
(Figure 2), the value of gold stocks plummeted even more. Between 2011
and 2018, the sector posted negative returns in six out of eight
calendar years. Even with recent gains, gold mining stocks have yet to
recover relative to historical valuations. Since the sector peak in
April 2011, gold mining equities are still off by more than 60%.
Figure 2. Gold Mining Equities are Very Undervalued
Source: Bloomberg as of 11/12/19.
Figure 3. Gold Demand Has Rebounded: Purchases by Central Banks
Central banks have been net buyers of gold over the past 10 years. Gold plays an important part in central banks’ reserves management, and they are significant holders of gold. According to the World Gold Council:
“Today, central banks own almost 34,000 tonnes (t) of gold, making it
the third-largest reserve asset in the world. The increase in central
bank demand for gold reflects current geopolitical, political and
economic conditions, as well as structural changes in the global
economy. Gold is both a liquid, counter-cyclical asset and a long-term
store of value. As such, it can help central banks meet their core
objectives of safety, liquidity and return.”
Source: Metals Focus, Refinitiv GFMS, World Gold Council. As of June 30, 2019.
REASON #2. Gold Stocks are Severely Undervalued
Given the amplified volatility of gold stocks relative to gold,
investors need to go in with their eyes wide open. Nevertheless,
multi-year declines may now set the stage for significant upside.
While miners as a group still trade below their net asset values, the
discounts of smaller, “junior†miners are especially extreme, as much
of the recent rally has been driven by the largest, “senior†gold
miners. In fact, the valuation gap between North American junior and
senior gold miners is the widest it’s ever been.
Figure 4. The Valuation Gap Between Senior and Juniors is at Historic Extremes
Source: BMO Capital Markets, FactSet. North American senior vs. junior gold miners. As of 7/19/19.
Reason #3. Supplies are Limited
Most investors grasp the importance of investing in companies whose
business models are protected by “competitive moats.†Gold miners have
this in spades, as it can take 15 years from discovery of a new gold
mine to successful ore production. The barriers to entry are enormous
for newcomers in this sector, given the need for expensive and
specialized equipment, environmental regulations and political
considerations.
Meanwhile, the supply of gold is finite and there have been
increasingly fewer gold discoveries in recent years. This dynamic —
combined with depressed valuations of junior gold miners — is driving
consolidation in the industry. It is far cheaper for senior miners to
buy new gold production than to “build†capacity themselves. In fact,
based on an analysis of recent transactions, there is a 35% discount for
buying ounces in the market via acquisitions versus discovering new
ounces (according to Scotiabank).
Figure 5. Major Gold Discoveries have Declined Significantly
Investors love momentum — following positive trends in prices,
earnings and other factors — and the rise of quantitative strategies has
made this market phenomenon even more pervasive. For the last eight
years, momentum has largely worked against the gold mining sector, but
now there are signs the wind is shifting, and that momentum could soon
work in its favor.
Analysts covering the sector have understandably been conservative in
their estimates and may soon be playing catch up, given higher gold
prices and a leveling off of mining costs. Any improvements in earnings
outlooks could potentially accelerate positive momentum for the sector.
As my colleague Paul Wong wrote earlier this month in The Sweet Spot for Gold Equities:
â€At this stage in the gold cycle, we are in the sweet spot for gold
mining company earnings. A starting low gold price base will result in
earnings changes with a high percentage increase when measured
quarter-over-quarter or year-over-year.â€
In Figure 6, we highlight the progression of 2020E EPS (estimates of
earnings-per-share) revisions for the top-10 gold mining companies in
SGDM2 versus the average 2020E EPS for the top-20 companies in the S&P 500 Index.3
Since January 2019, the average 2020E EPS for the top-10 gold mining
companies had increased from $0.65 to $0.98 by the end of October,
representing a 50% jump, compared to a decline of 9% for the S&P
500. After the Q3 reporting season, we would expect that 2020E EPS for
gold miners will be revised even higher.
Figure 6. Sweet Spot for Gold Mining Company Earnings
Source: Bloomberg as of 10/31/19.
REASON #5. Gold Stocks Play a Different Role than Bullion
As with any investment, it’s important to think about the role of
gold stocks in the context of a broader portfolio. One common
misconception is that gold stocks and physical gold are two sides of the
same coin. While their fates are certainly correlated, as asset classes
they could not be more different.
Physical gold, whether it’s in the form of coin, bar or a trust (for example, Sprott Physical Gold Trust,
NYSE Arca: PHYS), should be viewed as a stable store of value. It’s
counter-cyclical and has proven over millennia to be an effective hedge
against market turbulence and volatility.
As such, we recommend that investors allocate between 5% to 10% of their assets to physical gold and precious metals.
Gold stocks, conversely, should be viewed in the context of an
investor’s overall equity portfolio; the size of the allocation will
depend on many factors, including risk tolerance. Strategists advocate
owning gold stocks continuously, in part because they have low
correlations to the broader market. However, most investors view gold
stocks as tactical investments. When valuations are severely depressed,
as they are now, gold stocks may have the potential to outperform.
At Sprott, we believe that it may be time to consider investing in gold stocks, in addition to physical gold.
Posted by AGORACOM-JC
at 9:18 AM on Thursday, November 21st, 2019
There is a lot we could say about American Creek’s Treaty Creek Project … But we’ll let the words of 4 much smarter and wealthier people do all the talking:
Walter Storm, CEO Tudor Gold (JV Partner; Funded Startup Of Osisko Mining Until Sold For $4.5 Billion)
“The Goldstorm (System On Treaty Creek) now has the attention of several major industry players and we expect that future results will continue to impress as we further define this potential world-class deposit“.”
Eric Sprott, Billionaire Investor and 2X PP Investor In American Creek Resources
“What we’re shooting for is to define a 10 or 20-million-ounce discovery“
Ken Konkin , Tudor Gold Exploration Manager (Credited With Discovering Brucejack Mine Just South Of Treaty Creek)
“The
Goldstorm System shows no signs of weakening to the northeast and
several more drill holes will be needed to find the length and depth of
this huge gold system.“ “2020 is going to be a breakout year.” Darren Blaney, President & CEO American Creek Resources
“Ken Konkin, the geologist credited for the discovery and development of Pretium’s neighbouring Brucejack Mine is advancing the Goldstorm zone to potentially becoming a world-class deposit with far better logistics than the neighbouring KSM deposits.”
“Clearly, we have a massive, world-class gold system that still shows no signs of weakening to the northeast nor at depth.”
To find out why world renowned gold mine finders are so bullish on Treaty Creek, grab your favourite beverage, grab a seat and watch this interview with American Creek Resources.