Agoracom Blog Home

Posts Tagged ‘gold’

American Creek $AMK.ca Treaty Creek Moves Closer to Eric Sprott’s Prediction of 10 to 20 Million Ounce $TUD.ca $SII.ca $GTT.ca $AFF.ca $SEA.ca $SA $PVG.ca

Posted by AGORACOM at 11:47 AM on Thursday, November 14th, 2019
  • 23 holes drilled in the last two years have intersected significant mineralization and dramatically increased the size of the Goldstorm deposit at Treaty Creek
  • Eric Sprott re-emphasized the potential of the project in a podcast where he stated that he is “hoping they can prove up a 20-million-ounce deposit”
https://www.sprottmoney.com/Blog/after-three-weeks-going-sideways-gold-and-silver-just-woke-up-weekly-wrap-up-october-25-2019.html

11:30 –“I still believe there’s going to be huge deposit proven up there. If we get the right environment in precious metals, which it looks like we might be getting here, people are going to start looking at these things again, and it could be very, very exciting, so…and I am, kind of, hoping that they can ultimately pull up, like, a 20 million ounce deposit there. So these stocks would prove to be very, very inexpensive”

SUMMARIZING THE 2019 PROGRAM

The Company’s JV partner, Tudor Gold’s 2019 exploration program at the Goldstorm Zone on Treaty Creek totalled 9,781.8 meters with 14 diamond drill holes. This year’s drilling program generated the best near-surface results attained to date on the project. Specifically, in addition to several hundred meters extension along strike to the northeast, the 2019 program significantly expanded the mineralized limits to the southeast, where one of the best near-surface intervals averaged 2 g/t Au over 87m, within 336 m averaging 1 g/t Au in hole GS19-52.

RESULTS OF THE FINAL 5 DRILL HOLES

  • Hole GS19-49 was drilled to 960.1 m, at -80° dip, on Section 111+00 NE next to the previously announced vertical hole GS19-48, which yielded 0.725 g/t Au over 838.5m, including an upper horizon that averaged 1.048 g/t gold Au over 328.5 m. Hole GS19-49 returned equally impressive results with a comparable 0.7 g/t Au over 826.5 m and the upper horizon averaging 1 g/t Au over 249 m 
  • Along the same section, hole GS19-52 (-50° dip at 115° azimuth) was drilled much longer than expected because the Goldstorm System continues at least 700 m to the southeast ; GS19-52 averaged 1 g/t gold over 336 meters with a higher grade core of 2 g/t gold over 87 meters within the upper horizon.

Tudor Gold Exploration Manager, Ken Konkin explained: “Clearly the results of the previously reported deep vertical step-out holes demonstrate the impressive size and grade consistency of the Goldstorm system. Within the overall mineralized package of fragmental intermediate volcanic rocks there are several sub-horizontal horizons of significantly higher gold grades. The uppermost portions of the previously reported holes GS19-42, GS19-47 and GS19-48 contained respectively, 1.268 g/t gold over 252 m, 0.828 g/t gold over 301.5 m and 1.048 g/t gold over 328.5 m. We now have several other drill holes with excellent near-surface gold values to add to this list of growing intercepts. GS19-52 has returned the highest core gold grades of 2.006 g/t Au over 87 m within a 336m intercept of 1.004 g/t Au.

These intercepts are part of the uppermost portion of the Goldstorm system which we refer to as the ‘300 Horizon’. The ‘300 Horizon’ remains open along strike to the northeast as well as to the southeast. In addition, the lower horizons of the Goldstorm system also remain open in all directions and the lowest horizon is open at depth.”

Furthermore, Mr. Konkin added: “We are seeing consistent silver and copper mineralization associated with the deeper gold horizons such as the previously reported 151.5 m zone of 0.572 g/t gold, 8.5 g/t silver and 0.21% copper that was intercepted from 665.0 to 816.5 m in GS19-47 and a 66.0 m zone with 0.958 g/t gold, 3.9 g/t silver and 0.35% copper, whichwas intercepted from 874.5 to 940.5 m in GS19-48. Similarly, we have now seen in GS19-49, a 78 m intercept averaging 1.145 g/t gold, 11.2 g/t silver and 0.21% copper (750-828 m) and in GS19-52 an 88.5 m interval averaging 0.352 g/t gold, 9.3 g/t silver and 0.25% copper (515-603.5 m). Not only does the Goldstorm Zone remain open at depth and along strike, we are now seeing base-metal associations possibly as part of a zonation within the hydrothermal system.”

The final three footwall extension holes (GS19-50, GS19-51 and GS19-53) were completed on section 110+00 NE. These were successful in extending the width of the mineralized zone to the southeast:

  • Hole GS19-50 returned an average of 0.602 g/t Au over 577.5 m including 0.811 g/t Au over 267.0 m in the ‘300 Horizon‘
  • Hole GS19-51 returned an average of 0.721 g/t Au over 246 m in the ‘300 Horizon’ and a lower horizon that averages 1.017 g/t Au over 40.5 m.
  • Hole GS19-53 returned an average of 0.984 g/t Au over 147.0 m in the ‘300 Horizon’
Cannot view this image? Visit: https://orders.newsfilecorp.com/files/682/49176_99c64899f4a48b79_001.jpg

About American Creek

American Creek is a Canadian junior mineral exploration company with a strong portfolio of gold and silver properties in British Columbia.

Three of those properties are located in the prolific “Golden Triangle”; the Treaty Creek and Electrum joint venture projects with Tudor Gold/Walter Storm as well as the 100% owned past producing Dunwell Mine.

The Treaty Creek Project is a Joint Venture with Tudor Gold owning 60% and acting as operator. American Creek and Teuton Resources each have 20% interests in the project. American Creek and Teuton are both fully carried until such time as a Production Notice is issued, at which time they are required to contribute their respective 20% share of development costs. Until such time, Tudor is required to fund all exploration and development costs while both American Creek and Teuton have “free rides”.

More information about the Treaty Creek Project can be found here: https://americancreek.com/index.php/projects/treaty-creek/home

A drill program is also ongoing on American Creek’s 100% owned Dunwell Mine property located near Stewart. More information can be found here: https://americancreek.com/index.php/projects/dunwell-mine

The Corporation also holds the Gold Hill, Austruck-Bonanza, Ample Goldmax, Silver Side, and Glitter King properties located in other prospective areas of the province.

For further information please contact Kelvin Burton at: Phone: 403 752-4040 or Email: [email protected]. Information relating to the Corporation is available on its website at www.americancreek.com.

Hub on Agoracom
  FULL DISCLOSURE: American Creek is an advertising client of AGORA Internet Relations Corp.

Loncor $LN.ca – Technical Studies Indicate Possible Bottom and Support for Gold $ABX.ca $TECK.ca $RSG $NGT.to

Posted by AGORACOM at 1:54 PM on Wednesday, November 13th, 2019
This image has an empty alt attribute; its file name is Loncor-Small-Square.png

Sponsor: Loncor is a Canadian gold exploration company focused on two projects in the DRC – the Ngayu and North Kivu projects. Both projects have historic gold production. Exploration at the Ngayu project is currently being undertaken by Loncor’s joint venture partner Barrick Gold. The Ngayu project is 200km southwest of the Kibali gold mine, operated by Barrick, and produced 800,000 ounces of gold in 2018. Barrick manages and funds exploration at the Ngayu project until the completion of a pre-feasibility study on any gold discovery meeting the investment criteria of Barrick. Click Here for More Info

While it is an accepted fact that fundamental events shape the financial markets, many analysts use technical indicators as a way to mathematically quantify market sentiment. One of the simplest and most widely used technical indicators used to determine a current trend for a stock or commodity are moving averages. 

The use of a simple 200-day moving average is used to determine on a long-term basis whether a financial market is currently in a bullish or bearish trend. The use of a 50-day moving average is commonly accepted as determining the short-term trend. In both cases if current pricing is above the moving average than the trend is bullish.

Another widely accepted technical study is based upon the mathematician Leonardo Fibonacci’s golden ratio is Fibonacci retracement theory.

According to Investopedia, “A Fibonacci retracement is a term used in technical analysis that refers to areas of support or resistance. Fibonacci retracement levels use horizontal lines to indicate where possible support and resistance levels are. Each level is associated with a percentage. The percentage is how much of a prior move the price has retraced. The Fibonacci retracement levels are 23.6%, 38.2%, 61.8% and 78.6%. While not officially a Fibonacci ratio, 50% is also used.”

In this article we will use two Fibonacci retracement studies. The first study will be a long-term study; however, this study will utilize much less data then chart number two. The study will begin at the end of 2015 when gold hit a bottom of $1045 per ounce, and concludes at this year’s current high of $1565 per ounce. The second study will be derived from another long-term Fibonacci retracement study which begins in 2008, and concludes in the middle of 2011 when gold reached its record high price against the U.S. dollar.

Of particular interest in the first study are the Fibonacci retracement areas found at the .23%, and .382% retracement levels. Currently gold futures are trading at $1457.40, which is a net decline of $5.50 on the day. This continues the current bearish trend which has been predominant since gold hit its highest value this year in August. When you look at the .38% retracement level on this chart you can see that it precisely defines a level of resistance at approximately $1370.

This was the defined and unbreakable resistance level which began in 2016, the first occurrence of hitting this price point and then trading lower. This resistance was unbreakable throughout 2017 and 2018. In fact, it was not until June of this year that gold was able to breach that price point and trade to its highest value since bottoming out at the end of 2015.

The other level of particular interest is the .23% Fibonacci retracement level which occurs at $1446 per ounce. Currently gold pricing is approximately $11 above that price point. While this study alone will not confirm a potential bottom or support at $1446, it can when combined with other technical indicators, be highly effective in providing price targets for support and resistance.

The second study uses an extremely large data set from 2008 to the middle of 2011 defining the rally which took gold to its all-time record high. Of particular interest is the .38% Fibonacci retracement level which occurs at $1451 per ounce. This defines the lowest price point gold has traded to this month. It also occurs within dollars of the .23% Fibonacci retracement level we looked at on chart 1. When you have two different time sequences which have key Fibonacci retracement levels occur at the same price point, we label this a Fibonacci harmonic.

While one should never use these technical indicators alone, they are excellent tools to define price points to look at when a market is in a corrective stage, which is the current scenario in gold pricing

https://www.kitco.com/commentaries/2019-11-11/Technical-Studies-Indicate-Possible-Bottom-and-Support-for-Gold.html

Loncor $LN.ca – Loncor Announces Additional Drill Targets Identified by Barrick on Loncor’s Ngayu Joint Venture Project $ABX.ca $TECK.ca $RSG $NGT.to

Posted by AGORACOM at 9:20 AM on Thursday, November 7th, 2019

Loncor Resources Inc. (“Loncor” or the “Company”) (TSX: “LN”; OTCQB: “LONCF”), a Canadian gold exploration company with significant projects in the Democratic Republic of the Congo (“DRC”), is pleased to provide an update on exploration activities undertaken by Barrick Gold Corporation (NYSE: “GOLD”; TSX: “ABX”) (through its subsidiary, Barrick Gold (Congo) SARL) (“Barrick”) on Loncor’s Ngayu Joint Venture Project in northeastern DRC.  Recent exploration has focussed on the major Imva fold structure where a number of drill targets have been developed.  Drilling is now expected to commence during the coming dry season.  

The opening of the Mambati airstrip in September is expected to assist in expediting the forthcoming drilling program.  The Ngayu Archaean Greenstone Belt is 200 kilometres southwest of Barrick/AngloGoldAshanti’s Kibali Gold Mine.  Barrick’s exploration at Ngayu during the most recent quarter has focused on four priority areas all located along the 30 kilometre-long Imva fold structure (see Figure 1 below).  These blocks are Bavadili/Bavanidi, Bakpau, Lybie (Matete east)/Salisa and Bikira-Makasi.

At Bavadili, further trenching was undertaken to test the concept of a mineralized northwest trending shear corridor parallel to the interpreted F2 axial plane.  Results were encouraging and included 24 metres @ 0.94 g/t Au and confirmed the mineralized corridor with mineralization associated with brecciated cherty “BIF” (Banded Ironstone Formation) with disseminated limonite, weak hematite alteration along with sugary quartz veins and fine cubic boxworks (~ 5% pyrite).  The mineralization occurs along a strongly foliated northwest-southeast structure between dolerite to the south and basalt to the north.  Results support and confirm the model of a +1.5 kilometre potential mineralized structure from Bavadili Hill to Bavanidi.  At Bavadili Hill, additional trenching undertaken to test the continuity of the folded, mineralized cherty BIF, 250 metres southwest from the mineralized cherty BIF intersected in trench BVTR0114A, gave results of 24 metres @ 0.94 g/t Au.

Additional work involved a geological re-assessment of the Bavadili Block, integrating all data including gold and multi-element soil geochemical and geophysical data to improve the understanding of the regional model.  The new interpretation highlights more than 6 kilometres of multiple folded layers of anomalous BIF displaying two sets of regional F1 and F2 folds with the P1 axial plane, trending northeast, reactivated by P2, trending east-northeast, producing the S-shape fold configuration which is interpreted to host the mineralised shoots within the Bavadili Block.  The interpretation further suggests the same BIF continues 12 kilometres to the east of the Lybie/Salisa targets.

At Lybie, encouraging results from trench NZTR0006 confirmed a continuous mineralized corridor of +1 kilometre hosted within volcanoclastic and brecciated cherty BIF within an interpreted fold limb.  The trench revealed at least two continuous mineralized structures – the northwestern most of the two structures is from colonial trenching which returned 20 metres @ 0.58g/t Au, whereas trench NZTR0006 returned 20 metres @ 0.54g/t Au.  

At Salisa, results from rock sampling assayed up to 3.75 g/t Au in volcaniclastic and 3.05 g/t Au hosted in BIF and coincide with the soil source line trending northeast-southwest.  To better trace the mineralized system and constrain the potential and the source of the higher grade rock samples, a scout trenching program is underway.

At Bakpau, trenching has been completed on northwest-southeast and north-south trending sections on widely spaced trench lines.  The two trenches, BKTR0005 and BKTR0006, respectively, at 500 metres northeast and southwest of trench BKTR0001 (70 metres @ 0.34g/t Au), returned 26 metres @ 0.35 g/t Au and 30 metres @ 0.12 g/t Au, respectively.  These trenches have exposed and confirmed the continuity of anomalous grade, near surface mineralization in the Bakpau East Zone over a strike length of 1.2 kilometres.

At Medere, trenching on the +800 metre long 80ppb soil anomaly along the northeast trending hill, focused on establishing the controls on mineralization (structure and alteration) and trends of mineralization along strike between the zones exposed in previous trenches and artisanal pits.  Significant gold results from the first trench across quartz stockwork style mineralization were received during the most recent quarter with a trench intersection of 48 metres @ 0.51g/t Au and is still open to the southeast.  The current trenching has only been able to expose the margin of the soil anomaly due to thick scree/talus cover on the hill slopes towards the southeast.

In addition to outlining drill targets along the Imva fold, drilling is also planned to be undertaken during the forthcoming drill campaign at the Anguluku prospect area (including Golgotha, Baberu and Bayinga) in the southwest side of the Ngayu greenstone where a sequence of fine grained metasediment, carbonaceous shale, metabasalt and BIF trend approximately east-west and dip moderately to south-southwest within an antiformal structure.  An initial 10 core hole (2,490 metres) drilling program is proposed to test 4,500 metres of potential strike.

A photo accompanying this announcement is available at https://www.globenewswire.com/NewsRoom/AttachmentNg/0534ef90-fef8-4230-b2b1-3ceb21b3f74c

About Loncor Resources Inc.
Loncor is a Canadian gold exploration company focused on two projects in the DRC – the Ngayu and North Kivu projects.  Both projects have historic gold production.  Exploration at the Ngayu project is currently being undertaken by Loncor’s joint venture partner Barrick Gold Corporation through its DRC subsidiary Barrick Gold (Congo) SARL (“Barrick”).  The Ngayu project is 200 kilometres southwest of the Kibali gold mine, which is operated by Barrick and in 2018 produced approximately 800,000 ounces of gold.  As per the joint venture agreement signed in January 2016, Barrick manages and funds exploration at the Ngayu project until the completion of a pre-feasibility study on any gold discovery meeting the investment criteria of Barrick.  Subject to the DRC’s free carried interest requirements, Barrick would earn 65% of any discovery with Loncor holding the balance of 35%.  Loncor will be required, from that point forward, to fund its pro-rata share in respect of the discovery in order to maintain its 35% interest or be diluted. 

Certain parcels of land within the Ngayu project surrounding and including the Makapela and Yindi prospects have been retained by Loncor and do not form part of the joint venture with Barrick.  Barrick has certain pre-emptive rights over these two areas.  Loncor’s Makapela prospect has an Indicated Mineral Resource of 614,200 ounces of gold (2.20 million tonnes grading 8.66 g/t Au) and an Inferred Mineral Resource of 549,600 ounces of gold (3.22 million tonnes grading 5.30 g/t Au).  Loncor also recently acquired a 71.25% interest in the KGL-Somituri gold project in the Ngayu gold belt which has an Inferred Mineral Resource of 1.675 million ounces of gold (20.78 million tonnes grading 2.5 g/t Au), with 71.25% of this resource being attributable to Loncor via its 71.25% interest. 

Resolute Mining Limited (ASX/LSE: “RSG”) owns 27% of the outstanding shares of Loncor and holds a pre-emptive right to maintain its pro rata equity ownership interest in Loncor following the completion by Loncor of any proposed equity offering.  Newmont Goldcorp Corporation (NYSE: “NEM”; TSX: “NGT”) owns 7.8% of Loncor’s outstanding shares.

Additional information with respect to Loncor and its projects can be found on Loncor’s website at www.loncor.com. 

Advance Gold’s $AAX.ca – Follow Up Geophysical Survey Identifies Large 1000 by 500 Metres Continuous Chargeability Anomaly $SIL.ca $FA.ca $ANG.jo $ABX.ca $NGT.ca $MGG.ca $TECK.ca

Posted by AGORACOM at 1:03 PM on Wednesday, November 6th, 2019

Kamloops, British Columbia–(Newsfile Corp. – November 6, 2019) – Advance Gold Corp. (TSXV: AAX) (“Advance Gold” or “the Company”) is pleased to announce that the recently completed second phase of 3D Induced Polarization (IP) geophysical survey on its Tabasquena project in Zacatecas, Mexico, has significantly increased the size of its continuous chargeability anomaly. This anomaly now has an east-west width of approximately 400 to 500 metres and an apparent strike length of over 1000 metres. The anomaly remains open to the north and to the south and at depth.

Images below are east-west cross sections representing key portions of the overall anomaly where upcoming drilling will test this continuous chargeability anomaly.


Line 7350N

To view an enhanced version of Line 7350N, please visit:
https://orders.newsfilecorp.com/files/5492/49483_ee273a13f4482b50_001full.jpg


Line 7150N

To view an enhanced version of Line 7150N, please visit:
https://orders.newsfilecorp.com/files/5492/49483_ee273a13f4482b50_002full.jpg

Allan Barry Laboucan, President and CEO of Advance Gold Corp. commented: “After our first phase of geophysics, we identified a large chargeability anomaly with the highest chargeability at the southern end of the grid and still wide open. In that southerly direction we have elevation relief and it was also where the anomaly appeared to be closest to surface. Prior to drilling this anomaly, we decided to carry out a second phase of geophysics to see if the anomaly continued to the south. The second phase of geophysics has revealed that the anomaly actually has a much longer strike length and appears to be somewhat wider. This chargeability anomaly is now at least 1000 metres from north to south and approximately 400 to 500 metres from east to west. It sits below a network of veins with widespread gold and silver mineralization that ranges from anomalous to high-grade gold. There are three shafts on the property that go down around 100 metres that were used in the historical mining of the oxide zone of the Tabasquena vein. The geophysical anomaly is primarily right below those shafts, starting at approximately 200 metres below the underground workings. It is fair to say that we have identified a major target. Our next step will be to drill this target, we expect to start this shortly and will put out a news release once it has started.”

Gennen McDowall, Geophysical Advisor to Advance Gold Corp. commented: “This southerly extension to the original IP grid has shown that the large chargeability anomaly first detected in August is actually much bigger than originally thought and appears to strike right across the claim group and shows little evidence of ending either to the north or to the south and its depth extent is as of yet unknown. The chargeability anomaly is visible on every east-west IP line. The observed near surface mineralisation may be an expression of a much larger mineralised body underlying the entire Tabasquena project.”

Details of Geophysical Survey

The first 3D Induced Polarization survey was carried out by GEOFISICA TMC SA de CV, between August 3rd and August 14th, 2019. Approximately 9.6 kms of IP data was collected over the central portion of the company’s claims. This was followed up by a second phase of geophysics consisting of 5 east-west lines. The southerly extent of the second survey reached just beyond the Tesorito shaft. An off-set pole dipole array was used.

Data processing and inversion of the data was carried out using RES3DINV software. The inversion model was extended to approximately 550 metres below surface. 3D Voxel images together with a series of depth slices were generated (all available on the company’s website).

The main purpose of the IP survey was to map, laterally and at depth the evolution of the known gold and silver veins and to identify any new mineralised structures. The survey was designed in such a way to allow approximately 500 to 550 metres of vertical depth investigation.

The IP survey area encompassed the historic and new shafts that are located to the east of the Tabasquena and Nina veins that define a mineralised system that outcrops at surface for 2.0 km. From past exploration work, the Tabasquena vein was recognized over approximately 70 m along strike near the shafts but only at shallow depth (< 100 m).

The fourteen (14) vertical sections that were extracted from the 3D IP inversion voxels suggest the presence of (4) four main stratigraphic horizons (lithological units) mainly characterized by their resistivity signatures.

The IP data also clearly shows that the large polarisable body/target is apparently quickly deepening northward and getting closer to surface southward. The IP anomaly starts at around 100 metres below the past drill hole intersections that contained widespread gold and silver mineralization in epithermal veins.
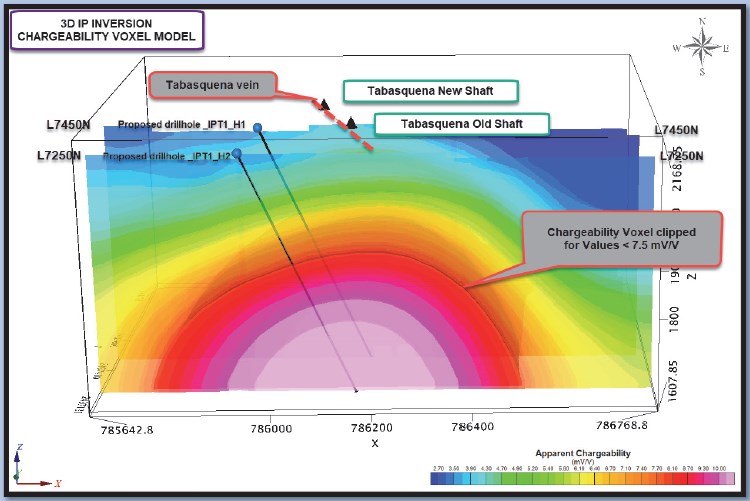
Chargeability and resistivity anomalies are indicated on the IP sections (see report on company’s website) and are graded as per their relative strength. Those chargeability anomalies that are deemed to be caused by the same anomalous target are grouped together in what is called a polarisable axis. Only one main axis was delineated following the review of the IP data, which was labelled IPT-1 (Map C351-3 & Figure 11, report on company website). This axis is a single large amplitude continuous chargeability anomaly running north-south, coincident with the two shafts at Tabasquena, the Tesorito shaft and the surface projection of the mineralised veins. This anomaly has been categorized as having a high chargeability and is conductive. The anomaly has an average depth of approximately 250 to 300 meters. It should also be mentioned that this anomaly is visible on every line, albeit less intense on the most northerly line, as the target is becoming deeper to the north.

In conclusion

This geophysical work has now identified a large consistent chargeability anomaly that can be seen on all lines, implying a strike extent of at least 1000 metres and an apparent width of 400 to 500 metres. This observed IP anomaly could define a much wider mineralised system at depth.

The main recommendation of the original geophysical report was that prior to drilling the anomaly the 3D IP survey should be extended to the southeast for at least 1 km in the direction of the Tesorito shaft. This has now been completed and this new work has established that the main anomaly does in fact continue past the Tesorito shaft and is somewhat wider. A number of boreholes are now planned to intersect this anomaly.

Julio Pinto Linares is a QP, Doctor in Geological Sciences with specialty in Economic Geology and Qualified Professional No. 01365 by MMSA., and QP for Advance Gold and is the qualified person as defined by National Instrument 43-101 and he has read and approved the accuracy of technical information contained in this news release.

About Advance Gold Corp. (TSXV: AAX)

Advance Gold is a TSX-V listed junior exploration company focused on acquiring and exploring mineral properties containing precious metals. The Company acquired a 100% interest in the Tabasquena Silver Mine in Zacatecas, Mexico in 2017, and the Venaditas project, also in Zacatecas state, in April, 2018.

The Tabasquena project is located near the Milagros silver mine near the city of Ojocaliente, Mexico. Benefits at Tabasquena include road access to the claims, power to the claims, a 100-metre underground shaft and underground workings, plus it is a fully permitted mine.

Venaditas is well located adjacent to Teck’s San Nicolas mine, a VMS deposit, and it is approximately 11km to the east of the Tabasquena project, along a paved road.

In addition, Advance Gold holds a 13.23% interest on strategic claims in the Liranda Corridor in Kenya, East Africa. The remaining 86.77% of the Kakamega project is held by Barrick Gold Corporation.

For further information, please contact:

Allan Barry Laboucan,
President and CEO
Phone: (604) 505-4753
Email: [email protected]

Advance Gold $AAX.ca – Largest Gold ETF Inflows in Three Years Boosted Demand for Yellow Metal in the Third Quarter

Posted by AGORACOM at 7:56 PM on Tuesday, November 5th, 2019

SPONSOR: Advance Gold AAX.v – Advance Gold controls 100% interest in the Tabasquena Silver Mine in Zacatecas, Mexico. A cluster of 30 Epithermal veins have been discovered, with recent emphasis on exploring a large anomaly to drill. Advance also owns 15% of the Kakamega JV attached to Barrick Takeover Offer for Acacia Mining. Click Here For More Info

Pure 1,000-gram gold bars.

A surge in speculation led to an increase in gold demand in the third quarter, according to a World Gold Council report released Tuesday.

Exchange-traded fund inflows shot higher by the largest amount since the first quarter of 2016, in what the council attributed to accommodative monetary policies, safe-haven and momentum buying. During the third quarter, the Federal Reserve cut interest rates twice, and the European Central Bank cut interest rates in a package of easing measures.

Leading gold ETFs include the SPDR Gold Trust GLD, +0.01%, iShares Gold Trust IAU, +0.07%   and the Aberdeen Standard Physical Swiss Gold Shares ETF SGOL, -1.51%.

Overall gold demand rose just 3% during the quarter, as jewelry demand shrank by 16% as the yellow metal’s prices rose. 

Gold futures GC00, -1.67%  were holding above the $1,500 an ounce level on Tuesday and have climbed by 19% over the last 12 months.

Central-bank buying fell by 38%, as the third quarter of 2018 featured the highest amount of buying on record. Bar and coin demand dropped by half.

The gold supply rose by 4%, helped by a 10% increase in recycling.

SOURCE: https://www.marketwatch.com/story/largest-etf-inflows-in-three-years-drove-gold-demand-higher-in-the-third-quarter-2019-11-05

Affinity Metals $AAF.ca Provides Update on Regal Project Exploration Program $TUD.ca $GTT.ca $AMK.ca $OSK.ca

Posted by AGORACOM at 9:19 AM on Tuesday, November 5th, 2019

Vancouver, British Columbia–(Newsfile Corp. – November 5, 2019) – Affinity Metals Corp. (TSXV: AFF) (“Affinity”) (“the Corporation”) is pleased to report that it has now completed the drilling portion of the 2019 Regal exploration program at the Regal property located in the northern end of the prolific Kootenay Arc approximately 35 km northeast of Revelstoke, British Columbia, Canada.

A total of 1,846 meters of diamond drilling was completed with 21 holes being drilled. The drilling was divided over two target areas with 10 holes allocated to testing one of the phyllite/limestone contacts in the ALLCO area and 11 preliminary confirmation holes designed to test the historic 1971 resource (pre NI43-101 and therefore not compliant) reported for the Regal/Snowflake mines.

The core is now being logged along with sampling and splitting in preparation for assaying. Core samples will be sent to MSA Laboratories in Langley, BC for assaying and assay results will be reported once received.

Robert Edwards, CEO of Affinity stated: “We are extremely pleased that the weather allowed us to get into the Regal property for as long as we did and to complete the drill program as planned. Thanks to MoreCore Diamond Drilling, our geological team and the efforts of our CFO/Exploration Manager, Mr. Blaney, in getting the job done as efficiently as possible given all the challenges mother nature can throw at you. At the end of it all, we are very encouraged by what we saw in the core and look forward to receiving assays back in due course.”

As previously reported, the Corporation recently received assay results for all 22 rock samples collected in September 2019 from the Black Jacket and ALLCO areas of the property. Of the 22 grab samples collected from surface outcrops, the majority contained bonanza grade silver, zinc, and lead with many samples reaching assay over-limits. Further assaying of over-limits has been initiated and those results will be reported in the future. Results for all 22 samples are presented in the table below.

Sample NumberSample Type Silver
g/t
Copper
%
Zinc 
%
Lead
%
Gold
g/t
ALC19CR01grab0.035000
ALC19CR02grab1300.41518.20>20.00.70
ALC19CR03grab120.232.034.9840.02
ALC19CR04grab131.089.026.1022.66
ALC10CR05grab16.7.295.060.0130.09
ALC19CR06grab74.9.144>30.00.0590.28
ALC19CR07grab10.05.310.086.0290.04
ALC19CR08grab1870.49524.5>20.01.85
ALC19CR09grab88.1.077>30.00>1.880.08
ALC19CR10grab1545.17826.7>20.00.68
ALC19CR11grab2360.36616.80>20.00.11
ALC19CR12grab3700.6241.645>20.03.14
ALC19CR13grab964.71617.30>17.50.11
ALC19CR14grab3530.3501.945>20.01.57
ALC19CR15grab3670.0261.895>20.00.33
ALC19CR16grab1790.1075.28>20.00.37
ALC19CR17grab751.0696.45>18.050.45
ALC19CR18grab1065.718.178.5140.10
ALC19CR19grab2510.2995.58>20.00.06
ALC19CR20grab44102.2726.40>20.05.68
ALC19CR21grab47.5.177.048.0921.78
ALC19CR22grab87.7.095.011.0474.79

Property History & Background

The Regal Project hosts several past producing small-scale historic mines including the Regal Silver. The property also hosts numerous promising mineral occurrences. From the historic records it appears that most, and perhaps all, of the known mineralized showings/zones have not been previously drilled using modern diamond drilling methods.

Snowflake and Regal Silver (Stannex/Woolsey) Mines

The Snowflake and Regal Silver mines were two former producing mines that operated intermittently during the period 1936-1953. The last significant work on the property took place from 1967-1970, when Stannex Minerals completed 2,450 meters of underground development work and a feasibility study, but did not restart mining operations. In 1982, reported reserves were 590,703 tonnes grading 71.6 grams per tonne silver, 2.66 per cent lead, 1.26 per cent zinc, 1.1 per cent copper, 0.13 per cent tin and 0.015 per cent tungsten (Minfile No. 082N 004 – Prospectus, Gunsteel Resources Inc., April 29, 1986). It should be noted that the above resource and grades, although believed to be reliable, were prepared prior to the adoption of NI43-101 and are not compliant with current standards set out therein for calculating mineral resources or reserves.

ALLCO Silver Mine

The ALLCO Silver Mine is situated 6.35 Kilometers northwest of the above described Snowflake/Regal Mine(s). The ALLCO Silver Mine operated from 1936-1937 and produced 213 tonnes of concentrates containing 11 troy ounces of gold (1.55 g/t), 11,211 troy ounces of silver (1,637 g/t) and 173,159 lbs of lead (36.9%).

Airborne Geophysics to Guide Future Exploration

An extensive airborne geophysics survey conducted by Geotech Ltd of Aurora, Ontario, for Northaven Resources Corp. in 2011, identified four well defined high potential linear targets correlating with the same structural orientation as the Allco, Snowflake and Regal Silver mines. Northaven also reported that the mineralogy and structural orientation of the Allco, Snowflake and Regal Silver appeared to be similar to that of Huakan’s J&L gold project located to the north, and on a similar geophysical trend line. The J&L is reportedly now one of western Canada’s largest undeveloped gold deposits.

After completing the airborne survey, Northaven failed in financing their company and conducting further exploration on the property and subsequently forfeited the claims without any of the follow up work ever being completed. Affinity Metals is in the fortunate position of benefitting from this significant and promising geophysics data and associated targets.

The aforementioned Northaven airborne geophysical survey conducted at a cost of $319,458.95 in August of 2011 is described in The BC Ministry of Energy, Mines and Petroleum Resources Assessment Report #33054. The results of the survey are competently explained and illustrated by professionals on You Tube at: https://www.youtube.com/watch?v=GX431eBY_t0

Condor Consulting, Inc. who compiled the survey data and produced the original geophysics report was recently retained by Affinity in order to provide more detailed interpretations and potential drill target locations with the aim of testing two of the four target areas in the future.

Affinity Metals has been granted a 5 Year Multi-Year-Area-Based (MYAB) exploration permit which includes approval for 51 drill sites.

About Affinity Metals

Affinity Metals is focused on the acquisition, exploration and development of strategic metal deposits within North America.

American Creek $AMK.ca Announces Ken Konkin’s Appointment to Vice President for Project Development for Tudor Gold Including the JV Treaty Creek Project $TUD.ca $SII.ca $GTT.ca $AFF.ca $SEA.ca $SA $PVG.ca

Posted by AGORACOM at 9:11 AM on Monday, November 4th, 2019

Cardston, Alberta–(Newsfile Corp. – November 4, 2019) – American Creek Resources Ltd. (TSXV: AMK) (“American Creek”) is pleased to extend congratulations to Ken Konkin, PGeo, for his new role at Tudor Gold as Vice President for Project Development. Mr. Konkin was the exploration manager for the hugely successful 2019 drill program on our JV Treaty Creek property. The Treaty Creek property adjoins to the north of Pretium Resources’ Brucejack-Snowfield property and Seabridge Gold’s KSM property, along the geological trend. Drilling at Treaty Creek in 2019 was very successful under the direction of Mr. Konkin, hitting significant mineralization in all 14 holes which reconfirmed a 300m+ gold rich zone close to surface and an extension of mineralization to over one kilometer in depth.

Mr. Konkin has over 35 years of geological experience throughout North and South America as well as Russia. Mr. Konkin worked for Silver Standard for 19 years and managed advanced exploration programs at Manantial Espejo (Argentina), San Luis and Berenguela (Peru) as well as Snowfields (Pretium) in the Golden Triangle, British Columbia. Mr. Konkin was appointed the project manager for Pretium Resources after it purchased the Snowfields-Brucejack project from Silver Standard in 2010. Subsequently, he was instrumental in the discovery of the Valley of Kings deposit at the Brucejack Lake mine, an eight-million-ounce gold deposit currently in production. He spent seven years managing all aspects of the exploration programs at Snowfield-Brucejack. During his tenure with Pretium, the company received the Bill Dennis award in 2013 for a Canadian discovery (presented by the Prospectors & Developers Association of Canada); Mr. Konkin was also the co-recipient of the prestigious H.H. “Spud” Huestis award for “excellence in prospecting and mineral exploration in B.C. and/or Yukon” in 2017.

Cannot view this image? Visit: https://orders.newsfilecorp.com/files/682/49371_0139630cb41929c4_001.jpg


Image of Ken Konkin in the Sulphurets Hydrothermal System in NW British Columbia

To view an enhanced version of this graphic, please visit:
https://orders.newsfilecorp.com/files/682/49371_0139630cb41929c4_001full.jpg

Darren Blaney, CEO of American Creek stated: “Since Ken came on board the Treaty Creek property has been fast tracked and is now looking like a world class property. The knowledge and experience he gained by discovering and developing the neighbouring Brucejack mine is being applied on Treaty Creek and it really shows. Ken clearly has the expertise and credibility to bring the Treaty Creek project to the next level. A world class project deserves a world class VP of Project Development.”

The Treaty Creek Project is a joint venture between Tudor Gold, Teuton Resources Corp., and American Creek. Tudor is the operator and holds a 60% interest with both American Creek and Teuton each holding respective 20% carried interests in the property (fully carried until a production notice is given).

More information on Treaty Creek can be found here: https://americancreek.com/index.php/projects/treaty-creek/home

About American Creek

American Creek holds a strong portfolio of gold and silver properties in British Columbia.

Three of those properties are located in the prolific “Golden Triangle”; the Treaty Creek and Electrum joint venture projects with Tudor Gold (Walter Storm) as well as the 100% owned past producing Dunwell Mine.

There is a drill program ongoing at the high-grade, past producing Dunwell Mine. More information on the Dunwell Mine can be found here:

https://americancreek.com/index.php/projects/dunwell-mine

The Corporation also holds the Gold Hill, Austruck-Bonanza, Ample Goldmax, Silver Side, and Glitter King properties located in other prospective areas of the province.

For further information please contact Kelvin Burton at: Phone: 403 752-4040 or Email: [email protected]. Information relating to the Corporation is available on its website at www.americancreek.com

Loncor $LN.ca – Hard Asset Digest October 2019 Gold Market Update $ABX.ca $TECK.ca $RSG $NGT.to

Posted by AGORACOM at 2:34 PM on Friday, November 1st, 2019

Sponsor: Loncor is a Canadian gold exploration company focused on two projects in the DRC – the Ngayu and North Kivu projects. Both projects have historic gold production. Exploration at the Ngayu project is currently being undertaken by Loncor’s joint venture partner Barrick Gold (Congo) SARL (“Barrick”). The Ngayu project is 200 kilometres southwest of the Kibali gold mine, which is operated by Barrick and in 2018 produced approximately 800,000 ounces of gold. As per the joint venture agreement signed in January 2016, Barrick manages and funds exploration at the Ngayu project until the completion of a pre-feasibility study on any gold discovery meeting the investment criteria of Barrick. Subject to the DRC’s free carried interest requirements, Barrick would earn 65% of any discovery with Loncor holding the balance of 35%. Loncor will be required, from that point forward, to fund its pro-rata share in respect of the discovery in order to maintain its 35% interest or be diluted. Click Here for More Info

The first thing is gold 

It’s true that gold has made a significant upward move from $1,300 per ounce in May to currently around $1,500 per ounce with at least some of that move being attributable to bullish market fundamentals. Yet, we can also count on a lot more whipsaw action as gold continues to be ping-ponged about from geopolitical headline to geopolitical headline. 

The devaluation of fiat currencies in the face of rising and unsustainable debt loads across all developed economies will be the true driver of the long-term bull market that’s beginning to take form now.

 US government spending is so wildly out of control, and has been for more than a decade, that the federal debt will become unmanageable in the very near future. 

 Not that long ago, economists didn’t really have to think in terms of “Trillions of Dollars.” Yet today, we’ve grown accustomed to the fact… however dire it may be…that our federal debt is ballooning at a rate of nearly $1.5 Trillion each and every year. It’s simply not sustainable. 

At this rate, it will only be a few years until America can no longer afford to service its federal debt — no matter where interest rates go. 

Add to that the fact that we’re seeing this exact pattern of excessive money printing combined with unsustainable debt accumulation emerge across all developed economies. 

The end result can be only one thing: A devaluation of all fiat currencies. 

This doomed race to the bottom will leave gold, along with silver, standing alone as the only real store of value.

The EU is nearing recession

The Eurozone continues to experiment with negative interest rates in an attempt to spur economic growth by encouraging bank lending and also by boosting exports. Yet, the bottom line is that banks simply cannot make money in a negative deposit rate environment. 

 As much as banks may continue to try and sway lenders to do something more useful with their money than simply parking it with the European Central Bank, it’s doubtful such an ill-devised monetary policy can stave off recession. 

Thus far, growth has remained anemic, raising the specter of a recession hitting the Eurozone sometime next year.  

US/China Trade War: A trickle down effect across Europe’s largest economies

Germany, Europe’s largest economy, is suffering its worst manufacturing downturn in almost seven years as the US/China trade war spills over into european economies. 

 It’ll be interesting to see if Germany resorts to injecting fiscal stimulus (aka, the printing of even more money!) to boost its sagging export-reliant economy. Growth forecasts for 2020 have already fallen below the key 1% threshold.

Britain, Europe’s second largest economy, remains mired in its self-induced Brexit maelstrom, which certainly isn’t helping things from an economic standpoint. 

In what looks to be a warning sign of impending stagnation, the British economy took its first step backward (in Q2) in more than 7 years. Amid all the turmoil, it seems increasingly doubtful Britain will be exiting the EU on October 31st, with or without a deal, as the Brexit cloud continues to darken.

New reports are also revealing weakness in Europe’s third largest economy, France. In fact, the export sectors of both France and Germany – which includes their high-profile automobile industries – are being hit hard by flagging demand from China.

 The luster is coming off the Chinese economy

While growth in China held steady at 6.4% in Q1 this year, it proceeded to slip to 6.2% in Q2. Economic numbers over the last few months reveal that the worst may not yet be over for China with analysts projecting weakening third quarter data. 

 A recent survey by China Beige Book reveals slowing growth and soaring debt levels for the world’s second largest economy.

 Here at home, the trade war continues to stoke recession fears

US gross domestic product grew at a 2% annual pace from April to June, which was in-line with expectations. Yet, how long can that last? 

Affinity Metals $AAF.ca Gold Prices to Push to $1,600 an Ounce in 2020, says World Bank $SII.ca $TUD.ca $GTT.ca $AMK.ca $OSK.ca

Posted by AGORACOM at 10:38 AM on Friday, November 1st, 2019

Sponsor: Affinity Metals is a Canadian mineral exploration company building a strong portfolio of mineral projects in North America. The Corporation’s flagship property is the Drill ready Regal Property near Revelstoke, BC (TSX-V: AFF) Click Here for More Info

Investors can expect the rally in gold to continue as uncertainty dominates the marketplace, according to the latest forecast from the World Bank.

In a report published Tuesday, the global financial institution said that it expects gold prices to rally 5.6% in 2020, which would see prices trade around $1,600 an ounce.

“The risks to the precious metals price outlook are on the upside and reflect heightened uncertainty and weak growth prospects of the global economy,” the analysts said.

The comments come after gold prices rallied 12.6% in the third quarter as prices pushed to a six-year high, seeing best gains in three years. When the dust settles, the analysts expect prices to record a 9.5% gain for 2019.

“Prices have been supported by strong physical demand, interest rate cuts by the U.S. Federal Reserve, and increased global policy uncertainty,” the analysts said. “Increased demand for gold has been led by central bank purchases, investor holdings in gold-backed exchange traded funds, and jewelry sales, especially in India.”

Gold is expected to outperform in the precious metals space as industrial demand weighs on other metals like silver and platinum, the report said.

Looking at silver, the World Bank said that they expect prices to rally 4.9% next year, which would push prices close to $19 an ounce. The rally comes as analyst expect the metal to rally 3.1% this year.

Precious metals will continue to outperform base metals as global growth concerns continue to weigh on copper prices, the World Bank added. The analysts expect copper prices to rally 2.3% next year after dropping 8% this year. The entire base metals complex is projected to fall 1.4% in 2020, after seeing a decline of 5.2% this year.

“Risks to this outlook are tilted to the downside, including the possibility of a sharper-than-expected global downturn and less effective policy stimulus in China,” the analysts said.

The analysts noted that gold’s stellar performance and copper’s lackluster moves have pushed the gold-copper ratio to its highest level in three years during the third quarter.

SOURCE: By Neils Christensen

American Creek $AMK.ca Treaty Creek Moves Closer to Eric Sprott’s Prediction of 10 to 20 Million Ounces with Latest Drill Results $TUD.ca $SII.ca $GTT.ca $AFF.ca $SEA.ca $SA $PVG.ca

Posted by AGORACOM at 9:43 AM on Thursday, October 31st, 2019
  • 23 holes drilled in the last two years have intersected significant mineralization and dramatically increased the size of the Goldstorm deposit at Treaty Creek
  • Eric Sprott re-emphasized the potential of the project in last Friday’s podcast where he stated that he is “hoping they can prove up a 20-million-ounce deposit”
https://www.sprottmoney.com/Blog/after-three-weeks-going-sideways-gold-and-silver-just-woke-up-weekly-wrap-up-october-25-2019.html

11:30 –“I still believe there’s going to be huge deposit proven up there. If we get the right environment in precious metals, which it looks like we might be getting here, people are going to start looking at these things again, and it could be very, very exciting, so…and I am, kind of, hoping that they can ultimately pull up, like, a 20 million ounce deposit there. So these stocks would prove to be very, very inexpensive”

SUMMARIZING THE 2019 PROGRAM

The Company’s JV partner, Tudor Gold’s 2019 exploration program at the Goldstorm Zone on Treaty Creek totalled 9,781.8 meters with 14 diamond drill holes. This year’s drilling program generated the best near-surface results attained to date on the project. Specifically, in addition to several hundred meters extension along strike to the northeast, the 2019 program significantly expanded the mineralized limits to the southeast, where one of the best near-surface intervals averaged 2 g/t Au over 87m, within 336 m averaging 1 g/t Au in hole GS19-52.

RESULTS OF THE FINAL 5 DRILL HOLES

  • Hole GS19-49 was drilled to 960.1 m, at -80° dip, on Section 111+00 NE next to the previously announced vertical hole GS19-48, which yielded 0.725 g/t Au over 838.5m, including an upper horizon that averaged 1.048 g/t gold Au over 328.5 m. Hole GS19-49 returned equally impressive results with a comparable 0.7 g/t Au over 826.5 m and the upper horizon averaging 1 g/t Au over 249 m 
  • Along the same section, hole GS19-52 (-50° dip at 115° azimuth) was drilled much longer than expected because the Goldstorm System continues at least 700 m to the southeast ; GS19-52 averaged 1 g/t gold over 336 meters with a higher grade core of 2 g/t gold over 87 meters within the upper horizon.

Tudor Gold Exploration Manager, Ken Konkin explained: “Clearly the results of the previously reported deep vertical step-out holes demonstrate the impressive size and grade consistency of the Goldstorm system. Within the overall mineralized package of fragmental intermediate volcanic rocks there are several sub-horizontal horizons of significantly higher gold grades. The uppermost portions of the previously reported holes GS19-42, GS19-47 and GS19-48 contained respectively, 1.268 g/t gold over 252 m, 0.828 g/t gold over 301.5 m and 1.048 g/t gold over 328.5 m. We now have several other drill holes with excellent near-surface gold values to add to this list of growing intercepts. GS19-52 has returned the highest core gold grades of 2.006 g/t Au over 87 m within a 336m intercept of 1.004 g/t Au.

These intercepts are part of the uppermost portion of the Goldstorm system which we refer to as the ‘300 Horizon’. The ‘300 Horizon’ remains open along strike to the northeast as well as to the southeast. In addition, the lower horizons of the Goldstorm system also remain open in all directions and the lowest horizon is open at depth.”

Furthermore, Mr. Konkin added: “We are seeing consistent silver and copper mineralization associated with the deeper gold horizons such as the previously reported 151.5 m zone of 0.572 g/t gold, 8.5 g/t silver and 0.21% copper that was intercepted from 665.0 to 816.5 m in GS19-47 and a 66.0 m zone with 0.958 g/t gold, 3.9 g/t silver and 0.35% copper, whichwas intercepted from 874.5 to 940.5 m in GS19-48. Similarly, we have now seen in GS19-49, a 78 m intercept averaging 1.145 g/t gold, 11.2 g/t silver and 0.21% copper (750-828 m) and in GS19-52 an 88.5 m interval averaging 0.352 g/t gold, 9.3 g/t silver and 0.25% copper (515-603.5 m). Not only does the Goldstorm Zone remain open at depth and along strike, we are now seeing base-metal associations possibly as part of a zonation within the hydrothermal system.”

The final three footwall extension holes (GS19-50, GS19-51 and GS19-53) were completed on section 110+00 NE. These were successful in extending the width of the mineralized zone to the southeast:

  • Hole GS19-50 returned an average of 0.602 g/t Au over 577.5 m including 0.811 g/t Au over 267.0 m in the ‘300 Horizon
  • Hole GS19-51 returned an average of 0.721 g/t Au over 246 m in the ‘300 Horizon’ and a lower horizon that averages 1.017 g/t Au over 40.5 m.
  • Hole GS19-53 returned an average of 0.984 g/t Au over 147.0 m in the ‘300 Horizon’
Cannot view this image? Visit: https://orders.newsfilecorp.com/files/682/49176_99c64899f4a48b79_001.jpg

About American Creek

American Creek is a Canadian junior mineral exploration company with a strong portfolio of gold and silver properties in British Columbia.

Three of those properties are located in the prolific “Golden Triangle”; the Treaty Creek and Electrum joint venture projects with Tudor Gold/Walter Storm as well as the 100% owned past producing Dunwell Mine.

The Treaty Creek Project is a Joint Venture with Tudor Gold owning 60% and acting as operator. American Creek and Teuton Resources each have 20% interests in the project. American Creek and Teuton are both fully carried until such time as a Production Notice is issued, at which time they are required to contribute their respective 20% share of development costs. Until such time, Tudor is required to fund all exploration and development costs while both American Creek and Teuton have “free rides”.

More information about the Treaty Creek Project can be found here: https://americancreek.com/index.php/projects/treaty-creek/home

A drill program is also ongoing on American Creek’s 100% owned Dunwell Mine property located near Stewart. More information can be found here: https://americancreek.com/index.php/projects/dunwell-mine

The Corporation also holds the Gold Hill, Austruck-Bonanza, Ample Goldmax, Silver Side, and Glitter King properties located in other prospective areas of the province.

For further information please contact Kelvin Burton at: Phone: 403 752-4040 or Email: [email protected]. Information relating to the Corporation is available on its website at www.americancreek.com.

Hub on Agoracom
  FULL DISCLOSURE: American Creek is an advertising client of AGORA Internet Relations Corp.