Agoracom Blog Home

Posts Tagged ‘#ShawnRyan’

Labrador Gold $LAB.ca Gold Market Update $RIO.ca $WHM.ca $SIC.ca $NXS.ca

Posted by AGORACOM at 4:33 PM on Monday, January 13th, 2020
This image has an empty alt attribute; its file name is LAB-square-logo-2.png

SPONSOR: Labrador Gold – Two successful gold explorers lead the way in the Labrador gold rush targeting the under-explored gold potential of the province. Exploration has already outlined district scale gold on two projects, including a 40km strike length of the Florence Lake greenstone belt, one of two greenstone belts `covered by the Hopedale Project. Click Here for More Info

It has been a week of surprises since the last updates were posted. First, I had not expected Iran to retaliate following the murder of its top General by a US drone, but it did, despite the risks, as it was politically necessary to assuage the extreme anger of its population who demanded revenge. The next surprise was that Israel and the US did not use this retaliation as an excuse to bomb Iran back to the Stone Age, which is what they really want to do. As we know, the long-term goal of Israel and the US is to subjugate Iran, and they will not stop until they attain this goal, and so it goes on. It appears that there was a bit of theater involved in Iran’s retaliation, as it clandestinely signaled its intentions which allowed US forces to get out of harm’s way. Perhaps US forces did not then launch a blitzkrieg out of consideration for this courtesy.

Regardless of the muddled and unpredictable fundamental situation, which included the accidental downing of a passenger plane by Iranian defensive missile batteries, the charts allowed us to make a reasonably accurate prediction regarding what was likely to happen to the gold price. The call for a near-term top in the PM sector made on the site on Monday looked incorrect the following evening when gold suddenly surged about $35 on news of the retaliatory Iranian missile strike, but when it later became apparent that there were, strangely, no US troop casualties and no further action against Iran, gold and silver reversed dramatically and dropped quite hard as the tension then looked set to ease, at least over the short-term. Technically what happened is that gold pushed quite deep into heavy overhead resistance, becoming very overbought at a time when COTs were showing extreme readings, and was thus vulnerable to a sudden reversal. The action around this time illustrates an important point, which is that when gold rises due to sudden geopolitical developments, the gains tend not to stick – what really matters and is the big driver for gold at this time is the insane monetary expansion that is going on, which is being undertaken in a desperate attempt to postpone the systemic implosion that is baked in for as long as possible. As we have already observed in these updates in recent weeks, gold is already in a raging bullmarket against a wide variety of currencies, and it won’t be all that long before it’s in a raging bullmarket against the dollar too, as the Fed sets the stage for hyperinflation.

There are two big and compelling reasons for the US government to tank the dollar. One is that it makes US exporters more competitive, and the other is that it can use the mechanism of inflation to wipe clean its colossal debts, by paying them off in devalued coin, printing vast amounts of money to pay them off, in the process legally swindling the foolish creditors out of their dues. This is precisely what the Weimar Republic in Germany did in 1923 to eliminate the unfair reparations imposed by the Treaty of Versailles, which were unfair also because Germany didn’t start the 1st World War – it was tricked into it by the allies, because the British Empire was scared of Germany’s rising industrial and military might and wanted to destroy it, 100 plus years of propaganda lies about Germany being responsible for the 1st World War notwithstanding.

We’ll look at the dollar a little later. First we will review gold’s charts, starting with the 10-year chart.

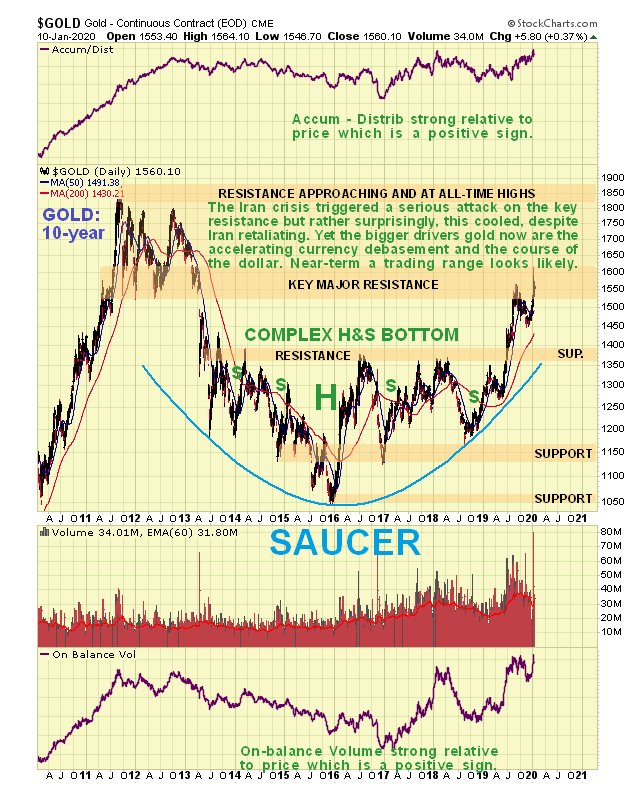
On the 10-year chart we see that gold is now a bullmarket, even against the dollar, and is currently challenging the heavy resistance arising from the 2011 – 2013 top area. The second attack on this resistance in the space of few months got further because of the Iran crisis, and if this cools any more short-term, it will probably lead to gold settling into a trading range before it mounts a more successful attack on this resistance. A point to note here is that while the resistance up to the 2011 highs in the $1800 area looks like a major obstacle, it’s not such a big deal as many think, given the rate at which the dollar is now being debased.


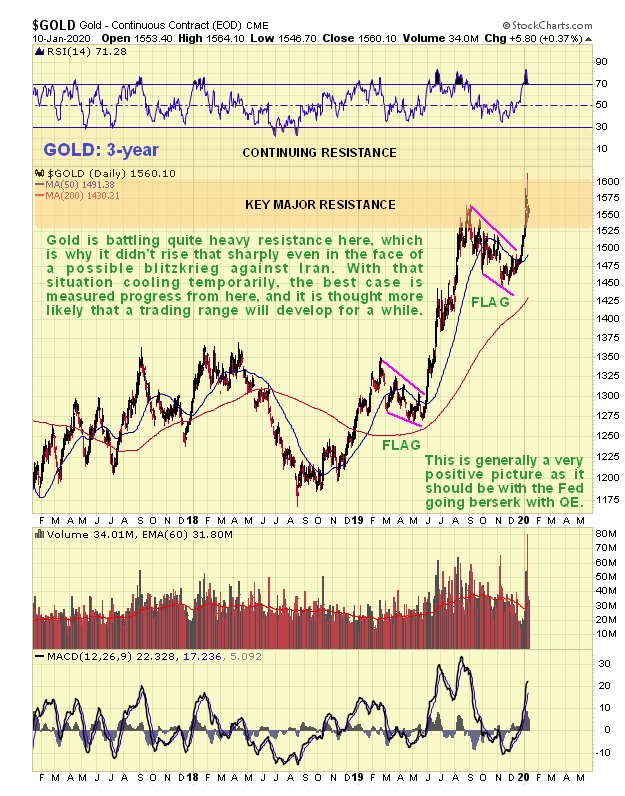
This week it’s worth also taking a quick look at a 3-year chart for added perspective. This chart shows us that since the bullmarket started in mid-Summer, we have seen 3 sharp runups punctuated by 2 bull Flags. While the 2nd of these Flags targets the $1800 area, we have to factor in that gold now has much more overhanging supply to contend with than on the 1st runup, and this, coupled with quite extreme COT readings, inclines to the view that this will need to be worked off. Hence the interpretation that it will probably need to consolidate for a while before it makes significant further progress, although it obviously won’t if the US starts a serious bombing campaign against Iran. The Fed’s increasingly manic money printing will eventually drive it higher, of course


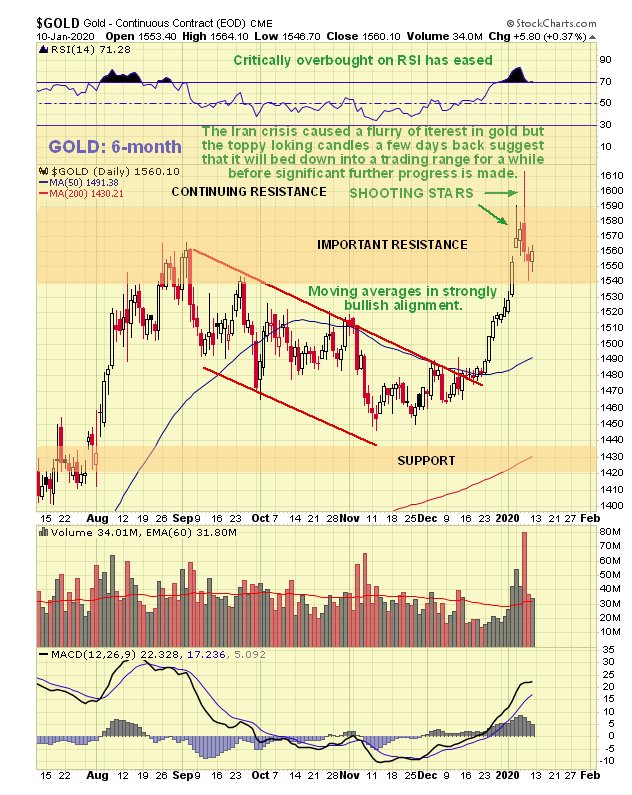
On the 6-month chart we can see the interesting price action around the Iran crisis over the past week or so. A bearish “shooting star” appeared on the chart last Monday, which we took as a sign that gold was forming a short-term top, but then overnight on the 7th to the 8th it surged briefly above $1610 when Iran lobbed missiles at US bases in Iraq, which had many concluding, not unnaturally that this would trigger a major Israel – US bombing campaign. When it became apparent that there were no casualties from the Iranian attack and no US counter strike, tensions quickly cooled and gold lost ground fast the next day, putting in a big high-volume reversal candle, approximating to another “shooting star”. Normally such action is followed by a retreat at least for a while, and some stocks, like silver stock Coeur Mining (CDE), that we ditched a while ago, got clobbered. This is why gold is expected to settle down into a trading range for a while before mounting another attack on the resistance.


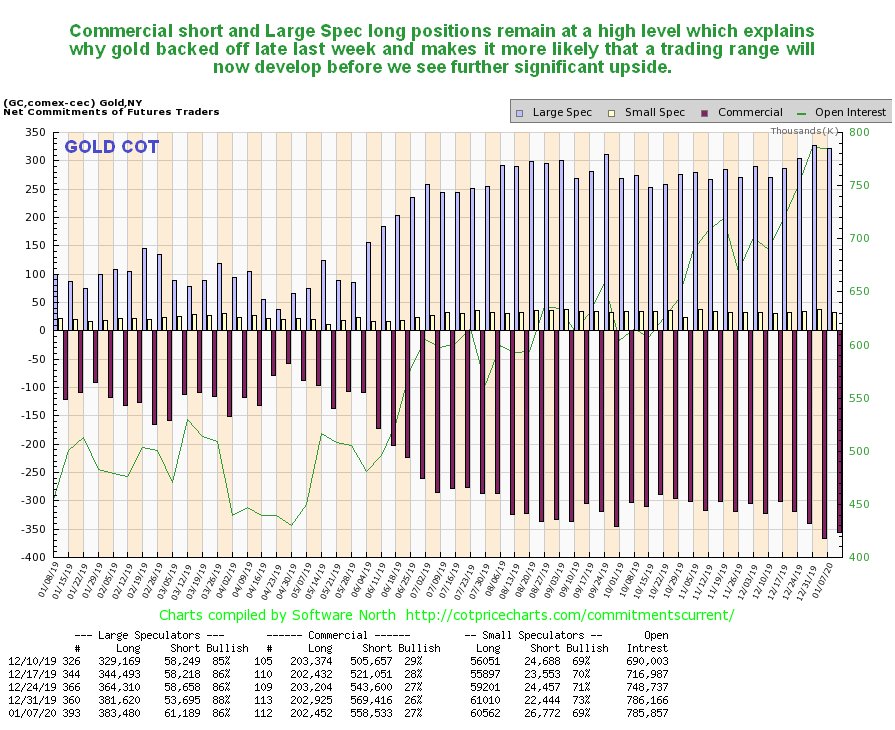
Another factor suggesting that gold will consolidate / react back for a while is the latest COT, which shows still very high Commercial short and Large Spec long positions…

Click on chart to popup a larger, clearer version.


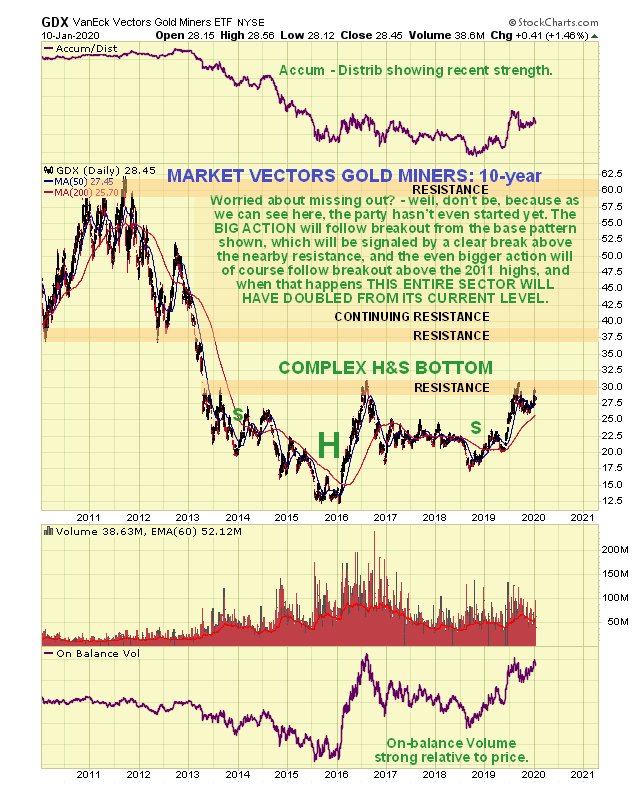
What about Precious Metals stocks? The latest 10-year chart for GDX shows that we still have most everything to look forward to, for despite the rally from the middle of last year, it still hasn’t broken out of the giant complex Head-and-Shoulders bottom that has been formed since way back early in 2013. A breakout above the nearby resistance should lead to a rapid ascent to the next resistance level at the underside of a large top pattern, and thereafter it will have to work its way through continuing resistance up to its highs. The strength of the volume indicators in the recent past are a sign that it “means business”.


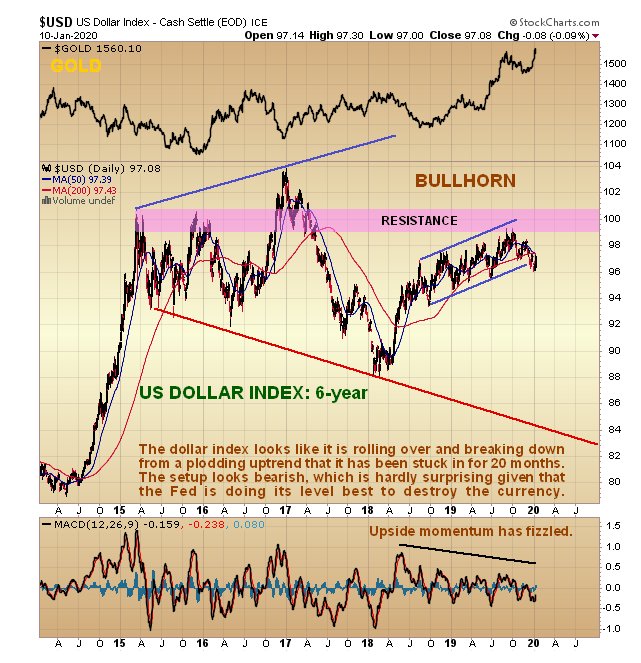
Now we turn our attention to the dollar, which is looking increasingly frail as we can see on the latest 6-year chart for the dollar index. It is rolling over beneath resistance and appears to be breaking down from the 16-month gentle uptrend shown. This is of course the main reason that gold, shown at the top of this chart, has been breaking higher again. If it fails to hold up here it could be targeting the lower boundary of the bullhorn pattern, which would involve a heavy drop from the current level that would “light a fire” under the Precious Metals, and many other commodities, notably copper.


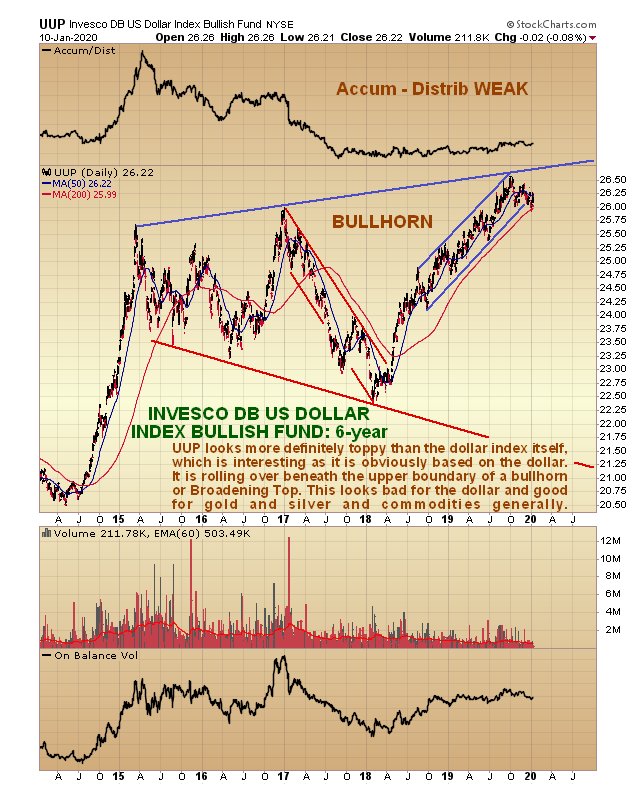
A chart that really gives the game away and calls time on the dollar is the 6-year chart for dollar proxy UUP. As we can see, unlike the dollar index itself, this has risen up to the upper boundary of its giant bullhorn pattern and appears to be on the point of breaking down. Its Accumulation line has been very weak. This chart suggests that the dollar could be in for a very rough ride before long, which is hardly surprising considering the lengths to which the Federal Reserve is going to destroy it. While other countries and trading blocs, most notably the EU, are making a valiant attempt to destroy their own currencies, they will be hard put to keep up with the Fed.


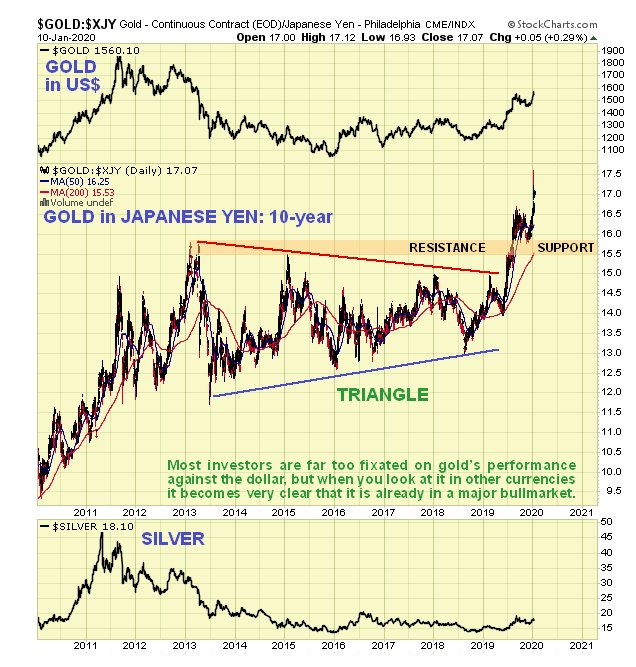
And now, for the benefit of anyone who still doubts that gold is in a bullmarket, I have pleasure in presenting the following 6-year chart for gold against the Japanese Yen…


Still think gold might be in bearmarket? – no – didn’t think you would.

It’s always good to end on a positive note, and we’ll do so by looking at a stock with a supremely bullish setup, which we happened to buy right before it broke out about a week ago, and it may well have been our buying that triggered the breakout…
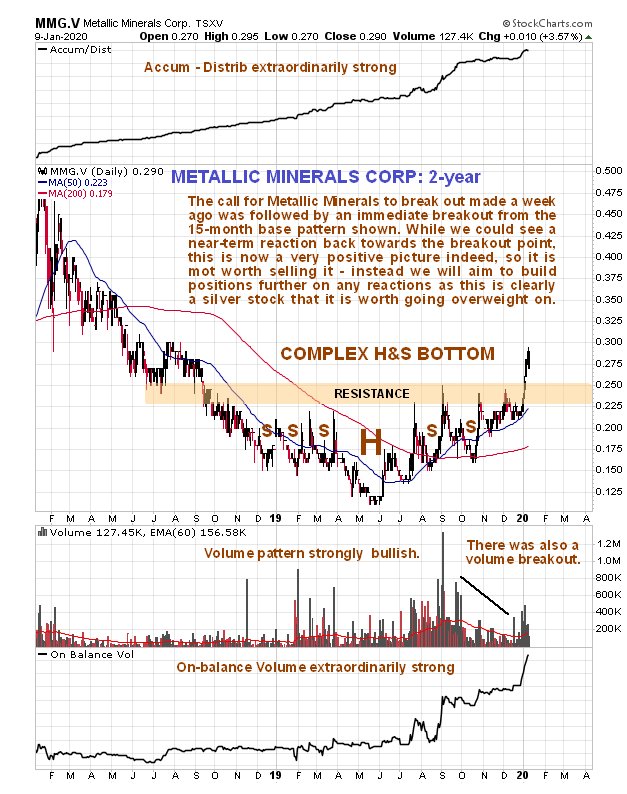

Although you can never be 100% sure of anything with these smaller issues, I am sure that you will agree with me that this chart is not suggestive of a sector that is going anywhere but up.

Conclusion: although last week’s reversal candle and the current rather extreme COT structure mean that gold may react back more near-term, the overall picture is strongly bullish, which is hardly surprising as the fiat money system is fast approaching its nemesis, with the line of least resistance leading to hyperinflation. Our general approach therefore is not to sell PM sector investments, except on a case by case basis where they become critically overbought, but instead buy or add to positions on dips.

https://www.clivemaund.com/gmu.php?art_id=68&date=2020-01-12
12-Year Breakout in Mining Stocks Relative to Gold – SPONSOR: Labrador Gold $LAB.ca – $RIO.ca $WHM.ca $SIC.ca $NXS.ca

Posted by AGORACOM at 3:34 PM on Friday, January 10th, 2020
This image has an empty alt attribute; its file name is LAB-square-logo-2.png

SPONSOR: Labrador Gold – Two successful gold explorers lead the way in the Labrador gold rush targeting the under-explored gold potential of the province. Exploration has already outlined district scale gold on two projects, including a 40km strike length of the Florence Lake greenstone belt, one of two greenstone belts covered by the Hopedale Project. Click Here for More Info

Excerpts from Crescat Capitals November Newsletter:

Precious Metals

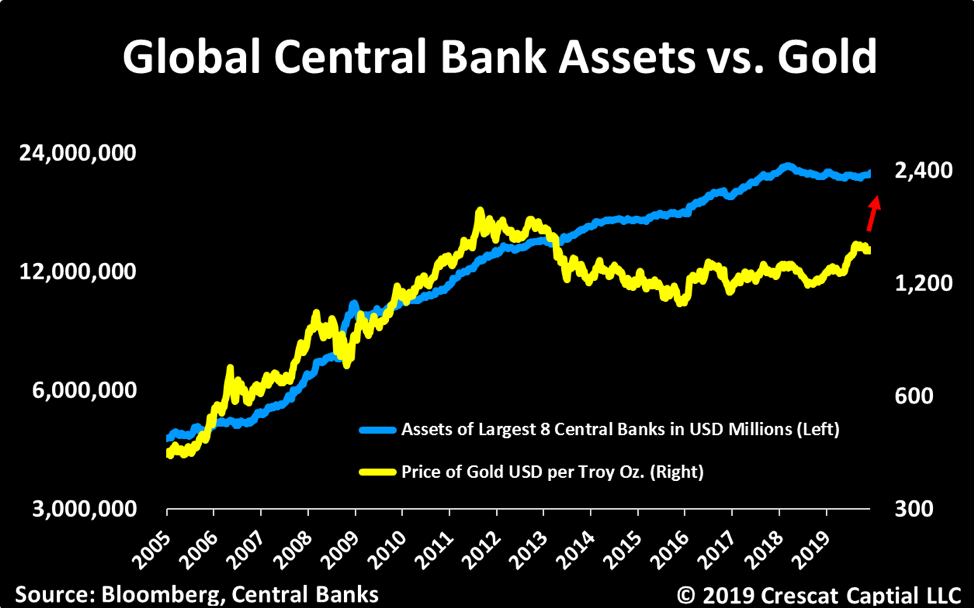
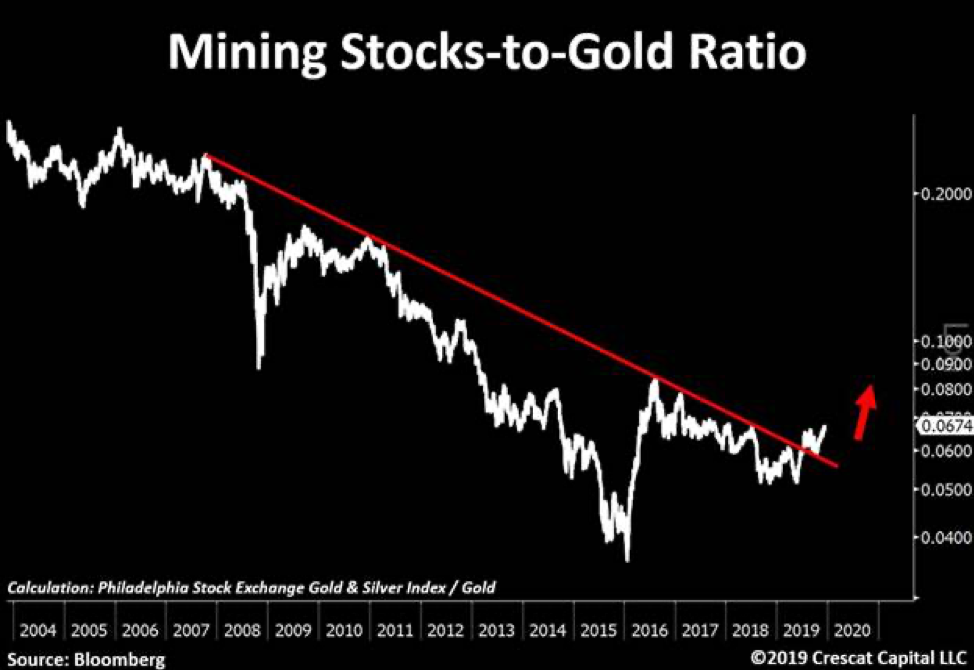
Precious metals are poised to benefit from what we consider to be the best macro set up we’ve seen in our careers. The stars are all aligning. We believe strongly that this time monetary policy will come at a cost. Look in the chart below at how the new wave of global money printing just initiated by the Fed in response to the Treasury market funding crisis is highly likely to pull depressed gold prices up with it.

The imbalance between historically depressed commodity prices relative to record overvalued US stocks remains at the core of our macro views. On the long side, we believe strongly commodities offer tremendous upside potential on many fronts. Precious metals remain our favorite. We view gold as the ultimate haven asset to likely outperform in an environment of either a downturn in the business cycle, rising global currency wars, implosion of fiat currencies backed by record indebted government, or even a full-blown inflationary set up. These scenarios are all possible. Our base case is that governments and central banks will keep their pedals to the metal to attempt to fend off credit implosion or to mop up after one has already occurred until inflation becomes a persistent problem.

The gold and silver mining industry is precisely where we see one of the greatest ways to express this investment thesis. These stocks have been in a severe bear market from 2011 to 2015 and have been formed a strong base over the last four years. They are offer and incredibly attractive deep-value opportunity and appear to be just starting to break out this year. We have done a deep dive in this sector and met with over 40 different management teams this year. Combining that work with our proprietary equity models, we are finding some of the greatest free-cash-flow growth and value opportunities in the market today unrivaled by any other industry. We have also found undervalued high-quality exploration assets that will make excellent buyout candidates.

We recently point out this 12-year breakout in mining stocks relative to gold now looks as solid as a rock. In our view, this is just the beginning of a major bull market for this entire industry. We encourage investors to consider our new Crescat Precious Metals SMA strategy which is performing extremely well this year.

Zero Discounting for Inflation Risk Today

With historic Federal debt relative to GDP and large deficits into the future as far as the eye can see, if the global financial markets cannot absorb the increase in Treasury debt, the Fed will be forced to monetize it even more. The problem is that the Fed’s panic money printing at this point in the economic cycle may hasten the unwinding of the imbalances it is so desperate to maintain because it has perversely fed the last-gasp melt up of speculation in already record over-valued and extended equity and corporate credit markets. It is reminiscent of when the Fed injected emergency cash into the repo market at the peak of the tech bubble at the end of 1999 to fend off a potential Y2K computer glitch that led to that market and business cycle top.
After 40 years of declining inflation expectations in the US, there is a major disconnect today between portfolio positioning, valuation, and economic reality. Too much of the investment world is long the “risk parity” trade to one degree or another, long stocks paired with leveraged long bonds, a strategy that has back-tested great over the last 40 years, but one that would be a disaster in a secular rising inflation environment.

With historic Federal debt relative to GDP and large deficits into the future as far as the eye can see, rising long-term inflation, and the hidden tax thereon, is the default, bi-partisan plan for the US government’s future funding regardless of who is in the White House and Congress after the 2020 elections. The market could start discounting this sooner rather than later.
The Fed’s excessive money printing may only reinforce the unraveling of financial asset imbalances today as it leads to rising inflation expectations and thereby a sell-off in today’s highly over-valued long duration assets including Treasury bonds and US equities, particularly insanely overvalued growth stocks. We believe we are in the vicinity of a major US stock market and business cycle peak.

Source:”Running Hot”

Courtesy of Crescat Capital: https://www.crescat.net/running-hot/

Thanks to

Kevin C. Smith, CFA
Chief Investment Officer

Tavi Costa
Portfolio Manager

Labrador Gold $LAB.ca Provides Review of 2019 Exploration and Outlines Plans for 2020 $RIO.ca $WHM.ca $SIC.ca $NXS.ca

Posted by AGORACOM at 9:52 AM on Thursday, January 9th, 2020
This image has an empty alt attribute; its file name is LAB-square-logo-2.png

Labrador Gold Corp. (TSX-V: LAB) (“LabGold” or the “Company”) is pleased to provide a review of its exploration activities completed during 2019. During 2020, LabGold intends to test the continuity of recently discovered mineralization at its Hopedale Project with a drilling program.

Roger Moss, President and CEO stated: “Exploration on both of our Labrador Projects during 2019 continued to successfully define areas of gold mineralization. These include the discovery of a new gold showing with assays from 1.67 to 8.26 g/t gold in grab samples at the Hopedale Project. This is located 500 metres along strike from the known Thurber Dog gold showing within a broader three kilometre stretch of anomalous gold in rock and soil. We look forward to continuing our systematic exploration, including drilling, of this mineralized system in 2020.”

 2019 Hopedale Project Highlights

  • Discovered a new gold showing north of the Thurber Dog gold occurrence, grab samples from which assayed between 1.67 and 8.26 g/t Au.
  • The Thurber Dog gold occurrence has assays in grab and channel samples from below detection up to 7.866 g/t Au, with 5 samples greater than 1 g/t Au and 16 samples assaying greater than 0.1 g/t Au.
  • The discovery extends the potential strike length of gold mineralization by approximately 500 metres along strike to the north.The new showing occurs within a larger 3km trend of anomalous gold in rock and soil associated with the contact between mafic/ultramafic volcanic rocks and felsic volcanic rocks.

 2019 Ashuanipi Project Highlights

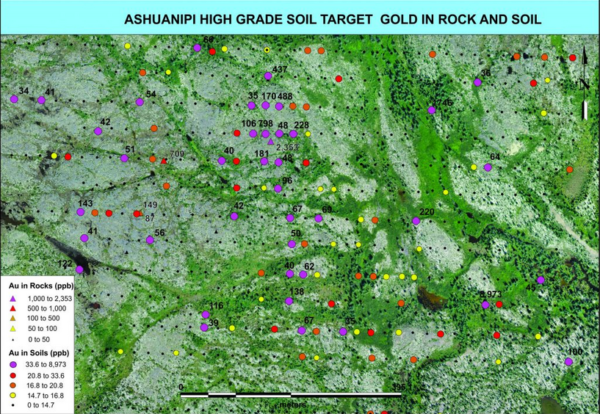
  • Discovered a gold enriched zone near a high grade (8,973ppb) soil sample taken in 2018.
  • The zone is defined by anomalous gold in both soil (below detection up to 1,746ppb Au and including 12 samples over 100ppb Au) and grab rock samples (below detection up to 2.35 g/t Au) that cover an area of 450 metres by 450 metres.A second area of gold mineralization associated with garnet-bearing gossanous gneiss also shows potential.
  • Grab rock samples show values from below detection to 0.68 g/t Au with 10 samples showing values greater than 0.1 g/t Au over an area of 200m by 120m within a larger anomalous area of gold in soil samples.

 Note that grab samples are selected samples and are not necessarily representative of mineralization on the properties. 

Location of the new showing, Thurber Dog, Thurber North and Thurber South occurrences within the 3km long mineralized Thurber trend:

New Showing with rusty zones due to the presence of pyrite and arsenopyrite:

What to expect in 2020

Hopedale Project

Exploration at Hopedale during 2020 will focus on determining the extent of the Thurber Dog mineralized trend. Such work would aim to fill in the gaps between showings over the three-kilometre strike length with sampling and VLF-EM surveys. LabGold also intends to carry out an initial drill program targeting prospective areas along this trend, including the new showing.

Ashuanipi Project

LabGold’s priority at Ashuanipi is to reach an agreement with the Matimekush-Lac John First Nation to enable continued exploration of the property. The 2019 election of the new Chief and Council has been challenged in Federal Court in Quebec with a court date scheduled for the end of February. As such, community engagement and negotiations are on hold until the court case is settled.

Borden Lake Extension Project

During 2019, Newmont Goldcorp announced the start of commercial production at their Borden Mine. The Borden Lake Extension project is located less than five kilometres from the Borden Mine along the southeast trend of the Borden Gold zone. Note that mineralization hosted on nearby properties is not necessarily indicative of mineralization that may be hosted on the Company’s property.

Given the start of mining at Borden, follow up of past results at the Borden Lake Extension project will be undertaken in 2020. Such work will likely include additional till sampling and geochemical surveys to better define the previously outlined anomalous zones as well as a reinterpretation of VLF-EM data using the latest inversion software. Due to the glacial cover in the area, overburden drilling, guided by results of this work, would be the best means to define targets for follow up diamond drilling.

Location of the BLE property and anomalous gold zones along trend to the southeast of Newmont-Goldcorp’s Borden Gold Zone.

 All samples were shipped to the Bureau Veritas laboratory in Vancouver, BC, where they were crushed and split and a 500g sub sample pulverized to 200 mesh. Samples of 30g were analyzed for gold by fire assay with an atomic absorption finish and another 15g sample for 36 elements by ultratrace ICP-MS (inductively coupled plasma-mass spectrometry) following an aqua regia digestion. Over limit samples (greater than 10g/t Au) are re-assayed using fire assay with a gravimetric finish. In addition to the QA-QC conducted by the laboratory, the Company routinely submits blanks, field duplicates and certified reference standards with batches of samples to monitor the quality of the analyses.

Roger Moss, PhD., P.Geo., is the qualified person responsible for all technical information in this release.

The Company gratefully acknowledges the Newfoundland and Labrador Ministry of Natural Resources’ Junior Exploration Assistance (JEA) Program for its financial support for exploration of the Ashuanipi property.

About Labrador Gold:

Labrador Gold is a Canadian based mineral exploration company focused on the acquisition and exploration of prospective gold projects in the Americas. In 2017 Labrador Gold signed a Letter of Intent under which the Company has the option to acquire 100% of the Ashuanipi property in northwest Labrador and the Hopedale property in eastern Labrador.

The Hopedale property covers much of the Florence Lake greenstone belt that stretches over 60 km. The belt is typical of greenstone belts around the world but has been underexplored by comparison. Initial work by Labrador Gold during 2017 show gold anomalies in soils and lake sediments over a 3 kilometre section of the northern portion of the Florence Lake greenstone belt in the vicinity of the known Thurber Dog gold showing where grab samples assayed up to 7.8g/t gold. In addition, anomalous gold in soil and lake sediment samples occur over approximately 40 kilometres along the southern section of the greenstone belt (see news release dated January 25, 2018 for more details).

The Ashuanipi gold project is located just 35 km from the historical iron ore mining community of Schefferville, which is linked by rail to the port of Sept Iles, Quebec in the south. The claim blocks cover large lake sediment gold anomalies that, with the exception of local prospecting, have not seen a systematic modern day exploration program. Results of the 2017 reconnaissance exploration program following up the lake sediment anomalies show gold anomalies in soils and lake sediments over a 15 kilometre long by 2 to 6 kilometre wide north-south trend and over a 14 kilometre long by 2 to 4 kilometre wide east-west trend. The anomalies appear to be broadly associated with magnetic highs and do not show any correlation with specific rock types on a regional scale (see news release dated January 18, 2018). This suggests a possible structural control on the localization of the gold anomalies. Historical work 30 km north on the Quebec side led to gold intersections of up to 2.23 grams per tonne (g/t) Au over 19.55 metres (not true width) (Source: IOS Services Geoscientifiques, 2012, Exploration and geological reconnaissance work in the Goodwood River Area, Sheffor Project, Summer Field Season 2011). Gold in both areas appears to be associated with similar rock types.

The Company has 57,039,022 common shares issued and outstanding and trades on the TSX Venture Exchange under the symbol LAB.

For more information please contact:
Roger Moss, President and CEO
Tel: 416-704-8291
Or visit our website at: www.labradorgold.com
Twitter: @LabGoldCorp

Labrador Gold $LAB.ca – Announces Up to 8.26g/t Gold in Selected Grab Samples from New Showing at Hopedale Project, Labrador $RIO.ca $WHM.ca $SIC.ca $NXS.ca

Posted by AGORACOM at 9:06 AM on Friday, November 22nd, 2019
  • Selected grab samples from new gold showing north of the Thurber Dog gold occurrence show assays between 1.67 and 8.26 g/t Au
  • Extends potential strike length of gold mineralization by approximately 500 metres along strike to the north 
  • Occurs within a larger 3km trend of anomalous gold in rock and soil associated with the contact between mafic/ultramafic volcanic rocks and felsic volcanic rocks

Labrador Gold Corp. (TSX-V: LAB) (“Labrador Gold” or the “Company”) is pleased to announce results of rock sampling at its Hopedale project in Labrador.

The Company controls a 57-kilometre strike length of stratigraphy prospective for gold in the Florence Lake Greenstone Belt (FLGB). To date, the Company has defined eight high potential areas for gold within the belt. The 2019 exploration program was designed to generate drill targets within these areas using detailed geological mapping, rock sampling and prospecting and ground magnetics/VLF-EM (very low frequency electromagnetics).

Sampling of the prospective areas resulted in 201 rock samples with gold values ranging from below the detection limit of 5 parts per billion (ppb) to 8.26 grams per tonne (g/t) in selected grab samples. The highest gold values were from three samples taken at the site of a new mineralized showing discovered shortly after the start of field work (see News Release dated July 26, 2019). The showing is located approximately 500 metres north, and along strike of, the Thurber Dog gold occurrence where previous Labrador Gold rock sampling returned values up to 7.87 g/t Au. Mineralization is comprised of disseminated to semi-massive pyrite and arsenopyrite hosted by felsic metavolcanic rocks with pervasive iron oxide alteration. The three samples from the occurrence assayed 1.67 g/t Au, 2.83 g/t Au and 8.26 g/t Au.

Anomalous gold values were also found in samples from elsewhere in the targeted areas and range from 0.11 g/t Au to 0.6 g/t Au (See table below). To date the company has collected 12,510 soil samples, 414 lake sediment samples and 834 rock samples along the length of the greenstone belt.

“Our systematic approach to exploration of the Florence Lake belt continues to turn up anomalous gold values in areas of high potential.” said Roger Moss, President and Chief Executive Officer of Labrador Gold. “The Thurber Dog area stands out as the most consistently mineralized gold trend in the belt and we are still finding gold mineralization that fills in gaps along the three kilometre stretch of anomalous gold in both rock and soil. The discovery of the new gold showing this season is the latest addition to what is turning into a prolific trend.”

 Highlights of 2019 rock sample assays.


Sample IDEastingNorthingSample Type*Rock typeMineralizationAu (ppb)Area
17026766547816110696GrabQuartz veinPy, Apy8,263New Showing
17101486547786110691GrabFelsic volcanicPy, Apy1.672New Showing
17101496547816110696GrabFelsic volcanicPy, Apy2.831New Showing
17101406547456111249GrabChlorite schist602Thurber Trend
16954446546286112280GrabUltramafic volcanicPy114Thurber North
19954336546286112280GrabQuartz veinPy224Thurber North
17052306549966113663GrabMafic volcanicApy532Thurber Boundary
16912246476396100795GrabUltramafic volcanicApy, Py107Jasmine North
17026876480216098550GrabIron formationPy388Jasmine South
17057386470746095318GrabQuartz vein134Misery North
17026786449146091661GrabQuartz veinPy488Misery
17852706433386085835GrabMafic volcanicPy336Schist Lakes

*Note that grab samples are select samples and are not necessarily representative of gold mineralization found on the property. Abbreviations: Py pyrite; Apy Arsenopyrite.

All samples were shipped to the Bureau Veritas laboratory in Vancouver, BC, where they were crushed and split and a 500g sub sample pulverized to 200 mesh. Samples of 30g were analyzed for gold by fire assay with an atomic absorption finish and another 15g sample for 36 elements by ultratrace ICP-MS (inductively coupled plasma-mass spectrometry) following an aqua regia digestion. Over limit samples (greater than 10g/t Au) are re-assayed using fire assay with a gravimetric finish. In addition to the QA-QC conducted by the laboratory, the Company routinely submits blanks, field duplicates and certified reference standards with batches of samples to monitor the quality of the analyses.

Roger Moss, PhD., P.Geo., is the qualified person responsible for all technical information in this release.

About Labrador Gold:

Labrador Gold is a Canadian based mineral exploration company focused on the acquisition and exploration of prospective gold projects in the Americas. In 2017 Labrador Gold signed a Letter of Intent under which the Company has the option to acquire 100% of the 896 square kilometre (km2) Ashuanipi property in northwest Labrador and the Hopedale (458 km2) property in eastern Labrador.

The Hopedale property covers much of the Hunt River and Florence Lake greenstone belts that stretch over 80 km. The belts are typical of greenstone belts around the world but have been underexplored by comparison. Initial work by Labrador Gold during 2017 show gold anomalies in soils and lake sediments over a 3 kilometre section of the northern portion of the Florence Lake greenstone belt in the vicinity of the known Thurber Dog gold showing where grab samples assayed up to 7.8g/t gold. In addition, anomalous gold in soil and lake sediment samples occur over approximately 40 kilometres along the southern section of the greenstone belt (see news release dated January 25th 2018 for more details). Labrador Gold now controls approximately 57km strike length of the Florence Lake Greenstone Belt.

The Ashuanipi gold project is located just 35 km from the historical iron ore mining community of Schefferville, which is linked by rail to the port of Sept Iles, Quebec in the south. The claim blocks cover large lake sediment gold anomalies that, with the exception of local prospecting, have not seen a systematic modern day exploration program. Results of the 2017 reconnaissance exploration program following up the lake sediment anomalies show gold anomalies in soils and lake sediments over a 15 kilometre long by 2 to 6 kilometre wide north-south trend and over a 14 kilometre long by 2 to 4 kilometre wide east-west trend. The anomalies appear to be broadly associated with magnetic highs and do not show any correlation with specific rock types on a regional scale (see news release dated January 18th 2018). This suggests a possible structural control on the localization of the gold anomalies. Historical work 30 km north on the Quebec side led to gold intersections of up to 2.23 grams per tonne (g/t) Au over 19.55 metres (not true width) (Source: IOS Services Geoscientifiques, 2012, Exploration and geological reconnaissance work in the Goodwood River Area, Sheffor Project, Summer Field Season 2011). Gold in both areas appears to be associated with similar rock types.

The Company has 57,039,022 common shares issued and outstanding and trades on the TSX Venture Exchange under the symbol LAB.

For more information please contact:             

Roger Moss, President and CEO      Tel: 416-704-8291

Or visit our website at: www.labradorgold.com

Twitter: @LabGoldCorp

CLIENT FEATURE: Labrador Gold $LAB.ca: Sean Ryan Looking to Repeat Discovery Process with Labrador Gold $RIO.ca $WHM.ca $SIC.ca $NXS.ca

Posted by AGORACOM at 10:48 AM on Wednesday, November 20th, 2019
http://www.smallcapepicenter.com/LAB%20square.png
  • Labrador Gold is aggressively pursuing the under explored gold potential of Labrador.
  • 2 large, separate, under-explored land packages that demonstrate potential for district scale gold discoveries.
  • Two successful gold explorers lead the way in the Labrador gold rush: Shawn Ryan and Roger Moss.
  • 2 Key Exploration Properties: Hopedale and Ashuanipi

Hopedale:

The Hopedale property covers much of the Hunt River and Florence Lake greenstone belts that stretch over 80 km. The belts are typical of greenstone belts around the world but have been underexplored by comparison. Initial work by Labrador Gold during 2017 show gold anomalies in soils and lake sediments over a 3 kilometre section of the northern portion of the Florence Lake greenstone belt in the vicinity of the known Thurber Dog gold showing where grab samples assayed up to 7.8g/t gold. In addition, anomalous gold in soil and lake sediment samples occur over approximately 40 kilometres along the southern section of the greenstone belt (see news release dated January 25th 2018 for more details). Labrador Gold now controls approximately 57km strike length of the Florence Lake Greenstone Belt.

Ashuanipi:

  • Two district scale gold anomalies outlined by soil and lake sediment survey: 15x3km north south anomaly and a 14 x 3km east west anomaly
  • 2018 Soil Sampling identified: 164 samples with over 50 ppb gold, 67 samples over 100 ppb (0.1g/t) gold and a high of 8,973 ppb (8.97 g/t) Au

The Ashuanipi gold project is located just 35 km from the historical iron ore mining community of Schefferville, which is linked by rail to the port of Sept Iles, Quebec in the south. The claim blocks cover large lake sediment gold anomalies that, with the exception of local prospecting, have not seen a systematic modern day exploration program. Results of the 2017 reconnaissance exploration program following up the lake sediment anomalies show gold anomalies in soils and lake sediments over a 15 kilometre long by 2 to 6 kilometre wide north-south trend and over a 14 kilometre long by 2 to 4 kilometre wide east-west trend. The anomalies appear to be broadly associated with magnetic highs and do not show any correlation with specific rock types on a regional scale (see news release dated January 18th 2018). This suggests a possible structural control on the localization of the gold anomalies.

LAB Agoracom Hub

FULL DISCLOSURE: Labrador Gold is an advertising client of AGORA Internet Relations Corp.

Labrador Gold $LAB.ca – Gold Prices to Pick off U.S. Dollar High Next $RIO.ca $WHM.ca $SIC.ca $NXS.ca

Posted by AGORACOM at 2:44 PM on Wednesday, September 4th, 2019

SPONSOR: Labrador Gold – Two successful gold explorers lead the way in the Labrador gold rush targeting the under-explored gold potential of the province. Exploration has already outlined district scale gold on two projects, including over a 40km strike length of the Florence Lake greenstone belt, one of two greenstone belts covered by the Hopedale Project. Click Here for More Info

https://www.kitco.com/news/2019-09-04/images/shutterstock_1265325577-min.jpg
  • Gold hit new all-time highs in multiple currencies
  • U.S. gold price has yet to follow, but has hit six-year highs
  • After five years of price consolidation, there is an “unprecedented” foundation for higher gold and silver prices

After hitting new record highs in euros and British pounds, U.S. dollar-based record highs are next, according to Bloomberg Intelligence (BI).

Gold prices had a stellar August, with the metal hitting new all-time highs in multiple currencies as well as reaching fresh six-year highs in U.S. dollars.

“Dollar-denominated gold is likely to follow all-time highs in euro terms reached Aug. 26 … Despite the trade-weighted broad dollar rallying about 10% since the start of 2018, dollar-valued gold has increased 15%. Trade tension and diminishing macroeconomic conditions have been drivers, but increasing stock-market volatility is a primary gold-price support,” BI senior commodity strategist Mike McGlone wrote in a September update.

Precious metals are on a very solid footing and are likely just beginning their upward ascension, McGlone wrote this week.

“We expect precious metals to remain the stalwart sector, as moribund silver and platinum gain buoyancy with the rising gold- and bond-price tide. A catalyst to reverse the entrenched trends, namely a definitive U.S.-China trade accord, is unlikely,” he said.

After five years of price consolidation, there is an “unprecedented” foundation for higher gold and silver prices, McGlone pointed out.

“Markets are in the early days of acknowledging the potential upside in primary store-of-value, quasi-currency, diversifier assets gold and silver, in our view. Plunging and increasingly negative bond yields, central-bank easing, trade and currency wars, elevated debt-to-GDP levels and a contentious U.S. presidential relationship with the Federal Reserve are price tailwinds,” he explained.

The biggest threat to the precious metals’ new bull market is a drop in stock-market volatility, which is looking unlikely at this point, BI’s report noted.

“The dollar price of gold is on far more stable ground than it was about a decade ago. Some combination of sustained greenback strength and rapid stock-market appreciation should be necessary to suppress the metal’s price … Bottoming with the Federal Reserve’s interest-rate hike in 2015, the gold price appears to be situated for brighter days,” McGlone said.

Source: https://www.kitco.com/news/2019-09-04/Gold-prices-to-pick-off-U-S-dollar-high-next-Bloomberg-Intelligence.html

Labrador Gold $LAB.CA Provides Exploration Update for Its Ashuanipi Project $RIO.ca $WHM.ca $SIC.ca $NXS.ca

Posted by AGORACOM at 8:13 AM on Tuesday, September 3rd, 2019

VANCOUVER, British Columbia, Sept. 03, 2019 – Labrador Gold Corp. (TSX-V: LAB) (“Labrador Gold” or the “Company”) announces that it has received a request to stop further exploration at its Ashuanipi project in western Labrador. The request was received following the start of the Company’s exploration program and subsequent discussions with members of the Matimekush-Lac John First Nation in Schefferville, Quebec. Labrador Gold holds, under option, a number of mineral licenses in western Labrador, south east of Schefferville that cover a portion of a trapline owned by some members of the Matimekush-Lac John First Nation and conducted exploration without incident during 2017 and 2018. 

“It is unfortunate that discussions to date have resulted in us having to stop work,” said Roger Moss, President and Chief Executive Officer of Labrador Gold. “However, we will respect their decision as we continue discussions with the aim of maximizing benefits for all stakeholders. The company is committed to maintaining good relationships with the community as we look to restart our exploration program at Ashuanipi.”

Labrador Gold will continue discussions to properly understand the concerns of the Matimekush-Lac John First Nation and to seek ways in which we can work with the community in order that our low-impact exploration does not interfere with their traditional activities.

The Company is also reviewing the Hopedale, Labrador and Borden Lake Extension, Ontario projects with the aim of conducting further exploration on one or both of the projects during the remainder of the field season.

Roger Moss, PhD., P.Geo., is the qualified person responsible for all technical information in this release.

The Company gratefully acknowledges the Newfoundland and Labrador Ministry of Natural Resources’ Junior Exploration Assistance (JEA) Program for its financial support for exploration of the Ashuanipi property.

About Labrador Gold:

Labrador Gold is a Canadian based mineral exploration company focused on the acquisition and exploration of prospective gold projects in the Americas. In 2017 Labrador Gold signed a Letter of Intent under which the Company has the option to acquire 100% of the 896 square kilometre (km2) Ashuanipi property in northwest Labrador and the Hopedale (458 km2) property in eastern Labrador.

The Hopedale property covers much of the Hunt River and Florence Lake greenstone belts that stretch over 80 km. The belts are typical of greenstone belts around the world but have been underexplored by comparison. Initial work by Labrador Gold during 2017 show gold anomalies in soils and lake sediments over a 3 kilometre section of the northern portion of the Florence Lake greenstone belt in the vicinity of the known Thurber Dog gold showing where grab samples assayed up to 7.8g/t gold. In addition, anomalous gold in soil and lake sediment samples occur over approximately 40 kilometres along the southern section of the greenstone belt (see news release dated January 25th 2018 for more details). Labrador Gold now controls approximately 57km strike length of the Florence Lake Greenstone Belt.

The Ashuanipi gold project is located just 35 km from the historical iron ore mining community of Schefferville, which is linked by rail to the port of Sept Iles, Quebec in the south. The claim blocks cover large lake sediment gold anomalies that, with the exception of local prospecting, have not seen a systematic modern day exploration program. Results of the 2017 reconnaissance exploration program following up the lake sediment anomalies show gold anomalies in soils and lake sediments over a 15 kilometre long by 2 to 6 kilometre wide north-south trend and over a 14 kilometre long by 2 to 4 kilometre wide east-west trend. The anomalies appear to be broadly associated with magnetic highs and do not show any correlation with specific rock types on a regional scale (see news release dated January 18th 2018). This suggests a possible structural control on the localization of the gold anomalies. Historical work 30 km north on the Quebec side led to gold intersections of up to 2.23 grams per tonne (g/t) Au over 19.55 metres (not true width) (Source: IOS Services Geoscientifiques, 2012, Exploration and geological reconnaissance work in the Goodwood River Area, Sheffor Project, Summer Field Season 2011). Gold in both areas appears to be associated with similar rock types.

The Company has 56,264,022 common shares issued and outstanding and trades on the TSX Venture Exchange under the symbol LAB.

For more information please contact:

Roger Moss, President and CEO      Tel: 416-704-8291

Or visit our website at: www.labradorgold.com

CLIENT FEATURE: Labrador Gold $LAB.ca Discovers Gold Enriched Zone at Ashuanipi $RIO.ca $WHM.ca $SIC.ca $NXS.ca

Posted by AGORACOM at 10:57 AM on Friday, August 23rd, 2019
  • Discovery of gold enriched zone near high grade (8,973ppb) soil sample at Ashuanipi, Labrador
  • Defined by gold in soil and rock samples that cover an area of 450 metres by 450 metres
  • Results of ground VLF-Magnetic survey over the area are pending
  • Drill testing of zone expected in fall
  • Systematic approach to exploration of district scale anomalies at Ashuanipi allowed LAB to quickly identify favourable areas for gold mineralization
  • Two successful gold explorers lead the Labrador gold rush: Shawn Ryan and Roger Moss.

Ashuanipi

The Ashuanipi gold project is located just 35 km from the historical iron ore mining community of Schefferville, which is linked by rail to the port of Sept Iles, Quebec in the south. The claim blocks cover large lake sediment gold anomalies that, with the exception of local prospecting, have not seen a systematic modern day exploration program. Results of the 2017 reconnaissance exploration program following up the lake sediment anomalies show gold anomalies in soils and lake sediments over a 15 kilometre long by 2 to 6 kilometre wide north-south trend and over a 14 kilometre long by 2 to 4 kilometre wide east-west trend. The anomalies appear to be broadly associated with magnetic highs and do not show any correlation with specific rock types on a regional scale (see news release dated January 18th 2018). This suggests a possible structural control on the localization of the gold anomalies

LAB Agoracom Hub

FULL DISCLOSURE: Labrador Gold is an advertising client of AGORA Internet Relations Corp

Labrador Gold $LAB.ca Announces Delineation of a Gold Enriched Zone at Its Ashuanipi Project $RIO.ca $WHM.ca $SIC.ca $NXS.ca

Posted by AGORACOM at 12:30 PM on Wednesday, August 21st, 2019
  • Discovery of gold enriched zone near high grade (8,973ppb) soil sample at Ashuanipi, Labrador
  • Defined by gold in soil and rock samples that cover an area of 450 metres by 450 metres
  • Results of ground VLF-Magnetic survey over the area are pending
  • Drill testing of zone expected in fall

VANCOUVER, British Columbia, Aug. 21, 2019 (GLOBE NEWSWIRE) — Labrador Gold Corp. (TSX-V: LAB) (“Labrador Gold” or the “Company”) is pleased to announce that it has delineated a new gold enriched zone near the site of a high grade soil sample at its Ashuanipi project in western Labrador.

The initial program at Ashuanipi this year continued our systematic approach of detailed geological mapping, rock and soil sampling and ground magnetics/VLF-EM (very low frequency electromagnetics) to follow up on specific areas to generate targets for drilling in the fall. In particular, infill soil sampling allowed us to define an anomalous gold zone near the site of a soil sample taken in 2018 that assayed 8,973ppb gold.

The anomalous zone measures approximately 450 metres by 450 metres and is defined by soil samples ranging from below detection up to 1,190ppb gold, in addition to the previous high-grade sample, and rock samples from below detection up to 2,353 ppb Au (2.35g/t). The 2.35g/t rock sample lies approximately 450m northwest of the high-grade soil sample within a 200m by 100m gold in soil anomaly with values ranging from 40ppb to 778ppb gold. The area was also covered by a ground magnetic and VLF-EM (Very low frequency electromagnetic) survey, the data from which is currently being processed.

A second area also shows potential, with rock samples grading from below detection to 0.68g/t gold and 10 samples showing values greater than 0.1g/t gold over an area of 200m by 120m within a larger anomalous area of gold in soil. The gold mineralization is associated with garnet-bearing gossanous gneiss. Further work in the area, including detailed soil sampling and a VLF-magnetic survey will enable better definition of the anomalous zone. Maps of the two zones can be found at www.labradorgold.com/portfolio/ashuanipi/.

“Our systematic approach to exploration of district scale anomalies at Ashuanipi has allowed us to quickly identify favourable areas for gold mineralization along these trends,” said Roger Moss, President and Chief Executive Officer of Labrador Gold. “We look forward to the results of the magnetic – VLF-EM survey that will allow us to further refine our drill targets for the fall.”

The 2019 exploration program at Ashuanipi is designed to follow up on successful results of 2017 and 2018 work that outlined district scale gold anomalies. To date the company has collected 13,184 soil samples, 752 lake sediment samples and 138 rock samples over the 896 square kilometre property.

“Our 2019 program confirms and reinforces the thought that the large regional (20 by 25 km) gold in lake sediment anomaly (greater than the 99th percentile) covering the Ashuanipi north claim block is real.  The anomaly, derived from GSC data (Open File 8348), is the largest and most robust in the entire northern Quebec and Labrador,” said Shawn Ryan, Technical Advisor to Labrador Gold. “We are the first exploration company to give this anomaly a good look and start to explain this new mineralized system. As we continue our systematic exploration approach over the property, we should uncover more gold mineralization over the 15-kilometre gold in soil anomaly outlined during the 2018 exploration program.”

All samples were shipped to the Bureau Veritas preparation laboratory in Timmins, Ontario, where rocks were crushed and split and a 500g sub sample pulverized to 200 mesh. Pulps were sent to the Vancouver laboratory for assay. Samples of 30g were analyzed for gold by fire assay with an atomic absorption finish and another 15g sample for 36 elements by ultratrace ICP-MS (inductively coupled plasma-mass spectrometry) following an aqua regia digestion. Soil samples are dried and sieved to -80 mesh followed by aqua regia digestion and ICP-MS/ES assay. In addition to the QA-QC conducted by the laboratory, the Company routinely submits blanks, field duplicates and certified reference standards with batches of samples to monitor the quality of the analyses.

Roger Moss, PhD., P.Geo., is the qualified person responsible for all technical information in this release.

About Labrador Gold:

Labrador Gold is a Canadian based mineral exploration company focused on the acquisition and exploration of prospective gold projects in the Americas. In 2017 Labrador Gold signed a Letter of Intent under which the Company has the option to acquire 100% of the 896 square kilometre (km2) Ashuanipi property in northwest Labrador and the Hopedale (458 km2) property in eastern Labrador.

The Hopedale property covers much of the Hunt River and Florence Lake greenstone belts that stretch over 80 km. The belts are typical of greenstone belts around the world but have been underexplored by comparison. Initial work by Labrador Gold during 2017 show gold anomalies in soils and lake sediments over a 3 kilometre section of the northern portion of the Florence Lake greenstone belt in the vicinity of the known Thurber Dog gold showing where grab samples assayed up to 7.8g/t gold. In addition, anomalous gold in soil and lake sediment samples occur over approximately 40 kilometres along the southern section of the greenstone belt (see news release dated January 25th 2018 for more details). Labrador Gold now controls approximately 57km strike length of the Florence Lake Greenstone Belt.

The Ashuanipi gold project is located just 35 km from the historical iron ore mining community of Schefferville, which is linked by rail to the port of Sept Iles, Quebec in the south. The claim blocks cover large lake sediment gold anomalies that, with the exception of local prospecting, have not seen a systematic modern day exploration program. Results of the 2017 reconnaissance exploration program following up the lake sediment anomalies show gold anomalies in soils and lake sediments over a 15 kilometre long by 2 to 6 kilometre wide north-south trend and over a 14 kilometre long by 2 to 4 kilometre wide east-west trend. The anomalies appear to be broadly associated with magnetic highs and do not show any correlation with specific rock types on a regional scale (see news release dated January 18th 2018). This suggests a possible structural control on the localization of the gold anomalies. Historical work 30 km north on the Quebec side led to gold intersections of up to 2.23 grams per tonne (g/t) Au over 19.55 metres (not true width) (Source: IOS Services Geoscientifiques, 2012, Exploration and geological reconnaissance work in the Goodwood River Area, Sheffor Project, Summer Field Season 2011). Gold in both areas appears to be associated with similar rock types.

The Company has 56,264,022 common shares issued and outstanding and trades on the TSX Venture Exchange under the symbol LAB.

For more information please contact:             

Roger Moss, President and CEO      Tel: 416-704-8291

Or visit our website at: www.labradorgold.com

@LabGoldCorp

Labrador Gold $LAB.ca – #Gold Responds to the Trade and Currency War $RIO.ca $WHM.ca $SIC.ca $NXS.ca

Posted by AGORACOM at 8:59 AM on Tuesday, August 13th, 2019

SPONSOR: Labrador Gold – Two successful gold explorers lead the way in the Labrador gold rush targeting the under-explored gold potential of the province. Exploration has already outlined district scale gold on two projects, including over a 40km strike length of the Florence Lake greenstone belt, one of two greenstone belts covered by the Hopedale Project. Click Here for More Info

  • At all-time highs in six of the world’s top currencies
  • Gold is up 25% in sterling; 22% in the yuan; 21.5% in euros; 19.7% in Australian dollars; 18% in rupee; 13% in Canadian dollars and 12% in Japanese yen

The charts posted immediately below tell one of the quiet, but perhaps most important stories unfolding in the world of high international finance. Gold has appreciated sharply in the currencies of all of the world’s top economies.  In five of the top eight economies – the United Kingdom, Japan, Canada, Australia, and India – it is priced at all-time highs. In short, as currencies race for the bottom, gold is racing to the top. Investors everywhere are moving to insulate their portfolios against the combined threats of recession, plummeting yields, currency depreciation, and stock market instability. An over-arching nemesis not likely to relinquish its place any time soon has unleashed those four horsemen – the burgeoning trade and currency war. 

Gold is up 25% in sterling; 22% in the yuan; 21.5% in euros; 19.7% in Australian dollars; 18% in rupee; 13% in Canadian dollars and 12% in Japanese yen.  It is up sharply against a long list of emerging country currencies as well. By way of perspective, gold is up 16% in U.S. dollars thus far in 2019. “A host of global factors mean gold’s price is set to maintain its strength at least for the next six to 12 months,” said Howie Lee, an economist at Singapore’s Oversea-Chinese Banking Corporation, in a recent CNBC interview. “The world right now is in a precarious state and gold is due to benefit from this situation,” With the world – from Asia to Europe, the United States and a long list of emerging countries – now acutely attuned to gold ownership, it might not be long until we begin to see strains on the limited physical supplies. 

Source: https://www.usagold.com/cpmforum/anv-august/