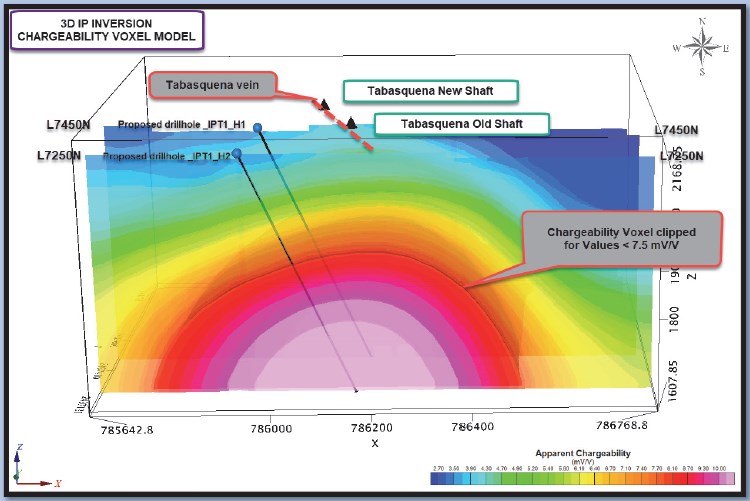
SPONSOR: Advance Gold AAX.v – Advance Gold controls 100% interest in the Tabasquena Silver Mine in Zacatecas, Mexico. A cluster of 30 Epithermal veins have been discovered, with recent emphasis on exploring a large anomaly to drill. Advance also owns 15% of the Kakamega JV attached to Barrick Takeover Offer for Acacia Mining. Click Here For More Info
- Fears of a Trans-Atlantic trade war have increased gold’s safety bid.
- U.S. economic data also continues to attract safety seekers to gold.
- All signs point to a continuation of the metal’s bull market in Q4.
After a brief respite last month, fear and uncertainty have returned with a vengeance in October. Recent world events have given investors plenty of reasons to fear an expansion of the global trade war.
Meanwhile on the domestic front, investors are becoming increasingly alarmed by soft economic data which some interpret as a harbinger of recession. Gold’s “fear factor†has thus been resuscitated, bringing with it the promise of stronger prices in the months ahead. Here we’ll discuss the growing number of variables which suggest gold is consolidating its recent gains ahead of the next stage of its long-term bull market.
One sign of a market controlled by the bulls is the steadfast refusal of prices, following a correction, to stay down for long. Bull markets have a tendency to consolidate gains achieved during extended rallies in the form of a lateral trading range, or sideways drift. That appears to be the form of gold’s most recent correction in September following a productive three-month rally.
Although gold prices briefly violated a key short-term trend line earlier this week, the bulls fought back fiercely and pushed prices back above the widely, followed 50-day moving average within two days of the violation. It may take several more days for gold to regain enough strength and build the support necessary to stay above the 50-day MA. But the signs are plainly evident that the bulls are clawing their way back to controlling gold’s immediate-term (1-4 week) trend.
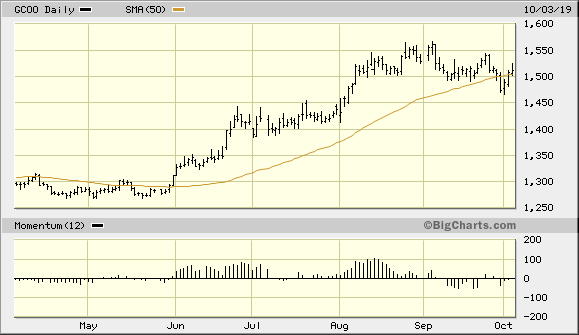
Source: BigCharts
And while gold prices haven’t kept pace with its nearest competitor in the rush to safety – namely U.S. Treasury bonds – it’s instructive that gold has so far responded favorably to most of the latest negative economic and political news. For instance, gold jumped nearly 1.5% on Oct. 2 after the release of the latest ADP National Employment Report. The report showed that private payroll growth by U.S. employers slowed in September and wasn’t as strong in August as previously estimated, according to a Reuters article. Reuters reporter Lucia Mutikani, capturing the sentiment which has overtaken many gold investors, observed:
The longest economic expansion on record, now in its 11th year, is losing ground with the blame largely put on a 15-month trade war between the United States and China, which has eroded business confidence.â€
It’s further believed by many investors that the growing signs of a slowing U.S. economy could influence the Federal Reserve to further lower its benchmark interest rate this fall. Lower rates are widely regarded as bullish for gold since it reduces the competition vs. interest-bearing assets for the non-yielding metal.
Elsewhere on the U.S. economic front, the recent disappointments in the Purchasing Managers’ Index (PMI) is another reason for the revival of gold’s fear factor. The PMI has now fallen for seven consecutive months and is below 50.0, which indicates contraction in the manufacturing sector.
The latest disappointing PMI readings also have weighed heavily on the U.S. dollar index (DXY) of late. The dollar fell to one-week lows against the euro and yen on Oct. 3. However, the dollar index is still close to a multi-year high, which means that gold doesn’t yet enjoy support from its currency component (see chart below). Nonetheless, gold has proven to be stalwart enough this year under the influence of the fear factor alone and in spite of a strong dollar. Thus, a weaker dollar isn’t necessarily a prerequisite for a Q4 gold rally.
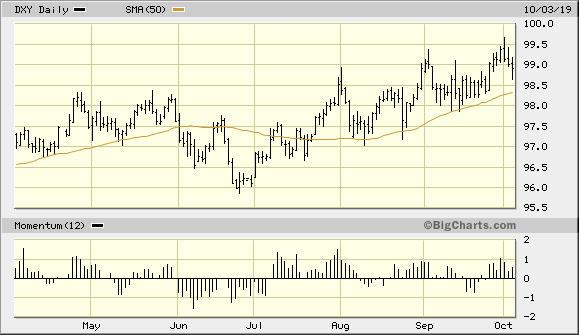
Source: BigCharts
Aside from a weakening manufacturing sector, the U.S. service sector also is showing signs of slowing. The latest ISM survey released on Oct. 3 showed service-sector activity for September fell to its lowest level in three years. Some analysts blamed the U.S.-China trade dispute for the slowdown. The latest ISM Non-Manufacturing Index fell to 52.6 last month as new orders fell more than expected. This disappointed economists’ expectations of 55.3. This increased gold’s allure as a safe haven in the eyes of many investors and should provide some underlying support for the metal going forward.
In yet another development which bolsters gold’s safety bid, the U.S. won approval on Oct. 2 from the World Trade Organization to levy tariffs on $7.5 billion worth of European goods. The WTO’s decision relates to illegal subsided given to Airbus (EASDF) and Boeing (NYSE:BA). Consequently, many investors fear the outbreak of yet another front in the ongoing global trade war.
In view of the above-mentioned factors, gold’s intermediate-term (3-6 month) upward trend looks secure. The only thing standing in the way of a renewed immediate-term gold buy signal, however, is confirming strength in gold’s sister metal. Silver remains below its 15-day moving average, as can be seen in the iShares Silver Trust (ETF) below. As I mentioned in a previous report, we need to see silver confirm gold’s returning strength before we get a confirmed re-entry signal. A lack of confirmation from silver normally means that gold’s rally will fail due to the lack of institutional demand. Historically, when market-moving institutional investors are bullish enough to buy gold, they usually buy silver as an adjunct.
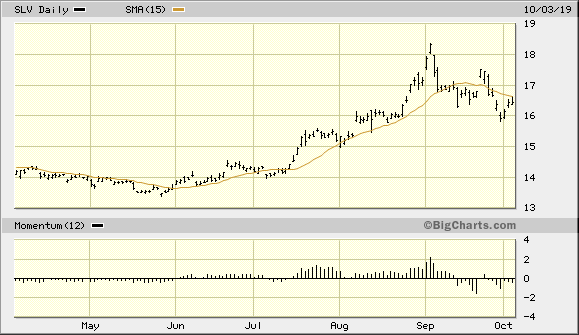
Source: BigCharts
Another sign that should accompany gold’s next confirmed breakout is a return to strength in the actively traded U.S. mining shares. Shown below is the PHLX Gold/Silver Index (XAU), which remains below its 15-day moving average as of Oct. 3. To get a renewed buy signal for gold stocks in the aggregate, we should see a two-day higher close above the 15-day in the XAU. Moreover, a gold stock rally tends to accompany a rally in bullion prices due to the leverage factor of the miners, which attracts precious metals investors.
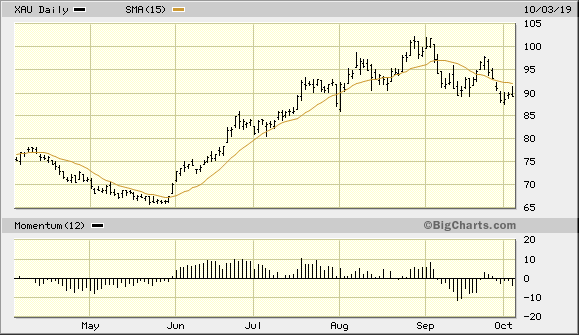
Source: BigCharts
In summary, a growing number of worries on the U.S. economic and global trade fronts has provided gold with a renewed safety bid. The evidence reviewed here suggests that gold prices are consolidating ahead of another breakout attempt this fall. Confirming strength in the silver price would increase gold’s bullish prospects in Q4, as would a breakout in the leading gold mining stocks. With trade war threats on the rise, however, gold is poised to benefit from safe-haven demand and keep its bull market intact. Investors are therefore justified in maintaining longer-term investment positions in the yellow metal.
On a strategic note, I’m waiting for both the gold price and the gold mining stocks to confirm a breakout before initiating a new trading position in the VanEck Vectors Gold Miners ETF (GDX), my preferred trading vehicle for the mining stocks. I’m currently in a cash position in my short-term trading portfolio
SOURCE: https://seekingalpha.com/article/4295225-gold-prepares-next-phase-bull-market