Posted by AGORACOM-JC
at 1:12 PM on Thursday, January 23rd, 2020
SPONSOR: Datametrex AI Limited
(TSX-V: DM) A revenue generating small cap A.I. company that NATO and
Canadian Defence are using to fight fake news & social media
threats. The company announced three $1M contacts in Q3-2019. Click here for more info.
BBC partnered with Google and Facebook on general election fake news
The BBC partnered with Google (GOOGL), Microsoft (MSFT), Facebook (FB), and other news outlets to stymie the spread of fake news during December’s UK general election, its director-general Tony Hall said on Thursday.
Hall said that the BBC had been working “collaboratively†with the
Wall Street Journal, the Financial Times, India’s Hindu newspaper on a
partnership with Microsoft and Google to identify misinformation, as
part of a previously announced initiative.
But Hall said on Thursday for the first time that it had been used prior to last month’s UK vote.
The BBC in September announced that it was working with the
technology companies to develop an early warning system to use during
elections or when lives may be at risk, calling the move a “crucialâ€
step to fight disinformation.
The plan also includes media education, voter information plans, and shared learning initiatives.
The initiative works to de-emphasise stories that are just “plain
wrong,†Hall said, speaking during a panel discussion at the World
Economic Forum in Davos.
“We’ve tried this out on paper exercises, but we tried it for real
… in the UK election, and it worked. That combination and contact
between media that people trust and Google, Facebook, and whatever. It
worked. And we took down some stuff which was just plain wrong — in
copyright terms, but just wrong.â€
“By the way, we haven’t talked about this anywhere yet, but why not here?â€
Neither the BBC nor Google immediately responded to a request for
more information about how the initiative was used in the general
election.
Earlier in the talk, Hall noted that the BBC was still the most trusted source of news in the UK.
“For us, for the BBC, people still trust us more than any other form of media in the UK. Globally, trust is very very high.â€
“And why do people use us? They may use three, four, five sources of
news each day, but they come to us because they want to check whether [a
story] is right,” he said.
Posted by AGORACOM-JC
at 11:30 AM on Thursday, January 23rd, 2020
SPONSOR: BetterU Education Corp.
aims to provide access to quality education from around the world.
The company plans to bridge the prevailing gap in the education and job
industry and enhance the lives of its prospective learners by developing
an integrated ecosystem. Click here for more information.
Edtech Startup Eupheus Learning Raises $4.3 Mn To Scale Operations
The funds will be used to increase nationwide presence, develop new product offerings etc
It will also start its operations in the Middle East
The company claims that in H1 FY20, it recorded a 3x increase in revenues
New Delhi-based edtech startup Eupheus Learning, on Thursday (January
23), announced that it has raised $4.3 Mn (INR 30 Cr) in its Series A
funding round. The investment is a mix of equity and venture debt, which
was led by Yuj Ventures.
Other investors in the round included Sixth Sense Ventures.
The funds will be used to increase nationwide presence, develop new
product offerings, and expand the team. The company said it will also
start its operations in the Middle East and drive international
expansion in other markets.
Eupheus Learning was founded in 2017 by Sarvesh Shrivastava, Rohit
Dhar, Ved Prakash Khatri, and Amit Kapoor. Operating across the Pre-K to
Class XII segments, Eupheus offers products in all subject areas and
packages both the curriculum and homework tracking tools in phygital
form.
Sarvesh Shrivastava, managing director of Eupheus Learning said, “The
online education segment in India is primed for massive growth, as the
next generation of children enter classrooms across the country. By
leveraging the power of technology, we’ve been able to bridge the divide
between in-school and at-home learning and offer a seamless, end-to-end
learning experience.â€
The company claims that in H1 FY20, it recorded a 3x increase in
revenues compared to the same period last year. It also said that it
expanded its geographical presence to 70 cities in India from 52
earlier. The team has also grown to 175 employees as it has also forged
new alliances with four international education players, taking its
roster of global partnerships to 17.
“We are impressed by the founders’ experience, the previous track
record of developing cutting edge content at Britannica, and the manner
in which they have scaled Eupheus in a profitable manner in the last two
years in a competitive market,†said Madhav Soi of Yuj Ventures.
Digital evolution and the boom in smartphone adoption are expected to
define the way Indian students learn. Real-time book updates, online
tutoring, edutainment, online test preparation, web-based research, and
gamification — technology has changed our traditional education system
in more ways than one.
Posted by AGORACOM-JC
at 10:51 AM on Thursday, January 23rd, 2020
SPONSOR:ThreeD Capital Inc. (IDK:CSE)
Led by legendary financier, Sheldon Inwentash, ThreeD is a
Canadian-based venture capital firm that only invests in best of breed
small-cap companies which are both defensible and mass scalable. More
than just lip service, Inwentash has financed many of Canada’s biggest
small-cap exits. Click Here For More Information.
BTC/USD is currently trading at $8,650 (+0.40%) in the afternoon in U.S. hours, the range continues to tighten, ahead of next explosive breakout. Â
ETH/USD is currently trading at $168.25 (+0.30%), there is a lack of committed direction for now following the big pump last week. Â
XRP/USD is
currently trading at $0.2360 (+1.30%), price action remains very much
narrow. The range to the upside of $0.2500 to the downside $0.2300.
Among the 100 most important cryptocurrencies, the best of the day
are GNT $0.043133 (+28.95%), KMD $0.712816 (+15.49%) and SXP $1.72
(+11.27%) and The day’s losers are BCN $0.000272 (-12.50%), CENNZ
$0.55991 (-11.49%) and BCD $0.588775 (-4.30%).
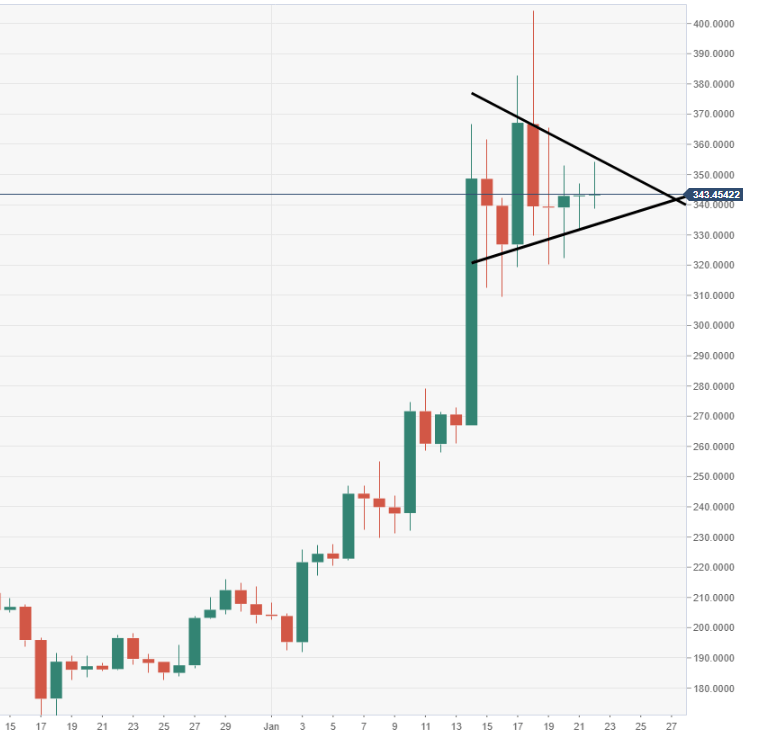
Chart of the day: BCH/USD weekly chart (price action moving within a bullish pennant pattern)
Market
Vitalik Buterin believes that Ethereum Classic can be merged into
Ethereum 2.0 in the same way as a new shard-like ETH’s current Proof of
Work (PoW) chain will be integrated.
Blockchain payments processor BitPay has added support for XRP, the world’s third-largest cryptocurrency by market capitalization. XRP has been integrated on BitPay’s platform via Ripple’s open developer platform, Xpring.
Regulation
The Organization for Economic Cooperation and Development (OECD), has
created a Blockchain Expert Policy Advisory Board (BEPAB) to make it
easier for governments and other stakeholders to tap the benefits of
distributed ledger technology (DLT). BEPAB is made up of several heavy
hitters in the blockchain space, including IBM, R3, and ConsenSys.
Industry
British telecom giant Vodafone has become the latest member to leave the Libra Association.
The original consortium of 28 members supporting Facebook’s ambitious
digital currency project has only left with 20 participants.
Huobi Group has announced the launch of Huobi Brokerage, a digital
asset brokerage platform, during the annual Davos forum. As the global
blockchain company’s first brokerage solution, Huobi Brokerage will
provide digital asset trading products and services to institutional
clients and high-net-worth individuals (HNWIs).
Binance has announced the launch of its Peer-to-Peer (P2P) Merchant
Program. The P2P program will allow merchants to provide fiat currency
payment solutions to people around the world and earn revenue, according
to a blog post.
The Blockchain Association has filed an amicus curiae brief in
response to litigation against Telegram initiated by the United States
Securities and Exchange Commission (SEC).
The Blockchain Association, a collective of advocates involved with
the blockchain industry, filed an amicus curiae brief with the court of
the Southern District of New York on Jan. 21.
According to a former executive from the Bank of Japan, who made a
statement on Wednesday, major central banks started to set up study
groups into crypto shortly after Facebook’s threat was made clear.
Quote of the day
The biggest barrier to Bitcoin adoption is the lack of understanding about what money is and how it works.
Posted by AGORACOM-JC
at 8:45 AM on Thursday, January 23rd, 2020
Engaged IBK Capital Corp. to manage a private placement financing of up to C$2,000,000 by way of units of the Company at a price of $0.05 per Unit
Each Unit consists of one common share and one share purchase warrant, where each Warrant entitles the holder to purchase one additional common share at a price of $0.10 per share for a period of two (2) years from the date of closing.
January 23rd, 2020 – Rockport, ON, Canada – New Age Metals Inc. (TSXV:NAM); (OTC:NMTLF); (FSE:P7J) has engaged IBK Capital Corp. to manage a private placement financing of up to C$2,000,000 by way of units (“Units”) of the Company at a price of $0.05 per Unit. Each Unit consists of one common share and one share purchase warrant (“Warrant”), where each Warrant entitles the holder to purchase one additional common share at a price of $0.10 per share for a period of two (2) years from the date of closing. This financing is fully subscribed and is anticipated to close on Friday January 31, 2020.
The securities to be issued in
connection with the private placement will be subject to a four-month
plus one-day hold period from the date of closing in accordance with
applicable Canadian Securities Laws. Completion of the private placement
and any finder’s fees payable are subject to regulatory approval.
Harry Barr, Chairman and Chief
Executive Officer of New Age Metals, reports: “This year’s palladium
price increase to more than US$2,400 per ounce or C$3,100 highlights the
potential of our River Valley PGM project as one of the largest
undeveloped primary palladium projects in North America.”
Michael White, Chief Executive
Officer of IBK Capital Corp., states, “We believe there will be a
positive rerating of the market value of palladium exploration
companies. This would reflect the increasing value of the metal in the
ground due to strong palladium prices based on a lack of stable supply
from South Africa. We also believe the PGM producers of the world will
need to acquire ounces in the ground in favourable jurisdictions to
replace and geographically diversify their PGM reserves.”
Use of Proceeds
The Company intends to use the
proceeds of this private placement to complete certain recommendations
from the recent PEA completed on the company’s River Valley Project; one
of North America’s largest undeveloped primary Platinum Group Metals,
(PGM) Projects. Additionally, proceeds will be used to build global
investor awareness in NAM, and for working capital purposes.
The River Valley PGM Project is 100%
owned by New Age Metals and located in the Sudbury Mining District, 100
kms away from the Sudbury Metallurgical Complex.
About NAM
New Age
Metals is a junior mineral exploration and development company focused
on the discovery, exploration and development of green metal projects in
North America. The Company has two divisions; a Platinum
Group Metals division and a Lithium/Rare Element division. The PGM
division includes the 100% owned River Valley Project, one of North
America’s largest undeveloped Platinum Group Metals Projects, situated
100 kilometers from Sudbury, Ontario as well as the Genesis PGM Project
in Alaska. The Lithium division is the largest mineral claim holder in
the Winnipeg River Pegmatite Field where the Company is exploring for
hard rock lithium and various rare elements such as tantalum and
rubidium. Our philosophy is to be a project generator with the objective
of optioning our projects with major and junior mining companies
through to production. New Age
Metals is a junior resource company on the TSX Venture Exchange, trading
symbol NAM, OTCQB: NMTLF; FSE: P7J with 96,843,766 shares issued to
date.
Investors
are invited to visit the New Age Metals website at www.newagemetals.com
where they can review the company and its corporate activities. Any
questions or comments can be directed to [email protected] or Harry Barr at [email protected] or Cody Hunt at [email protected] or call 613 659 2773.
On behalf of the Board of Directors
“Harry Barr”
Harry G. Barr, Chairman and CEO
Neither the TSX Venture Exchange nor
its Regulation Services Provider (as that term is defined in the
policies of the TSX Venture Exchange) accepts responsibility for the
adequacy or accuracy of this release. Cautionary Note Regarding Forward
Looking Statements: This release contains forward-looking statements
that involve risks and uncertainties. These statements may differ
materially from actual future events or results and are based on current
expectations or beliefs. For this purpose, statements of historical
fact may be deemed to be forward-looking statements. In addition,
forward-looking statements include statements in which the Company uses
words such as “continue”, “efforts”, “expect”, “believe”, “anticipate”,
“confident”, “intend”, “strategy”, “plan”, “will”, “estimate”,
“project”, “goal”, “target”, “prospects”, “optimistic” or similar
expressions. These statements by their nature involve risks and
uncertainties, and actual results may differ materially depending on a
variety of important factors, including, among others, the Company’s
ability and continuation of efforts to timely and completely make
available adequate current public information, additional or different
regulatory and legal requirements and restrictions that may be imposed,
and other factors as may be discussed in the documents filed by the
Company on SEDAR (www.sedar.com), including the most recent reports that
identify important risk factors that could cause actual results to
differ from those contained in the forward-looking statements. The
Company does not undertake any obligation to review or confirm analysts’
expectations or estimates or to release publicly any revisions to any
forward-looking statements to reflect events or circumstances after the
date hereof or to reflect the occurrence of unanticipated events.
Investors should not place undue reliance on forward-looking statements.
Posted by AGORACOM-JC
at 2:59 PM on Wednesday, January 22nd, 2020
SPONSOR: Datametrex AI Limited
(TSX-V: DM) A revenue generating small cap A.I. company that NATO and
Canadian Defence are using to fight fake news & social media
threats. The company announced three $1M contacts in Q3-2019. Click here for more info.
Building a Lie Detector for Images
A new paper from UC Berkeley and Adobe researchers declares war on fake images
Leveraging a custom dataset and fresh evaluation metric, the research team introduces a general image forensics approach that achieves high average precision in the detection of CNN-generated imagery
By: Synced
The Internet is full of fun fake images — from flying sharks and cows
on cars to a dizzying variety of celebrity mashups. Hyperrealistic
image and video fakes generated by convolutional neural networks (CNNs)
however are no laughing matter — in fact they can be downright
dangerous. Deepfake porn reared its ugly head in 2018, fake political
speeches by world leaders have cast doubt on news sources, and during
the recent Australian bushfires manipulated images mislead people
regarding the location and size of fires. Fake images and videos are
giving AI a black eye — but how can the machine learning community fight
back?
A new paper from UC Berkeley and Adobe researchers declares war on
fake images. Leveraging a custom dataset and fresh evaluation metric,
the research team introduces a general image forensics approach that
achieves high average precision in the detection of CNN-generated
imagery
Spotting such generated images may seem to be a
relatively simple task — just train a classifier using fake images
versus real images. In fact, the challenge is far more complicated for a
number of reasons. Fake images would likely be generated from different
datasets, which would incorporate different dataset biases. Fake
features are more difficult to detect when the training dataset of the
model differs from the dataset used to generate the fake image. Also,
network architectures and loss functions can quickly evolve beyond the
abilities of a fake image detection model. Finally, images may be
pre-processed or post-processed, which increases the difficulty in
identifying common features across a set of fake images.
To
address these and other issues, the researchers built a dataset of
CNN-based generation models spanning a variety of architectures,
datasets and loss functions. Real images were then pre-processed and an
equal number of fake images generated from each model — from GANs to
deepfakes. Due to its high variety, the resulting dataset minimizes
biases from either training datasets or model architectures.
The fake image detection model was built on ProGAN, an unconditional
GAN model for random image generation with simple CNN based structure,
and trained on the new dataset. Evaluated on various CNN image
generating methods, the model’s average precision was significantly
higher than the control groups.
Data augmentation is another approach the researchers used to improve
detection of fake images that had been post-processed after generation.
The training images (fake/real) underwent several additional
augmentation variants, from Gaussian blur to JPEG compression.
Researchers found that including data augmentation in the training set
significantly increased model robustness, especially when dealing with
post-processed images.
Researchers find the “fingerprint†of CNN-generated images.
The researchers note however that even the best detector will still
have trade-offs between true detection and false-positive rates, and it
is very likely a malicious user could simply handpick a simple fake
image that passes the detection threshold. Another concern is that the
post-processing effects added to fake images may increase detection
difficulty, since the fake image fingerprints might be distorted during
the post-processing. There are also many fake images that were not
generated but rather photoshopped, and the detector won’t work on images
produced through such shallow methods
The new study does a fine job of identifying the fingerprint of
images doctored with various CNN-based image synthesis methods. The
researchers however caution that this is one battle — the war on fake
images has only just begun.
Posted by AGORACOM
at 2:04 PM on Wednesday, January 22nd, 2020
SPONSOR: American Creek owns a 20% Carried Interest to Production at the Treaty Creek Project in the Golden Triangle. 2019’s first hole averaged of 0.683 g/t Au over 780m in a vertical intercept. The Treaty Creek property is located in the same hydrothermal system as the Pretivm and Seabridge’s KSM deposits. Click Here for More Info
For the second time in as many weeks, the world’s largest hedge fund is once again talking up gold as an important diversifier for investors.
Speaking to CNBC’s Squawk Box on the sideline of the World Economic
Forum in Davos, Switzerland, Ray Dalio, founder of Bridgewater
Associates, said that in the current environment, investors should hold a
global diversified portfolio that includes some gold.
“Cash is trash,†he declared in the interview. He warned that investors should get out of cash as central banks continue to print money.
However, Dalio tempered his comments on the precious metal, saying that “a bit of gold is a diversifier.â€
But it is not only cash that Dalio railed against. He also didn’t
have anything nice to say about bitcoin, which is neither a medium of
exchange nor a store of value.
He said that investors shouldn’t go anywhere near bitcoin because of
its volatility. When it comes to a store of value, central banks will
continue to prefer to hold hard assets.
“What are [central banks] going to hold as reserves? What has been
tried and true? They are going to hold gold. That is a reserve
currency, and it has been a reserve currency for a thousand years,†he
said.
Although Dalio said that he sees a low chance of a recession in
2020, he warned investors to look further out. The risks are that
because of where monetary policy is right now, it will be less
effective when the downturn does come.
“At a point in the future, we still are going to think about what’s a
storeholder of wealth. Because when you get negative-yielding bonds or
something, we are approaching a limit that will be a paradigm shift,â€
he said.
Dalio has been fairly bullish on gold and for nearly three years has
advocated that investors hold at least 5% to 10% of their portfolio in
gold.
Dalio’s latest comments come less than a week after Greg Jensen,
co-chief investment officer at Bridgewater Associates, said in an
interview with the Financial Times that he sees gold pushing to $2,000
an ounce.
Jensen said that he sees higher gold prices through 2020 as
inflation picks up but central banks, in particular the Federal Reserve,
step away from the fight.
“The Fed won’t be pre-emptive,†he said.
Jensen said that he is also bullish on gold as geopolitical uncertainty dominates financial markets and investor sentiment.
“When you look at the geopolitical strife, how many foreign entities
really want to hold dollars? And what are they going to hold? Gold
stands out,†he said.
Posted by AGORACOM-JC
at 12:23 PM on Wednesday, January 22nd, 2020
SPONSOR: BetterU Education Corp.
aims to provide access to quality education from around the world.
The company plans to bridge the prevailing gap in the education and job
industry and enhance the lives of its prospective learners by developing
an integrated ecosystem. Click here for more information.
Sequoia scores 21-fold return in Indian edtech exit
PRAMUGDHA MAMGAIN, DealStreetAsia
Investors in the world’s most valuable education technology startup Byju’s have reaped roughly $314 million in a partial selldown of the company.
Byju’s shares sold to General Atlantic, Naspers Ventures and Canada Pension Plan
NEW DELHI — Investors in the world’s most valuable education
technology startup Byju’s have reaped roughly $314 million in a partial
selldown of the company.
Sequoia Capital, Times Internet, SCHF PV Mauritius, and Mark
Zuckerberg’s philanthropic organization the Chan Zuckerberg Initiative
have together managed to take home about 22.3 billion rupees by partly
selling their stakes in the company in 2019, reported Entrackr, a
technology news provider focused on India.
These investors have offloaded their shares to the other backers of
Byju’s including General Atlantic, Naspers Ventures and Canada Pension
Plan, in the partial exit scheme.
Quoting the company’s filings, the report said that Sequoia received
21.13 times its initial investment while Times Internet made a
seven-times return.
SCHF PV Mauritius, via a secondary transaction, and the Chan
Zuckerberg Initiative have also managed to bag returns of around seven
times their investment.
Founders Divya Gokulnath Ravindran and Zeus Education Promoter’s continue to hold more than 30% of the company.
Byju’s, operated by Bengaluru-based Think and Learn, was recently in
the news for raising $200 million in fresh funding from New York-based
investment firm Tiger Global at an $8 billion valuation. Byju’s was
valued at $5.5 billion when it raised $150 million in a funding round
led by Qatar Investment Authority in July last year. Owl Ventures, an
education technology investor, also participated in that round.
In December 2018, Byju’s raised $540 million led by Naspers, with
participation from the likes of Canada Pension Plan Investment Board and
General Atlantic. That round had valued the company at roughly $3.6
billion. General Atlantic topped its investment with another 750 million
rupees to 800 million rupees in the company in March last year.
Until now, the company has raised about $1.2 billion across rounds.
Other investors in the Indian company include Verlinvest, Lightspeed
Venture Partners, Aarin Capital and Tencent Holdings.
The company’s net loss narrowed to 149.1 million rupees for the
financial year ended March 2019, compared with a net loss of 371.9
million a year ago. The company claimed to have turned profitable in
June 2018 after achieving $14.3 million in monthly revenues.
DealStreetAsia is a
financial news site based in Singapore focused on corporate investment
activity in Southeast Asia and India. Nikkei recently acquired a
majority stake in the company.
NEW DELHI — Investors in the world’s most valuable education
technology startup Byju’s have reaped roughly $314 million in a partial
selldown of the company.
Sequoia Capital, Times Internet, SCHF PV Mauritius, and Mark
Zuckerberg’s philanthropic organization the Chan Zuckerberg Initiative
have together managed to take home about 22.3 billion rupees by partly
selling their stakes in the company in 2019, reported Entrackr, a
technology news provider focused on India.
These investors have offloaded their shares to the other backers of
Byju’s including General Atlantic, Naspers Ventures and Canada Pension
Plan, in the partial exit scheme.
Quoting the company’s filings, the report said that Sequoia received
21.13 times its initial investment while Times Internet made a
seven-times return.
SCHF PV Mauritius, via a secondary transaction, and the Chan
Zuckerberg Initiative have also managed to bag returns of around seven
times their investment.
Founders Divya Gokulnath Ravindran and Zeus Education Promoter’s continue to hold more than 30% of the company.
Byju’s, operated by Bengaluru-based Think and Learn, was recently in
the news for raising $200 million in fresh funding from New York-based
investment firm Tiger Global at an $8 billion valuation. Byju’s was
valued at $5.5 billion when it raised $150 million in a funding round
led by Qatar Investment Authority in July last year. Owl Ventures, an
education technology investor, also participated in that round.
In December 2018, Byju’s raised $540 million led by Naspers, with
participation from the likes of Canada Pension Plan Investment Board and
General Atlantic. That round had valued the company at roughly $3.6
billion. General Atlantic topped its investment with another 750 million
rupees to 800 million rupees in the company in March last year.
Until now, the company has raised about $1.2 billion across rounds.
Other investors in the Indian company include Verlinvest, Lightspeed
Venture Partners, Aarin Capital and Tencent Holdings.
The company’s net loss narrowed to 149.1 million rupees for the
financial year ended March 2019, compared with a net loss of 371.9
million a year ago. The company claimed to have turned profitable in
June 2018 after achieving $14.3 million in monthly revenues.
DealStreetAsia is a
financial news site based in Singapore focused on corporate investment
activity in Southeast Asia and India. Nikkei recently acquired a
majority stake in the company.Education Times looks at the massive tr ..
Posted by AGORACOM
at 11:58 AM on Wednesday, January 22nd, 2020
SPONSOR: Labrador Gold – Two successful gold explorers lead the way in the Labrador gold rush targeting the under-explored gold potential of the province. Exploration has already outlined district scale gold on two projects, including a 40km strike length of the Florence Lake greenstone belt, one of two greenstone belts covered by the Hopedale Project. Click Here for More Info
At first glance gold looks like it may be about to advance out of a
bull Flag, but there are a number of factors in play that we will
examine which suggest that any near-term advance won’t get far before it
turns and drops again, and that a longer period of consolidation and
perhaps reaction is necessary before it makes significant further
progress.
On the 6-month chart we can see how gold stabbed into a zone of
strong resistance on the Iran crisis around the time Iran’s General was
murdered, but after a couple of bearish looking candles with high upper
shadows formed, it backed off into what many are taking to be a bull
Flag.
The 10-year chart makes it plain why gold is vulnerable here to
reacting back over the short to medium-term, because it has advanced
deep into “enemy territory†– the broad band of heavy resistance
approaching the 2011 highs, with a zone of particularly strong
resistance right where it is now. It would be healthier and increase
gold’s chances of breaking out to new highs if it now backed off into a
trading range for a while to moderate what now looks like excessive
bullishness.
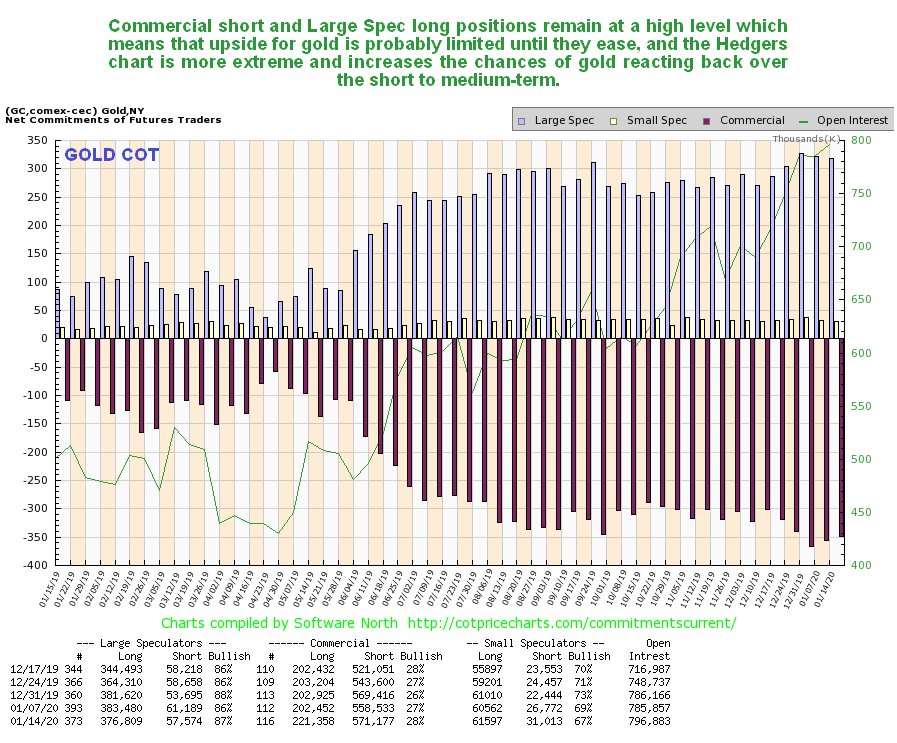
Thus it remains a cause for concern (or it should be for gold
bulls) to see gold’s latest COTs continuing to show high Commercial
short and Large Spec long positions. Is it “going to be different this
time� – the latest Hedgers charts that we are now going to look at
suggest not.
Click on chart to popup a larger, clearer version.
The COT chart only goes back a year. The Hedgers charts shown
below, which are a form of COT chart, go back many years, and frankly,
they look pretty scary.
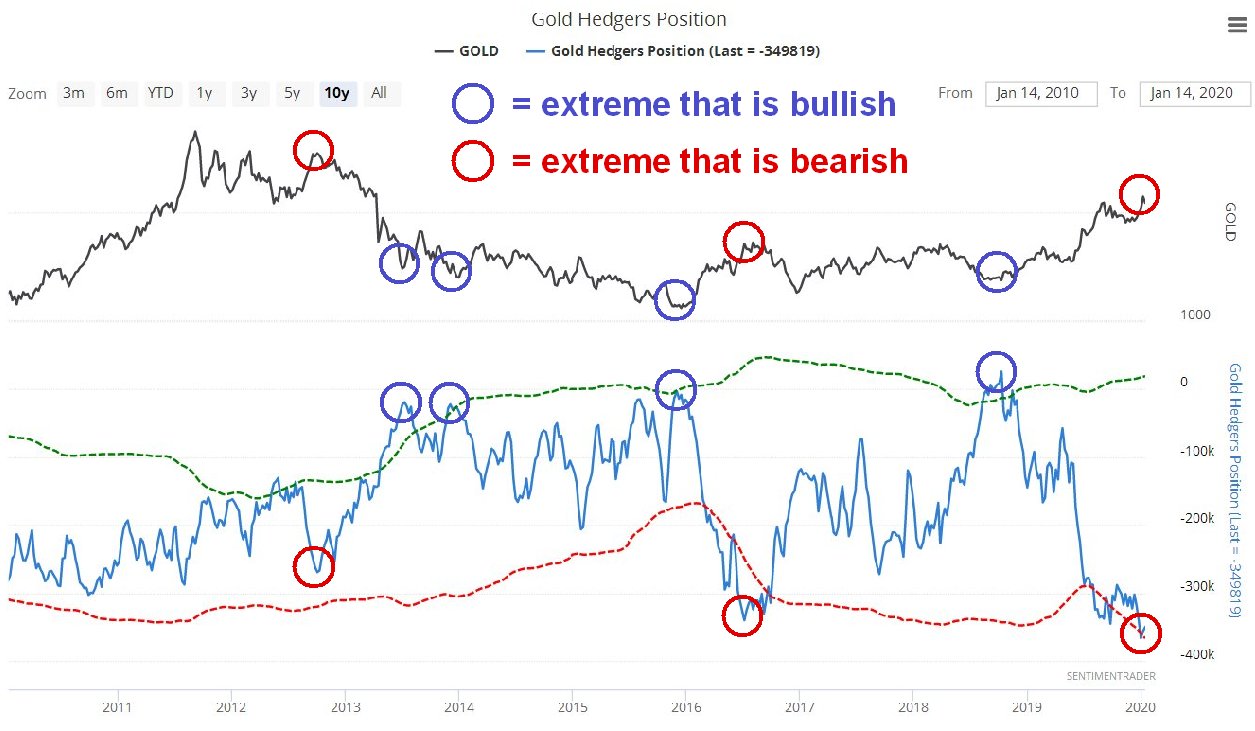
We’ll start by looking at the Hedger’s chart that goes back to before
the 2011 sector peak. On it we see that current Hedgers positions are
at extremes that way exceed even those at the peak of the 2012 sucker
rally, which was followed by the bulk of the decline in the bearmarket
that followed. Does this mean that we are going to see another
bearmarket like that – no it doesn’t, but it does mean that these
positions will probably need to moderate before we see significant
further gains.
Click on chart to popup a larger, clearer version.
Chart courtesy of sentimentrader.com
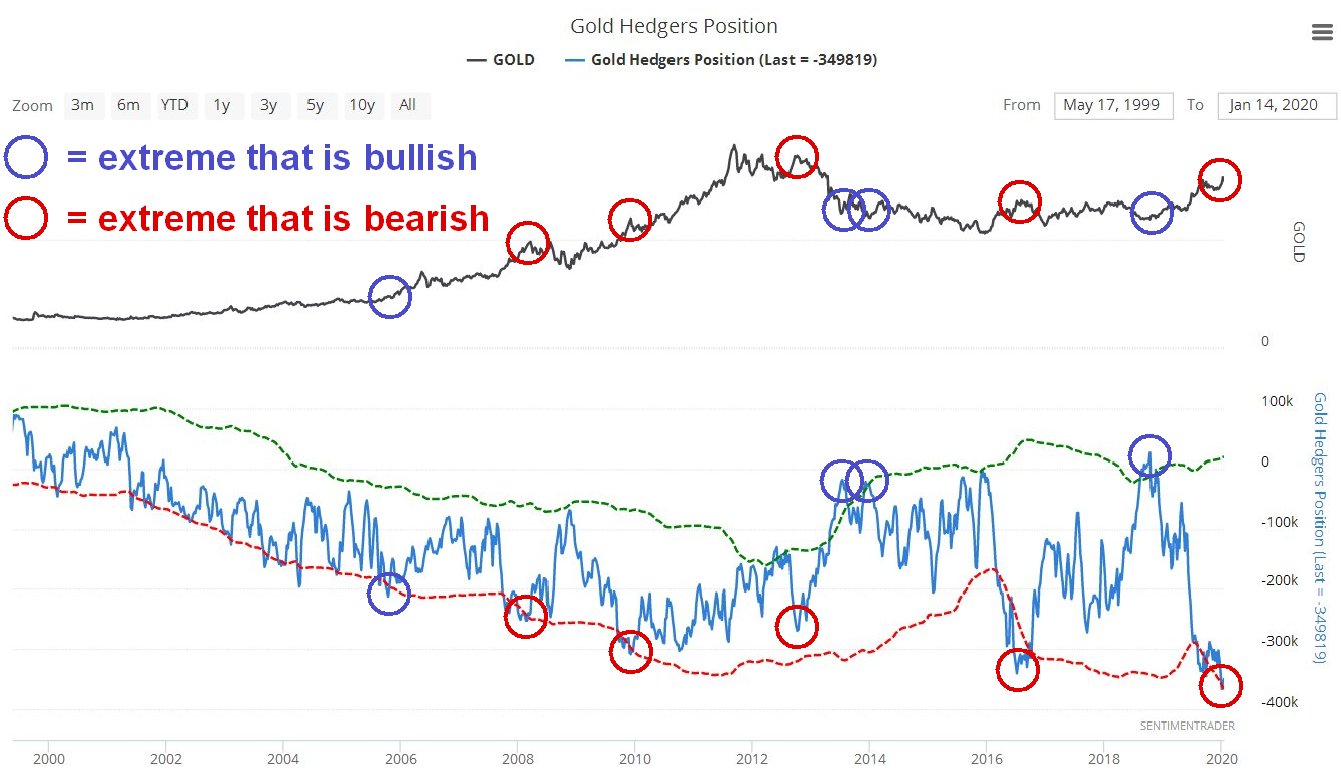
Looking at the Hedgers chart going way back to before the year
2000, we see that the current readings are record readings by a
significant margin and obviously increase the risks of a sizeable
reaction. We can speculate about what the reasons for a decline might
be, one possibility being the sector getting dragged down by a
stockmarket crash after its blowoff top, which may be imminent, as
happened in 2008, since it remains to be seen whether investors will
rush into the sector as a safe haven in the event of a market crash.
Click on chart to popup a larger, clearer version.
Chart courtesy of sentimentrader.com
Turning now to Precious Metals stocks, we see on its latest
10-year chart that GDX still looks like it is completing a giant
Head-and-Shoulders bottom pattern. However, it is currently dithering
just beneath resistance at the top of this base pattern, which means
that it is vulnerable to backing off.
So, how then does gold stock sentiment look right now? As we can
see on the 5-year chart for the Gold Miners’ Bullish Percent Index,
bullishness towards the sector is now at a very high level, 84.6%, which
makes it more likely that stocks will drop soon rather than rally, and
what they could do of course is rally some to increase this level of
bullishness still further, and then drop.
Does all this mean that investors in the sector should suddenly
rush for the exits? No, it doesn’t, especially as the charts for many
individual stocks across the sector look very bullish, and it may be
that all that is needed is a cooling period of consolidation. However it
does make sense to use Hedges at extremes, such as leveraged inverse
ETFs and better still options as insurance, which have the advantage of
providing protection for a very small capital outlay, a fine example
being GLD Puts which are liquid with narrow spreads. We did this just ahead of the recent peak
when Iran lobbed a volley of missiles at Iraq. We will not be selling
our strongest gold and silver stocks, but instead look to buy more on
dips.
Posted by AGORACOM-JC
at 11:21 AM on Wednesday, January 22nd, 2020
SPONSOR:ThreeD Capital Inc. (IDK:CSE)
Led by legendary financier, Sheldon Inwentash, ThreeD is a
Canadian-based venture capital firm that only invests in best of breed
small-cap companies which are both defensible and mass scalable. More
than just lip service, Inwentash has financed many of Canada’s biggest
small-cap exits. Click Here For More Information.
Square’s Crypto Division Finally Releases Details of First Bitcoin Product
Last year, Jack Dorsey — the chief executive of both Square and Twitter — began to openly shill Bitcoin in a number of public channels.
Naturally, his love for Bitcoin extended into his companies, with Square announcing a new division called Square Crypto in 2019.
For instance, on the Joe Rogan Podcast, he revealed that he thinks
the cryptocurrency will become a native currency of the Internet, and
during an official earnings call for his fintech company Square, he took
some time to tout his love for Bitcoin.
Naturally, his love for Bitcoin extended into his companies, with Square announcing a new division called Square Crypto in 2019.
Dorsey’s premise was that someone told him the most important thing
he could do for Bitcoin is to “make the broader crypto ecosystem
better,†hence the creation of this new division to do “what’s best for
the crypto community and individual economic empowerment.â€
#BitcoinTwitter and #CryptoTwitter!
Square is hiring 3-4 crypto engineers and 1 designer to work full-time
on open source contributions to the bitcoin/crypto ecosystem. Work from
anywhere, report directly to me, and we can even pay you in bitcoin!
Introducing @SqCrypto. Why?
The team leader, a former senior employee at Google, did mention
products meant to improve the usability of Bitcoin as a day-to-day form
of money but was slow to elucidate any ventures it was eyeing.
But today, we got our answer.
Square Crypto Unveils First Product, a Bitcoin Lightning Network Developer Kit
This is kind of like a traditional software development kit (SDK) but
focused on the Lightning Network, a second-layer scaling solution that
effectively migrates some transactions off the main chain to allow for
lightning-fast, effectively free, and cross-chain transfers.
We’ve got the team. We’ve got the mission. We’ve got hit or miss
tweets. And now it’s time to talk about what we’re building: Introducing
the Lightning Development Kit, or LDK. https://t.co/o73cJy7Cur
The LDK, the post indicates, will allow wallet developers to create
“custom†integrations of the Network in an “easy, safe, and configurable
way†through an API, demo apps, and other technical tools.
As to what exactly the LDK can be used for, at least from a top-down perspective, Square Crypto gave three examples:
1) Adding Lightning capabilities to existing bitcoin wallets — no
need to create a separate wallet just for Lightning. 2) Supporting
multi-device, multi-application access to a single wallet. 3) Allowing
wallets to make UX/security/privacy tradeoffs such as external
transaction signing and customizing their state backup to a cloud
service.
Essentially, it should make the integration of the Lightning Network
into existing or up-and-coming cryptocurrency software much easier than
it is, and should, therefore, increase the adoption of the scaling
solution with ample time.
It’s kind of like a shoehorn, but with the shoe being Bitcoin software and the foot being the Lightning Network…
Very Good Timing
The release of the LDK comes at a very good time, with the Lightning
Network once again entering the minds of Bitcoin and cryptocurrency
enthusiasts.
Per previous reports from Blockonomi, Bitcoin proponent Hodlonaut has started what is known as the Lightning Network Trust Chain for the second time.
Last time, this challenge, which sees individuals use the Lightning
Network and large BTC transactions to create a link between Twitter
accounts, gained much steam. Dorsey and LinkedIn and Microsoft board
member Reid Hoffman participated in the Chain, amongst other prominent
members of the community.
And as a result, the Lightning Network saw a flurry of growth, with
the capacity of the Network nearly doubling in value during the time the
chain was being formed.
With the arrival of the second Trust Chain and Square Crypto’s new
Lightning Network kit, this Bitcoin scaling solution could see a
micro-renaissance, so to say.
Posted by AGORACOM
at 5:40 PM on Tuesday, January 21st, 2020
SPONSOR: Gratomic Inc. (TSX-V: GRAT) Advanced materials company focused on mine to market commercialization of graphite products, most notably high value graphene based components for a range of mass market products. Collaborating with Perpetuus, Gratomic will use Aukam graphite to manufacture graphene products for commercialization on an industrial scale. For More Info Click Here
A new technique to make ultra-flat, wrinkle-free films of graphene
could pave the way for a host of applications, including graphene-based
flexible electronics and high-frequency transistors. The technique works
by introducing protons into the film as graphene is synthesized using
chemical vapour deposition (CVD), and its inventors say that it might be
extended to other two-dimensional materials such hexagonal boron
nitride (h-BN) and the transition-metal dichalcogenides (TMDCs). It
could also aid the development of hydrogen storage devices made from
layered 2D structures.
Graphene – a 2D honeycomb of carbon atoms just one atom thick –
boasts several unique electronic properties. In contrast to conventional
semiconductors, which have an energy gap between the electron valence
and conduction bands, graphene is a “zero-gap†semiconductor. This means
its electron valence and conduction bands just touch each other. At the
point of contact, the electrons move at near-ballistic speeds, and
their behaviour is governed by the Dirac equation for relativistic
electrons – hence the name “Dirac point†for this section of graphene’s
band structure.
Linear defects
So far, this electronic behaviour has only been observed in small
flakes of graphene that have been shaved off, or exfoliated, from
samples of bulk graphite. These flakes are not big enough to be
practical for electronic circuits, and although larger, wafer-sized
graphene films can easily be produced via CVD, their electronic
performance is not as good. This is because CVD-grown graphene, unlike
the exfoliated type, contains grain boundaries, atomic vacancies,
impurities and wrinkles. These defects act as centres off which
electrons can scatter as they travel, thus degrading the material’s
electronic properties.
CVD-produced graphene is prone to wrinkling because the graphene must
adhere to the surface of a substrate as it grows. If the thermal
expansion coefficient of the substrate does not match that of the
graphene itself, a change in temperature can lead to linear defects –
wrinkles – forming as the ensemble strives to release compressive
strain.
Researchers have attempted to reduce wrinkling by performing CVD at
low temperatures, using substrates with a similar thermal coefficient to
that of graphene, and developing single-crystalline substrates. A team
of researchers led by Libo Gao at China’s Nanjing University has now shown that reducing the interaction between graphene and its substrate might be a good, alternative, strategy.
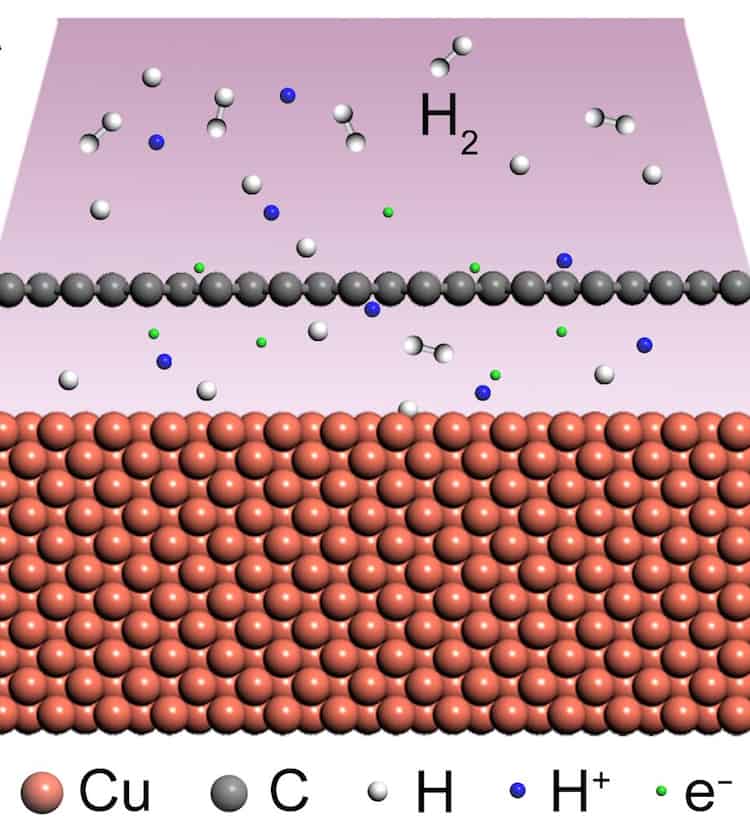
Intercalating hydrogen molecules
The Nanjing team began by introducing a plasma of protons – hydrogen
ions – into the graphene’s growth chamber. During the CVD process, some
of this hydrogen became intercalated between the graphene and its
substrate, causing the two materials to decouple.
Gao and colleagues found that some of the wrinkles disappeared
entirely from the graphene thanks to this proton penetration. They
believe this is due to decreased van der Waals interactions between the
carbon sheet and the substrate, as well as – possibly – an increase in
the substrate’s distance from the growth surface thanks to the
intercalation process.
High-quality bilayer graphene goes large
The researchers also found that the electronic band structure of
their graphene films shows a V-shaped “Dirac cone†(representing the
density of states around the Dirac point) similar to the one observed in
exfoliated graphene. They argue that this proves the proton-assisted
CVD-grown graphene is indeed decoupled from its substrate.
The technique, which is detailed in Nature,
could be extended to grow ultra-flat versions of other 2D materials,
such as h-BN and the TMDCs, Gao says. It might also make it possible to
develop hydrogen storage devices made from these layered materials.
“The physical and electronic properties of our ultra-flat graphene
films are homogenous on the large scale, which means they might now be
used in higher-performance electronic and photoelectronic devices,†he
tells Physics World.


