Agoracom Blog Home

Posts Tagged ‘#Discovery’

Barrick Rigs to Commence Drilling This Quarter on Several Priority Targets in the Ngayu Greenstone Belt, D.R. Congo $ABX.ca $TECK.ca $RSG $NGT.to $GOLD $NEM

Posted by AGORACOM at 9:34 AM on Thursday, May 14th, 2020
This image has an empty alt attribute; its file name is Loncor-Small-Square.png

TORONTO, May 14, 2020 (GLOBE NEWSWIRE) — Loncor Resources Inc. (“Loncor” or the “Company“) (TSX: “LN”; OTCQB: “LONCF”) is pleased to provide an update on its activities within the Ngayu Greenstone Belt, where the Company has a dominant foot-print through its joint venture with Barrick Gold (Congo) SARL (“Barrick”) and on its own majority-owned exploration licences and exploitation concessions, including the Imbo exploitation concession (76.29%) that contains the Adumbi deposit and its wholly-owned exploration licence containing the Makapela deposit

Barrick Joint Venture

Loncor recently received the quarterly exploration report from joint venture partner Barrick for the first quarter of 2020. As announced in February 2020, joint venture partner and operator Barrick had identified a number of priority drill targets within the 1,894 square kilometre joint venture land package at Ngayu and drilling was due to commence in March. Some delays were encountered at the border due to additional permitting requirements resulting from the COVID-19 situation but the two drill rigs are now at the Kibali mine site and are planned to be mobilised to Ngayu in the second quarter.

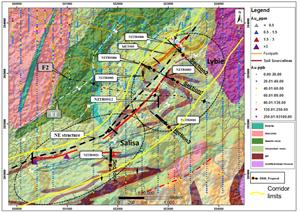
The first drill target is expected to be at Anguluku where an initial six core holes are planned. Depending on results, additional holes will be drilled at Anguluku or the drills will be moved to Salisa/Lybie where an initial twelve holes are planned. Other targets to be drilled include Yambenda/Yasua (see Figures 1 and 2 below).

A large component of Barrick’s Q1 2020 exploration program was focused on reconnaissance follow up. The goal of these reconnaissance studies was to delineate new targets for prioritisation and assess existing targets to advance them to the drilling stage or remove them from the resource triangle. At the time of reporting, of the eleven Areas of Interest identified during the last quarter, eight had been evaluated for potential of hosting tier 1 deposits. Two of the eight assessed did not pass the preliminary indicators to host tier 1 deposits.  This quarter’s further assessment was completed on the Andagbowa, Zunguluka, Makapela West and Imva South blocks. At Andagbowa, two new targets were delineated for follow up work.

Andagbowa is located to the northeast corner of the Ngayu concession and about 32 kilometres northeast of the Mambati base camp. It is characterised by complex lithological and structural settings, which includes the presence of folded and fractured banded ironstone formation (“BIF”) and the hinge of a belt scale fold. Previous work has shown localized low grade BLEG anomaly basins, intense alluvial artisanal activities and a lack of quartz pebbles in the streams which could suggest potential for disseminated style gold mineralization.

Exploration fieldwork completed during the quarter at Andagbowa aimed at gaining geological characteristics of the area in order to evaluate its potential and perspectivity for future detailed work. The fieldwork undertaken included preliminary exploration study combining geological, structure and alteration mapping and sampling for gold analysis. Structural data confirmed the interpreted open folding system with NNW fold axis occurring within the area close to the Makapela Intrusive. The identified NE-SW, E-W and NW-SE moderate to steeply dipping mineralized sheared zones are aligned along the regional fold and parallel to the interpreted domain boundary subsidiary fault which could play a part in controlling the distribution of gold mineralization, either hosting mineralization or by acting as conduit for hydrothermal fluids.

The preliminary exploration work at Andagbowa area revealed two potential prospects for future work; namely Bon Marche and Tozali.  The two prospects are characterized by sheared and brecciated rocks including BIF containing either stockworks of quartz veinelts or sheeted stringers of silica associated with pervasive sericite and weak disseminated fine to coarse sulphides.

Bon Marché prospect is located about 5 kilometres east of Bole Bole village; the area occurs structurally in the interpreted regional hinge and is characterized by:

  • NE and ENE trending mineralized shear zones (up to 12 metres wide) containing sheeted quartz stringers and veinlets associated with pervasive sericite hosted by metasediment rock. Each of the two shear zones is mined along 100 metre length by artisanal miners.  Assay results of up to 2 metres @ 1.07g/t Au was intercepted from channel sampling.
  • 2.5 kilometres folded and fractured BIF with weak disseminated sulphide and pervasive silica with 0.83 g/t Au from litho samples.
  • The potential hinge at Bon Marche is located 1.5 kilometres north of soil anomalies localized almost within the same hinge zone. 

While the Tozali prospect is located 6 kilometres south-east of Bon Marché and shows:

  • 1.5 kilometre potential NW trending brecciated BIF containing disseminated boxworks and stockworks of quartz-carbonate stringers. Received results revealed anomalised values up to 0.76g/t Au.

At the beginning of the quarter, LIDAR (Light Detection and Ranging remote sensing) surveys were also conducted on four exploration blocks in the joint venture. The benefits of LIDAR data compared to traditional aerial-photo-based interpretation are in more detailed identification of possible surface deposits, mapping lithology, structures and more precise edging of the geomorphologies, which could hold large scale deposits. This method also reflects more accurately the true ground surface in areas of dense vegetation. The results of the LiDAR surveys are being collated with other existing geological and geophysical layers to further generate and prioritise more targets.

Imbo Exploitation Permit (Loncor 76.29%)

Outside of the Barrick joint venture, exploration activities have continued on Loncor’s Imbo exploitation concession (76.29%) in the east of the Ngayu belt. Fieldwork by Loncor geologists have focused on the Imbo East prospect 12 kilometres west-southwest of Adumbi along the same mineralised structural trend. Gridding, soil and rock sampling are being undertaken over a strike length of 3.6 kilometres. Additional follow up will be dependent on assay results which are pending.

Qualified Person
Peter N. Cowley, who is President of Loncor and a “qualified person” as such term is defined in National Instrument 43-101, has reviewed and approved the technical information in this press release. 

About Loncor Resources Inc.
Loncor is a Canadian gold exploration company focussed on the Ngayu Greenstone Belt in the Democratic Republic of the Congo (the “DRC”).  The Loncor team has over two decades of experience of operating in the DRC.  Ngayu has numerous positive indicators based on the geology, artisanal activity, encouraging drill results and an existing gold resource base.  The area is 200 kilometres southwest of the Kibali gold mine, which is operated by Barrick Gold (Congo) SARL (“Barrick”).  In 2019, Kibali produced record gold production of 814,000 ounces at “all-in sustaining costs” of US$693/oz.  Barrick has highlighted the Ngayu Greenstone Belt as an area of particular exploration interest and is moving towards earning 65% of any discovery in 1,894 km2 of Loncor ground that they are exploring.  As per the joint venture agreement signed in January 2016, Barrick manages and funds exploration on the said ground at the Ngayu project until the completion of a pre-feasibility study on any gold discovery meeting the investment criteria of Barrick.  In a recent announcement Barrick highlighted six prospective drill targets and are moving towards confirmation drilling in 2020. Subject to the DRC’s free carried interest requirements, Barrick would earn 65% of any discovery with Loncor holding the balance of 35%.  Loncor will be required, from that point forward, to fund its pro-rata share in respect of the discovery in order to maintain its 35% interest or be diluted.

In addition to the Barrick JV, certain parcels of land within the Ngayu project surrounding and including the Makapela and Adumbi deposits have been retained by Loncor and do not form part of the joint venture with Barrick. Barrick has certain pre-emptive rights over the Makapela deposit.  Loncor’s Makapela deposit (which is 100%-owned by Loncor) has an indicated mineral resource of 614,200 ounces of gold (2.20 million tonnes grading 8.66 g/t Au) and an inferred mineral resource of 549,600 ounces of gold (3.22 million tonnes grading 5.30 g/t Au).  Adumbi and two neighbouring deposits hold an inferred mineral resource of 2.5 million ounces of gold (30.65 million tonnes grading 2.54 g/t Au), with 76.29% of this resource being attributable to Loncor via its 76.29% interest in the project.  

Resolute Mining Limited (ASX/LSE: “RSG”) owns 26% of the outstanding shares of Loncor and holds a pre-emptive right to maintain its pro rata equity ownership interest in Loncor following the completion by Loncor of any proposed equity offering. 

Additional information with respect to Loncor and its projects can be found on Loncor’s website at www.loncor.com.

For further information, please visit our website at www.loncor.com, or contact: Arnold Kondrat, CEO, Toronto, Ontario, Tel: + 1 (416) 366 7300.

Figure 1 Ngayu Belt.  Developing Prospectivity, Work Programs and Drill Targets for 2020

https://www.globenewswire.com/NewsRoom/AttachmentNg/572d4a28-b6e1-48d5-91bc-a419b7da1825

(From Barrick Q1 2020 joint venture report)

Figure 2 Geology of Lybie-Salisa with proposed drill holes

https://www.globenewswire.com/NewsRoom/AttachmentNg/3c3bbe85-9561-43ab-811b-8ad43e2b6e9d

(From Barrick Q1 2020 joint venture report)

Figure 1
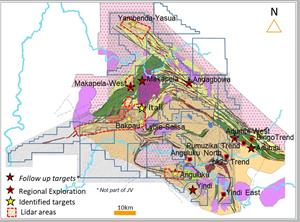
Ngayu Belt. Developing Prospectivity, Work Programs and Drill Targets for 2020 (From Barrick Q1 2020 joint venture report)
Figure 2
Geology of Lybie-Salisa with proposed drill holes (From Barrick Q1 2020 joint venture report)

Labrador Gold $LAB.ca Provides Update on Kingsway Project $RIO.ca $WHM.ca $SIC.ca $NXS.ca $NVO.ca

Posted by AGORACOM at 8:23 AM on Wednesday, May 13th, 2020
  • Review of historical work as well as more recent exploration over the past four years shows excellent potential for a gold mineralized system at Kingsway.
  • Historical work showing subangular gold grains recovered from till samples indicate a source of 100 to 500 metres up ice.
  • A sub-angular boulder of quartz vein containing visible gold recovered from a trench with gold grains in till assayed 168 g/t Au. The source of the boulder has not been found.

TORONTO, May 13, 2020 (GLOBE NEWSWIRE) — Labrador Gold Corp. (TSX-V: LAB) (“LabGold” or the “Company”) is pleased to provide an update on its Kingsway Property near Gander, Newfoundland.

The two claim blocks that comprise the Kingsway Property cover over 14 kilometres of strike length of the potential extension of the Appleton fault zone which is associated with many of the gold showings, including the new discovery (downhole drill intersection of 92.86g/t Au over 19 metres), on New Found Gold’s Queensway project to the south. (Note that mineralization hosted on adjacent and/or nearby properties is not necessarily indicative of mineralization hosted on the Company’s property).

Since the Company acquired the option to acquire a 100% interest in the property (see news release dated March 3, 2020) it has been compiling historical data from work completed between 1989 and 2005. More recent exploration over the past four years has confirmed and expanded on this historical data and indicates the potential for a gold mineralized system at Kingsway.

Historical sampling of glacial till over the southern claim block showed gold values from below detection (<5ppb) to 89,000ppb (89g/t Au) in heavy mineral concentrates with 8 samples assaying over 10,000ppb (10g/t Au). Gold anomalies in the concentrates extend over three kilometres along the Appleton fault zone. Panning of till samples for gold grains showed between 2 and 13 grains in five samples from the south claim block and between 6 and 26 gold grains in six samples from the north claim block. Shape analysis of the gold grains showed many of them to be subangular, suggesting that they did not travel far from their source which was estimated to be between 100m and 500m up ice.

In addition, trenching in the vicinity of the high gold values in heavy mineral concentrates uncovered a subangular boulder of quartz vein containing visible gold which assayed 168 g/t Au. Neither the source of the boulder nor of the gold grains has been found.

Previous work suggests that gold mineralization is associated with regional structures, particularly where second order cross structures occur. This has been further demonstrated by the New Found Gold discovery to the south of the Kingsway Property, where gold mineralization appears to be related to structures cross cutting the Appleton fault zone. Despite the recognition of this control on mineralization early on, there does not appear to have been an attempt to target such structures in the drilling to date on the property. While historical drilling did not result in a discovery, there were indications of proximity to a mineralized system. In particular, a hole drilled near the heavy mineral concentrates with high gold values intersected approximately 22 metres of brecciated and silicified siltstone with numerous quartz stringers and quartz carbonate veins containing pyrite mineralization as stringers and blebs.

Exploration over the past four years by Torq Resources and Shawn Ryan included over 1,758 till samples 3,724 vegetation (spruce tips) samples 2,381 till XRF samples and 2,958 soil samples taken over a 45km by 15km (675 square kilometre) area. This work resulted in the identification of an area of 66 square kilometres most prospective for gold mineralization covered by the Kingsway north and south claim blocks. Till and vegetation sampling over the south claim block confirms the results of the historical work and identified new gold anomalies while the work on the northern claim block identified new gold anomalies associated with north-northeast trending magnetic lineaments that need to be followed up. On both claim blocks there is a close association between the gold anomalies and the Appleton or Dog Bay structures.

Gold anomalies in soil samples on the southern claim block occur to the west (up ice) of the historical gold anomalies in heavy mineral concentrates and may indicate a potential source area. More detailed sampling on a tighter spacing is required to test this interpretation.

On the northern claim block, which is covered by a historical detailed airborne Dighem survey, most of the gold anomalies are associated with north trending resistivity high/low contacts and NE cross cutting magnetic lineaments. Significant gold in soil anomalies occur both to the northwest and to the south east of three gold in lake sediment anomalies. The anomalies to the northwest also occur over anomalous gold in vegetation samples, whereas those to the south, where there is no detailed vegetation or till samples, occur in the vicinity of historical till samples assaying between 163 and 1,398 ppb Au that also contain gold grains.

The assays from the historical work presented here, while considered accurate, have not yet been verified by independent sampling as the Company has not been able to conduct fieldwork since acquiring the Project.

Roger Moss, President and CEO stated: “Historical exploration and more recent work has clearly demonstrated the potential of the Kingsway project for the discovery of orogenic gold deposits associated with deep seated structures. The presence of the Appleton and Dog Bay structures on the property with evidence of gold in till, vegetation, soil, stream sediments, lake sediments and float suggest the presence of a significant mineralized system. Detailed soil sampling combined with ground magnetic and VLF-EM are planned for the coming field season to define targets for subsequent drill testing. In the meantime, compilation and interpretation of the historical work continues to define the most prospective areas for successful follow up.”

Shawn Ryan, technical advisor stated: “The Kingsway Project covers some of the first claims I staked outside of the Yukon. It was based on extensive research and ground follow up. The government till sampling and historical work was very compelling in showing that the Appleton and Dog Bay Line structures are very anomalous in gold. The previous option holder conducted extensive regional till and vegetation sampling that outlined nice anomalous gold areas. I pared down the large claim block to the two best areas. The subsequent announcement of the New Found Gold high-grade intersection south of Kingsway has given the district the evidence needed that good gold grades are associated with regional NNE (Appleton) structures cross cut by NE trending structures. These same structural patterns are seen in the geophysics on the Kingsway project. I look forward to the follow up work to be conducted over the next couple of seasons.”

Roger Moss, PhD., P.Geo., is the qualified person responsible for all technical information in this release.

About Labrador Gold:

Labrador Gold is a Canadian based mineral exploration company focused on the acquisition and exploration of prospective gold projects in the Americas.

In early March 2020, Labrador Gold acquired the option to earn a 100% interest in the Kingsway project in the Gander area of Newfoundland. The property is along strike to the northeast of New Found Gold’s discovery of 92.86 g/t Au over 19.0 metres on their Queensway property. The two licenses comprising the Kingsway project cover approximately 16km of the Appleton fault zone which is associated with gold occurrences in the region, including the New Found Gold discovery. Historical work over the area covered by the Kingsway licenses shows evidence of gold in till, vegetation, soil, stream sediments, lake sediments and float. Infrastructure in the area is excellent located just 18km from the town of Gander with road access to the project, nearby electricity and abundant local water.

The Hopedale property covers much of the Florence Lake greenstone belt that stretches over 60 km. The belt is typical of greenstone belts around the world but has been underexplored by comparison. Initial work by Labrador Gold during 2017 show gold anomalies in soils and lake sediments over a 3 kilometre section of the northern portion of the Florence Lake greenstone belt in the vicinity of the known Thurber Dog gold showing where grab samples assayed up to 7.8g/t gold. In addition, anomalous gold in soil and lake sediment samples occur over approximately 40 kilometres along the southern section of the greenstone belt (see news release dated January 25th 2018 for more details).

The Ashuanipi gold project is located just 35 km from the historical iron ore mining community of Schefferville, which is linked by rail to the port of Sept Iles, Quebec in the south. The claim blocks cover large lake sediment gold anomalies that, with the exception of local prospecting, have not seen a systematic modern day exploration program. Results of the 2017 reconnaissance exploration program following up the lake sediment anomalies show gold anomalies in soils and lake sediments over a 15 kilometre long by 2 to 6 kilometre wide north-south trend and over a 14 kilometre long by 2 to 4 kilometre wide east-west trend. The anomalies appear to be broadly associated with magnetic highs and do not show any correlation with specific rock types on a regional scale (see news release dated January 18th 2018). This suggests a possible structural control on the localization of the gold anomalies. Historical work 30 km north on the Quebec side led to gold intersections of up to 2.23 grams per tonne (g/t) Au over 19.55 metres (not true width) (Source: IOS Services Geoscientifiques, 2012, Exploration and geological reconnaissance work in the Goodwood River Area, Sheffor Project, Summer Field Season 2011). Gold in both areas appears to be associated with similar rock types.

The Company has 57,039,022 common shares issued and outstanding and trades on the TSX Venture Exchange under the symbol LAB.

For more information please contact:

Roger Moss, President and CEO
Tel: 416-704-8291

Or visit our website at: 

www.labradorgold.com

Kingsway Compilation

Geochemical Anomalies on Kingsway Project

‘Something Big is Coming’; Gold’s Narrowing Range to Lead To Major Price Move SPONSOR Labrador Gold $LAB.ca $RIO.ca $WHM.ca $SIC.ca $NXS.ca

Posted by AGORACOM at 1:28 PM on Tuesday, May 12th, 2020

SPONSOR: Labrador Gold – Two successful gold explorers lead the way in the Labrador gold rush targeting the under-explored gold potential of the province. Exploration has already outlined district scale gold on two projects, including a 40km strike length of the Florence Lake greenstone belt, one of two greenstone belts covered by the Hopedale Project. Recently acquired 14km of the potential extension of the new discovery by New Found Gold’s Queensway project to the south. Click Here for More Info

(Kitco News) – Gold futures are behaving like a restless person taking a nap – with the market not moving much in either direction lately but yet tossing and turning a lot.

The metal has been in a narrowing range for nearly a month now, but sometimes making violent moves within that trading band. However, the pattern is forming a so-called wedge formation that should lead to a breakout in the not-too-distant future, some observers said.

“Something big is coming here,” said Sean Lusk, co-director of commercial hedging with Walsh Trading.

The formation is setting up for either an extension to the upside or a correction to the downside, he continued.

“I don’t see this being range-bound for much longer. The next couple of weeks should be tell-tale.”

The metal sold off in mid-March with other asset classes as investors had to generate cash when stocks were falling. The June futures bottomed at $1,453 an ounce in mid-March. The contract then climbed as high as $1,788.80 an ounce on April 14, then backed off to a low of $1,666.20 on April 21.

Since, the range has been narrowing, confined to a $1,676-$1,1735.50 band so far this month. The range narrowed even further to $1,692.10-$1,713.80 this week. So far on Tuesday, the metal is having an “inside day” on the charts in which the high and low are within the prior day’s trading range. The contract was up $12.80 to $1,710.80 an ounce as of 10:23 a.m. EDT.

“We leapt, then we’ve been basically in a pretty violent trading range, fighting to hang onto $1,700 an ounce with people looking for record highs in the future,” said Phil Flynn, senior market analyst with Price Futures Group. “We’ve seen a lull.”

Flynn described the underlying fundamental backdrop as still solid for gold, with governments undertaking massive fiscal stimulus and central bankers ultra-loose monetary policy. However, gold is being held back for the moment by a strong stock market and U.S. dollar, traders said.

“We are seeing a run back toward stocks and away from gold as a safe-haven play,” Flynn said. “So it’s been struggling a little bit.”

Lusk characterized the stock-market recovery as “outstanding” since the sell-off to the March lows that occurred on worries about the economic impact of the coronavirus pandemic.

“If the Dow Jones makes a run for 25,000, or perhaps 26,000, it seems ridiculous considering what’s going on with the economy shutting down,” Lusk said. “But those are things that will probably drive some money out of gold.”

Should stocks remain strong, gold conceivably could get “whacked” another $100, he said. Further, Lusk added, recent highs in the U.S. dollar have probably prompted some selling in gold.

But for now, the range has been narrowing, with buying on price dips.

“There’s a lack of conviction on both sides,” Lusk said. “You see a little bit of profit-taking. Then when we break below $1,700, we see some bargain buying come back into the market. That tells me it’s not over yet.”

There is still much uncertainty in the world, Lusk said. If economies open up, will they have to shut down again due to another wave of the cornonavirus? Markets are also watching to see whether a trade war between the U.S. and China heats up again.

“I think we’re pausing here and waiting for the next shoe to drop,” Lusk said. “The market is looking for a new catalyst one way or another.”

Longer-term structural issues in the economy are not likely to be resolved quickly, even if a vaccine for the virus is found, Lusk said. He also suggested there could be a stalemate between lawmakers in an election year.

Flynn commented that the underlying fundamentals for gold are still “very bullish” because of actions taken by the Federal Reserve.

“We know that low interest rates are supportive for gold,” Flynn said. “We know that quantitative easing is bullish for gold.”

Further, with markets hopeful that economies will start to reopen, physical demand for gold jewelry should start to improve, Flynn added.

On top of this, Lusk pointed out that lawmakers in Washington D.C. are talking about another round of massive fiscal stimulus of perhaps $3 trillion on top of what has already occurred. That could eventually weigh on the U.S. dollar.

Yet, Lusk continued, that doesn’t mean gold can’t correct lower again, especially since late spring and early summer tend to be seasonally weak periods for physical demand. In the current environment, Indian and Chinese demand has been soft, in particular.

Lusk commented that the market could fall to just below $1,600 an ounce or alternatively take off to $1,827.

“It’s kind of frustrating,” he said about the uncertainty facing traders art the moment. “I look for a more pronounced move in the next couple of weeks for sure.”

SOURCE: https://www.kitco.com/news/2020-05-12/-Something-big-is-coming-Gold-s-narrowing-range-to-lead-to-a-major-price-move-analysts.html

American Creek $AMK.ca Sells Minority Interest in Electrum Property Joint Venture to Tudor Gold $TUD.ca $SII.ca $GTT.ca $AFF.ca $SEA.ca $SA $PVG.ca $AOT.ca $ESK.ca

Posted by AGORACOM at 9:18 AM on Tuesday, May 12th, 2020

Cardston, Alberta–(Newsfile Corp. – May 12, 2020) – American Creek Resources Ltd. (TSXV: AMK) (“the Corporation”) (“American Creek”) today announced that it has executed an agreement with Tudor Gold Corp. (“Tudor”) whereby Tudor is buying out the Corporation’s 40% interest in the Electrum Project Joint Venture located near Stewart, British Columbia.

Tudor will pay American Creek $250,000 cash and issue 1,400,000 Tudor shares upon the transaction closing. The shares are subject to a standard four month hold period and a voluntary eight month hold as well.

This transaction is subject to approval by the TSX Venture Exchange.

Darren Blaney, American Creek CEO stated: “We think this transaction makes sense for American Creek and its shareholders as we are trading a minority interest in the Electrum property for non-dilutive operating cash as well as a substantial share position in Tudor which gives us more exposure to the upcoming Treaty Creek developments which we believe will be very significant.”

About American Creek

American Creek holds a strong portfolio of gold and silver properties in British Columbia.

Three of those properties are located in the prolific “Golden Triangle”; the Treaty Creek and Electrum joint venture projects with Tudor (Walter Storm) as well as the 100% owned past producing Dunwell Mine.

The Corporation also holds the Gold Hill, Austruck-Bonanza, Ample Goldmax, Silver Side, and Glitter King properties located in other prospective areas of the province.

For further information please contact Kelvin Burton at: Phone: 403 752-4040 or Email: [email protected]. Information relating to the Corporation is available on its website at www.americancreek.com

Secular Gold Bull Resumes with Force SPONSOR: Affinity Metals $AAF.ca $SII.ca $TUD.ca $GTT.ca $AMK.ca $OSK.ca $RKR.ca

Posted by AGORACOM at 12:50 PM on Monday, May 11th, 2020
This image has an empty alt attribute; its file name is Affinity_Metals_Corp_Logo.png

Sponsor: Affinity Metals Corp. (TSX-V: AFF) is a Canadian mineral exploration company building a strong portfolio of mineral projects in North America. The Corporation’s flagship property is the drill ready Regal Property near Revelstoke, BC where Affinity Metals is making preparations for a spring drill program to test two large Z-TEM anomalies. Click Here for More Info

COVID-19: The Pin that Punctured the Credit Balloon

Gold is on the cusp of breaking out to all-time highs in U.S. dollars and has already done so in virtually every other currency. Gold mining stocks continue to lag the metal and, in our opinion, represent a compelling investment opportunity at this moment. The COVID-19 pandemic panic was merely the black swan that punctured a financial market asset bubble that took almost a decade to inflate.

Think of the pandemic as the pin that punctured the credit balloon. In a few months, the pandemic will ease (hopefully) with the formulation of a COVID-19 vaccine, widespread testing and other responses that will surely come from the healthcare industry. However, the fiscal and monetary policy damage committed by all governments to save the world has created a debt hangover that will linger for years. Economic growth will rebound but only to subpar levels once extreme health-related restrictions are lifted and “stimulus” kicks in.

The requisites for robust economic growth most likely to misfire are investment confidence and bank lending. Both have been severely compromised. Whether this landscape evolves into a long stretch of deflation or combusts into untamed inflation remains to be seen. What seems quite apparent is that traditional Keynesian stimulus measures are in their endgame. They will most likely deliver only steadily diminishing returns. Starkly opposite economic outcomes are possible from this policy morass; both would be positive for gold but negative for real returns on fixed income or equities.

Q1 Marks a Pivotal Turning Point for All Asset Classes

As of this writing, gold is trading about 10% less than its all-time high of US$1,900 attained nine years ago (September 2011). In effect, it has gone nowhere for a decade despite a tectonic shift in the investment and economic outlook. A lengthy correction lasting until 2016 and subsequent churning resulted in the establishment of a powerful multi-year basing structure. From this base and with strong macroeconomic tailwinds, we believe new highs well above $1,900 can be achieved over the next four years.

Despite enthusiastic advocacy and much chatter from investment luminaries, including Ray Dalio, Jeff Gundlach, Seth Klarman and others, gold remains severely and inappropriately underrepresented in the portfolios of fiduciaries, endowments and family offices. Flows into channels such as gold-backed exchange traded funds (“ETFs”) have been strong relative to previous low levels, but must still be considered a trickle in terms of what could still come. 

 Figure 1. Gold-Backed ETFs Reach Record Levels
Global gold-backed ETFs added 298 tonnes and net inflows of US$23 billion in Q1 2020 — the highest quarterly amount ever in absolute U.S. dollar terms and the largest tonnage additions since 2016.
Source: World Gold Council. Data as of 3/31/2020.

In our opinion, the first quarter of 2020 will mark a pivotal, secular turning point for all major asset classes including equities, bonds, gold and currencies. A return to the pre-2020 financial market normalcy and investment complacency is unlikely. In our view, consensus hopes remain high that the credit smash is only a temporary repercussion of the health scare. We disagree and suggest the effects will be long lasting.

Despite the solid price gains achieved by gold in the past two years, there is much more upside to come as investors gradually give up on repeated equity market bottom fishing and the hope of a return to financial market normalcy. A full reversal to the previous complacency cannot take place following a brief crash. The mood change will more likely become pervasive after grueling stretches of disappointing returns from previously successful investment strategies.

Unprecedented Central Bank Monetary Expansion

In our view, the decade preceding 2020 was characterized by the systematic stifling of price discovery for interest rates and the appropriate dependent valuations for financial assets. Such distortion was made possible only by unprecedented central bank balance sheet expansion that encouraged, abetted and rewarded risk taking in the form of ever greater leverage.

The prolonged somnolence of gold was among the most egregious price distortions of the previous decade and this suppressed interest in the metal as a risk mitigator and portfolio diversifier. Disinterest was fed in large part by the nearly universal expectation that the past would always be prologue and that highly leveraged financial and economic structures would perpetually result in outsized returns. In our view, the greatest change stemming from the credit bust will be a mood shift or paradigm change in the opposite direction.

At gold’s previous peak in 2011, the combined balance sheets of the U.S. Federal Reserve (“U.S. Fed”) and the European Central Bank (“ECB”) totaled approximately US$5.5 trillion. Today, that number is more than $11.4 trillion and rapidly moving higher. The USD gold price is still lower than nine years ago. In our view, gold price is still well below where it should be and will likely trade higher in the new macro landscape.

 Figure 2. Pandemic Policy Response Pushes Global Balance Sheets to Record Levels
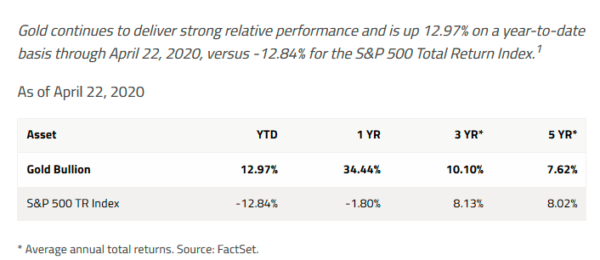
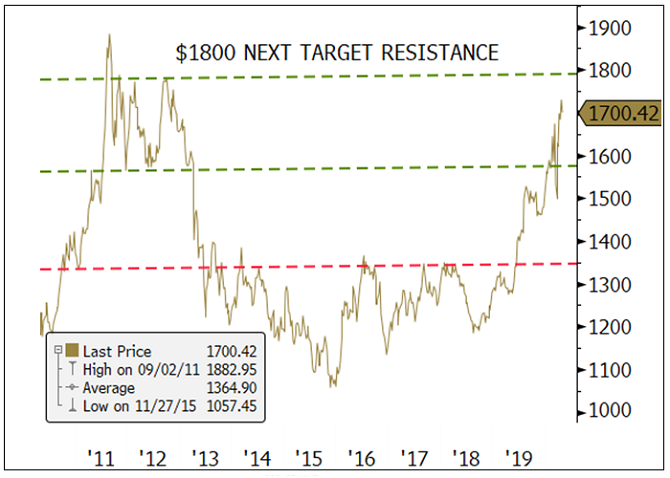
Source: Bloomberg. Data as of 3/31/2020.
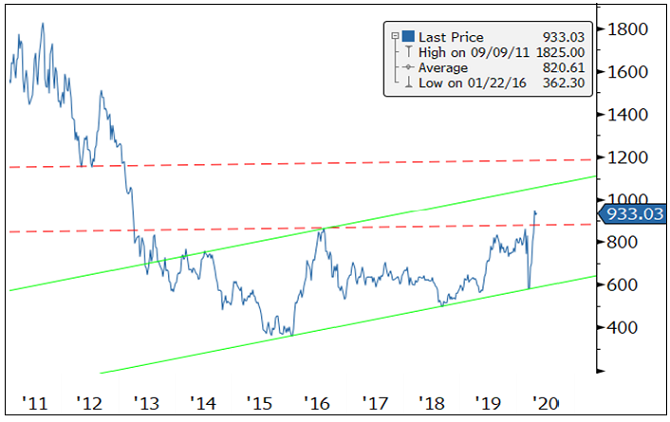
Gold Mining Stocks are Inexpensive

If gold is not correctly priced for what has transpired and what lies ahead, gold mining stocks are even more inappropriately priced. Based on current metal prices, most companies are generating positive earnings and cash flow and in many cases, free cash flow that can be applied to higher dividend payouts. Compared to other sectors of the economy, the gold mining industry stands almost alone in looking forward to strong 2020 earnings and a positive outlook for 2021.

2020 free cash flow yields for large-cap producers range from 3%-7% and 6%-25% for intermediate producers based on conventional sell-side research. The stats are similar or better for 2021 based on spot gold prices. As Figure 3. shows, mining stocks are inexpensive in absolute terms and have never been so cheap relative to the gold price. 

Figure 3. Gold Equities Are Undervalued Relative to Bullion
Ratio of XAU Index to Spot Gold (12/23/1983-3/31/2020)

Since 2008, the relative valuation of gold equities to gold bullion has fallen 75% from the prior 25-year average. The ratio of the XAU Index to spot gold averaged 0.2497x for a quarter century through 2008. As of 3/31/2020, the ratio was 0.0501x.

It is undoubtedly true that the industry will suffer health-related mine shutdowns and other shortfalls this year. Much of the disruption potential has already been broadcast and priced into the market. Some downside news may still have yet to surface. However, most miners are not financially levered and should be able to survive a few quarters of lower or no production. Unlike the airline, leisure, retail and manufacturing sectors, gold not produced today should grow in value and be produced at higher prices and lower costs next year and those beyond. It is not the same story for many other sectors of the economy. Based on fundamentals, gold stocks are inexpensive. By contrast, several other sectors of the economy could face long stretches of poor earnings, bad news flow and financial woes.

The gold mining sector registered a decline of approximately 20% in Q1 (as measured by GDX2) as shares did get battered by indiscriminate liquidations during March. However, as of this writing, two weeks after the close of the quarter, most shares trade near to where they stood at the beginning of the year, and have certainly registered outstanding performance in relative terms. It is remarkable that the largest sector ETF, GDX, suffered outflows of $381 million3 during the quarter at what could be the threshold of an upside breakout. In a favorable cycle for the gold price, mining stocks have historically delivered outperformance 3 to 5 times that of the metal itself.

Gold mining shares continue to be viewed by investors with deep skepticism as reflected by valuation and flows. When we scan Figure 4, it appears to us that the sector is on the verge of an upside breakout from a multi-year base should our assessment of the macroeconomic environment prove correct.

Figure 4. NYSE Arca Gold BUGS Index (HUI4)

Monetary and Fiscal Policy Going Ballistic

There is no need to belabor the obvious. However, the consequences of these actions have yet to be priced into the financial markets or gold. The risk parity trade has fallen short, partly because bonds were caught up in the indiscriminate liquidations of Q1. Looking forward, bonds may no longer be able to play the safe haven role they traditionally filled to balance equity risk. The vacuum could be filled in part by increased gold exposure for all classes of investors. Sovereign credit liquidity injections are likely to remain significant and permanent. The bond market has become socialized. Owning Treasury bonds of any duration could become akin to parking Treasury bills, with little upside and considerable risk of impairment through inflation. Gold is the antidote to the fixed-income investor’s dilemma.

Gold is extremely under-owned, under-represented, and poorly thought of in the circles of conventional investment thinking. It is still considered to be a fringe asset. Just ask Goldman Sachs which recently advised its clients:

 “We concluded then (2010) that gold does not have a role as a strategic asset class in clients’ already well-diversified portfolios. We have updated the research and the evidence is even more compelling today than it was then.” (4/5/2020; Goldman Sachs Investment Strategy Group)

We remind the reader that Goldman is the same firm that in December 2019 declared the U.S. economy to be “recession proof” and then in March 2020 cautioned that stocks had substantial further downside:

“Overall, the changes underlying the Great Moderation appear intact, and we see the economy as structurally less recession prone today.” (12/31/2019; Goldman economists Jan Hatzius and David Mericle)

“Goldman Sachs on Friday dramatically cut its U.S. economic forecast, saying it now expects GDP to decline by 25% in the second quarter of 2020 because of the coronavirus panic.” (3/20/2020; Business Insider)

“What is your estimate for the S&P 500 by yearend 2020? David Kostin, “3400.” (1/2020; GS Podcast, David Kostin Goldman, U.S. chief equity strategist and Jake Siewert) 

“Kostin thinks the market goes lower. ‘In the near term, we expect the S&P 500 will fall towards a low of 2000.’” (3/22/2020; Yahoo Finance)

Goldman’s commentary is, in our opinion, a reasonable proxy for conventional wisdom. One could easily find other embarrassing examples of mainstream thinking ignorant of the best-performing asset class (by far) versus equities and bonds since 2000.

Contrarians and value investors, take note! The secular gold bull that began in 2000 and corrected for a few years has returned to life with renewed vigor. Pullbacks — price declines during this uptrend — should be bought. The setup for gold and gold mining shares ticks every box for highly rewarding investment returns.

Figure 5. Gold Has Outperformed Stocks, Bonds and USD over the Past 20 Years
Returns for Period from 12/31/1999-4/13/2020

Source: Bloomberg. Period from 12/31/1999-4/20/2020. Gold is measured by GOLDS Comdty; US Agg Bond Index is measured by the Bloomberg Barclays US Agg Total Return Value Unhedged USD (LBUSTRUU Index); S&P 500 TR is measured by the SPX; and the U.S. Dollar is measured by DXY Curncy. Past performance is no guarantee of future results.

Figure 6. Gold Provides Portfolio Diversification
Gold provides diversification in a portfolio, and has low correlation with other asset classes. The period measured is April 1, 2015 to April 1, 2020.


* Source: World Gold Council. Period from April 1, 2015 to April 1, 2020, based on monthly returns. Gold is measured by the LBMA Gold Price; stocks by the S&P 500 Index; commodities by the Bloomberg Commodity Index;  Bonds by the BarCap Treasuries and Corporates.

1The S&P 500 or Standard & Poor’s 500 Index is a market-capitalization-weighted index of the 500 largest U.S. publicly traded companies. You cannot invest directly in an index. TR, “Total Return”, represents the index with dividend income reinvested.
2VanEck Vectors Gold Miners ETF (GDX) seeks to replicate the NYSE Arca Gold Miners Index (GDMNTR), which is intended to track the overall performance of companies involved in the gold mining industry.
3Source: ETFtrends.com.
4The NYSE Arca Gold BUGS Index (HUI) is a modified equal dollar weighted index of companies involved in gold mining.

SOURCE: https://sprott.com/insights/sprott-gold-report-secular-gold-bull-resumes-with-force/#

American Creek $AMK.ca Reports Commencement of 20,000m Drill Program on Its JV Treaty Creek Property in the Golden Triangle $TUD.ca $SII.ca $GTT.ca $AFF.ca $SEA.ca $SA $PVG.ca $AOT.ca $ESK.ca

Posted by AGORACOM at 11:05 AM on Monday, May 11th, 2020
  • The length of the northeast axis of the Goldstorm System is over 850 meters
  • The Southeast axis is at least 600m
  • The system remains open in both dimensions, as well as to depth.
  • The strongest mineralization encountered to date is from two consecutive 150m step-out holes at the northeast end of the drill grid: GS-19-42 yielded 0.849 g/t Au Eq over 780 m with the 300 Horizon averaging 1.275 g/t Au Eq over 370.5m and GS-19-47 yielded 0.697 g/t Au Eq over 1,081.5m with the 300 Horizon averaging 0.867 g/t Au Eq over 301.5m.
  • Program focused on expanding the mineralized area from these two very encouraging step-out holes.
  • Furthermore, we plan to continue advancing along the NE axis with yet another 150 meter step out hole. The best results from the southeast dimension came from GS-19-52 which yielded 0.783 g/t Au Eq over 601.5m with 1.062 g/t Au Eq over 336.0m within the 300 Horizon.

Cardston, Alberta–(Newsfile Corp. – May 11, 2020) – American Creek Resources Ltd. (TSXV: AMK) (“the Corporation”) is pleased to report that its JV partner Tudor Gold Corp has begun this season’s diamond drill hole program at its flagship property, Treaty Creek, located in the heart of the Golden Triangle of Northwestern British Columbia. Diamond drilling has begun with two drill rigs on the Goldstorm Zone which is on-trend from Seabridges’ KMS Project located just five kilometers to the southwest. These first two drills have begun drilling the initial holes of the 20,000 meter exploration program.

Tudor Gold’s Vice President of Project Development, Ken Konkin, P.Geo., states: “We are very proud of the hard work and dedication that our crews exhibited during the weeks prior to the start of drilling. Due to their diligence in preparing the camp we have been able to start our drill program a month earlier than last year’s program. The priority is to continue to expand the Goldstorm System to the southeast and to the northeast.”

“The current known length of the northeast axis of the Goldstorm System is over 850 meters, and the southeast axis is at least 600 m; the system remains open in both dimensions, as well as to depth. The strongest mineralization encountered to date is from two consecutive 150m step-out holes at the northeast end of the drill grid: GS-19-42 yielded 0.849 g/t Au Eq over 780 m with the 300 Horizon averaging 1.275 g/t Au Eq over 370.5m and GS-19-47 yielded 0.697 g/t Au Eq over 1,081.5m with the 300 Horizon averaging 0.867 g/t Au Eq over 301.5m. Our program will be focused on expanding the mineralized area from these two very encouraging step-out holes. Furthermore, we plan to continue advancing along the NE axis with yet another 150 meter step out hole. The best results from the southeast dimension came from GS-19-52 which yielded 0.783 g/t Au Eq over 601.5m with 1.062 g/t Au Eq over 336.0m within the 300 Horizon.

(The above results were from Tudors news release dated March 3rd, 2020,, in which the following metal prices were used to calculate the Au Eq metal content: Gold $1322/oz, Ag: $15.91/oz, Cu: $2.86/lb. Calculations used the formula Au Eq g/t = (Au g/t) + (Ag g/t x 0.012) + (Cu% x 1.4835). All metals are reported in USD and calculations do not consider metal recoveries. True widths have not been determined as the mineralized body remains open in all directions. Further drilling is required to determine the mineralized body orientation and true widths.)

Tudor Gold and its associated service companies have taken extreme measures to maintain the highest professional standards while working under COVID-19 health and safety protocols. Only essential personnel are permitted to enter the camp and staging areas. An on-site certified paramedic conducts strict daily monitoring of temperatures and general health conditions of personnel and service providers who are working at the project site and the staging area.


Walter Storm, Tudor President and CEO, stated: “I am very pleased with the safe start-up of the 2020 exploration program thanks to the hard work and dedication of our crews. The Company’s intent is to advance the Treaty Creek Project with full recognition and confidence in the recommended COVID-19 safety protocols. The goal for this year is to complete enough drilling that we can begin to delineate a first resource estimation at Treaty Creek.”

Darren Blaney, American Creek President and CEO stated: “2019 was a very successful year at Treaty Creek and this year looks to be far better with an extension of the drilling season and a drill program that is over twice as big as last years. With the recent announcement of working towards a resource calculation along with baseline studies and metallurgical work for an initial economic assessment, Mr Storm was right in calling this a transformational year at Treaty Creek.”

Qualified Person

The Qualified Person for this news release for the purposes of National Instrument 43-101 is the Companys Vice President of Project Development, Ken Konkin, P.Geo. He has read and approved the scientific and technical information that forms the basis for the disclosure contained in this news release.

Treaty Creek JV Partnership

The Treaty Creek Project is a Joint Venture with Tudor Gold owning 3/5th and acting as operator. American Creek and Teuton Resources each have a 1/5th interest in the project creating a 3:1 ownership relationship between Tudor Gold and American Creek. American Creek and Teuton are both fully carried until such time as a Production Notice is issued, at which time they are required to contribute their respective 20% share of development costs. Until such time, Tudor is required to fund all exploration and development costs while both American Creek and Teuton have “free rides”.

Treaty Creek Background

The Treaty Creek Project lies in the same hydrothermal system as Pretium’s Brucejack mine and Seabridge’s KSM deposits with far better logistics.

Sulphurets Hydrothermal System

https://orders.newsfilecorp.com/files/682/55669_1e096bdf247ef89b_001.jpg

To view an enhanced version of this graphic, please visit:
https://orders.newsfilecorp.com/files/682/55669_1e096bdf247ef89b_001full.jpg

About American Creek

American Creek is a Canadian junior mineral exploration company with a strong portfolio of gold and silver properties in British Columbia. Three of those properties are located in the prolific “Golden Triangle”; the Treaty Creek and Electrum joint venture projects with Tudor Gold/Walter Storm as well as the 100% owned past producing Dunwell Mine.

More information about the Treaty Creek Project can be found here: https://americancreek.com/index.php/projects/treaty-creek/home

The Corporation also holds the Gold Hill, Austruck-Bonanza, Ample Goldmax, Silver Side, and Glitter King properties located in other prospective areas of the province.

For further information please contact Kelvin Burton at: Phone: 403 752-4040 or Email: [email protected]. Information relating to the Corporation is available on its website at www.americancreek.com

INTERVIEW: Loncor Resources $LN.ca Is The Small Cap With 2 Mega Producers Behind It $ABX.ca $TECK.ca $RSG $NGT.to $GOLD $NEM

Posted by AGORACOM-JC at 8:43 PM on Sunday, May 10th, 2020
This image has an empty alt attribute; its file name is Loncor-Small-Square.png

Loncor Resources ( LN:TSX ) is the preeminent gold exploration company to own. Armed with a Barrick JV on their 200km NGAYU Greenstone property anticipates a maiden drill program on multiple targets in 2020. Loncor controls 3.6 million ounces of high grade gold outside of this relationship.

If the JV and Ounces aren’t enough to grab your attention, then look at ownership; African Majors own impressive pieces of Loncor:

Resolute Mining owns 27% and has a 30% ROFR on any Loncor financing, 

Newmont Goldcorp Corporation owns 7.8% of Loncor’s outstanding shares;

and Management ownership is loudest with Arnold Kondrat.  Founder, Chief Executive Officer and director with 28,963,909 shares (or 28.45%).

Loncor is hunting for elephant deposits in elephant country and are inviting everyone for the ride. Grab your favourite beverage and have a listen.

Barrick Eyes Deals as Profit Surges 55% on Higher Gold Prices SPONSOR: Loncor Resources $LN.ca $ABX.ca $TECK.ca $RSG $NGT.to $GOLD $NEM

Posted by AGORACOM at 10:27 AM on Friday, May 8th, 2020

Sponsor: Loncor, a Canadian gold explorer controlling over 3.6 million high grade ounces outside of a Barrick JV. The Ngayu JV property is 200km southwest of the Kibali gold mine, operated by Barrick, which produced 814,000 ounces of gold in 2019. Barrick manages and funds exploration at the Ngayu project until the completion of a pre-feasibility study on any gold discovery meeting their Tier One investment criteria. Newmont $NGT $NEM owns 7.8%, Resolute $RSG owns 27% Management owns 29% Click Here for More Info

This image has an empty alt attribute; its file name is Loncor-Small-Square.png
  • Concerns about the health of the global economy due to the coronavirus pandemic have boosted ‘safe-haven’ gold by 12%

Barrick Gold Corp posted a nearly 55 per cent rise in quarterly profit on Wednesday as gold prices surged, bolstering its ability to snap up mines including in copper, its chief executive said.

Concerns about the health of the global economy due to the coronavirus pandemic have boosted “safe-haven” gold by 12 per cent so far this year, while copper, seen as a bellwether for economic health, is down about 15 per cent.

Barrick CEO Mark Bristow has previously said the world’s No. 2 gold miner could raise its exposure in copper because of its expected higher use in electrification.

He added on Wednesday the relative price performance between copper and gold made deals more attractive.

“(A stronger balance sheet) improves our capacity to take up opportunities that might arise in the short to medium term given the dynamic nature of the global economy,” Bristow told Reuters.

He did not elaborate, but has expressed an interest in acquiring Freeport-McMoran Inc’s flagship Grasberg mine.

Barrick, which maintained its quarterly dividend of 7 cents per share, trimmed its annual production forecast for gold after shutting its mine in Papua New Guinea.

The Canadian miner now expects attributable gold production of 4.6-5.0 million ounces versus 4.8-5.2 million previously.

The government of Papua New Guinea announced in April it would not renew a 20-year special mining lease for the Porgera gold mine, which is jointly owned by Barrick and China’s Zijin Mining, due to environmental damage and social unrest.

Barrick (Niugini) Limited, the local venture in which both miners have a 47.5 per cent stake, had produced about 597,000 ounces of gold in 2019 from the Porgera mine.

Barrick has said it will contest the move, which it regards as “tantamount to nationalization without due process,” and in the meantime has placed Porgera on temporary care and maintenance, while suspending 2020 guidance for the mine.

Bristow said a mediator would be appointed to help negotiations if initial talks between the government and Barrick failed.

The company, with operations in North and South America and Africa, has not closed any of its mines due to coronavirus restrictions which have hit competitors.

Larger rival Newmont, which was forced to shutter some mines in Canada and South America, warned on Tuesday of a financial hit in the second quarter.

Barrick’s first quarter production fell 9 per cent to 1.25 million ounces. Excluding one-off items, Barrick reported a profit of 16 cents per share, in line with analyst estimates.

Source: https://business.financialpost.com/commodities/mining/barrick-reports-55-higher-adj-profit-helped-by-gold-prices 

Gold Stocks Take Flight SPONSOR: Labrador Gold $LAB.ca $RIO.ca $WHM.ca $SIC.ca $NXS.ca

Posted by AGORACOM at 10:02 AM on Friday, May 8th, 2020

SPONSOR: Labrador Gold – Two successful gold explorers lead the way in the Labrador gold rush targeting the under-explored gold potential of the province. Exploration has already outlined district scale gold on two projects, including a 40km strike length of the Florence Lake greenstone belt, one of two greenstone belts covered by the Hopedale Project. Recently acquired 14km of the potential extension of the new discovery by New Found Gold’s Queensway project to the south. Click Here for More Info

  • Gold Bullion Surges above March Lows
  • Gold Mining Equities Track Gold Higher
  • Gold Mining Equities vs. S&P 500 Show Convincing Breakout

Markets Recalibrate

Capital markets and society continue to recalibrate from the enormity of the fallout of the COVID-19 pandemic. As difficult as the current situation is, gold fundamentals continue to improve. Gold, as an investment, offers a hedge against the current financial turmoil and has significant capital appreciation potential in the years ahead.

The magnitude of central banks and government actions over the past several weeks will resonate for the rest of this decade. In our March commentary (March Roars in Like a Lion), we mentioned that we are now in the “end game” where debt explodes in the face of a financial calamity (although no one predicted that it would be a pandemic). We will discuss what near-term options the U.S. Federal Reserve (“Fed”) will likely implement, and how gold is likely to respond. We will also look at the recent move higher for gold mining equities.

Gold Bullion: Increased Demand for Physical Gold

Gold bullion ended April at $1,687, adding $109/oz, or +6.9% for the month. Gold began its surge in early April as physical delivery shortages resulted in gold futures (COMEX, New York) trading wildly higher than spot gold (London). COVID-19 has caused refining capacity for gold to decline and greatly restricted the transport of physical gold from London to New York. Typically, gold futures trade fairly tight with spot gold due to arbitrage, but in early April, the spreads spiked as high as $70/oz. The unprecedented fiscal and monetary policy response to the worst economic shock since the Great Depression has put gold squarely into investors’ minds.

Gold is almost always in contango (longer-dated contracts are more expensive than the near month). In April, parts of the gold futures curve traded in a rare backwardation (the near month contract is more expensive), usually indicative of a supply shortage. With the usual gold channels disrupted, futures are pulling spot prices higher as short positions are closed by going long futures. Compounding the disruption was the growing demand for gold in physical form, fueled by soaring investor buying interest. The unprecedented fiscal and monetary policy response to the worst economic shock since the Great Depression has put gold squarely into investors’ minds.

Figure 1. Gold Bullion Surges above March Lows
Our short-term target is $1,800, and we expect to reach new all-time highs.


Source: Bloomberg. Data as of 4/30/2020.

Gold Mining Equities: Convincing Breakout in April

Gold equities broke out of a multi-year resistance level on massive buying flows. Using the NYSE Arca Gold Miners Index (GDM)5 as a reference, the 860 index resistance level was taken out convincingly. As shown in Figure 2, there is very little meaningful resistance until 1,200 (+25%). In March, gold equities, like bullion, experienced a forced liquidation event. Selling in GDX forced the ETF to trade at a significant discount to its underlying net asset value (NAV). Like many other ETFs, the selling volumes in GDX outpaced the liquidity in the underlying securities. Off the lows, the price action as measured by volume, breadth and money flow far exceeds the bullish thrust of the 2019 summer rally. This breakout, without question, is impressive on the technical measures.

Figure 2. Gold Mining Equities Track Gold Higher
The NYSE Arca Gold Miners Index (GDM) has broken out of a broad base pattern; our short-term target is 1,200.


Source: Bloomberg. Data as of 4/30/2020.

The absolute price action is impressive, but when measured relative to the S&P 500 Index6 (Figure 3), the chart pattern looks even more impressive. Typically, new market leadership is more evident when measured against the broad market index. As shown in Figure 3, the NYSE Arca Gold Miners Index (GDM) relative to the S&P 500 Index has put in a very bullish bottom base pattern. There is a double bottom pattern set up with the right bottom shaping a head and shoulder breakout pattern. This bullish pattern within a bullish pattern is a very positive sign.

Figure 3. Gold Mining Equities vs. S&P 500 Show Convincing Breakout
GDM is putting a remarkable long-term basing chart pattern and breaking out in the medium term.


Source: Bloomberg. Data as of 4/30/2020.

Increasing Revenue with Deflationary Input Costs

The gold mining industry, like many other industries, is experiencing disruptions due to pandemic shutdowns. But unlike other industries, gold producers are experiencing a steep increase in the selling price of its product. Gold bullion is up +11% year to date and up over +31% year-over-year (through April 30, 2020). From a cost perspective, energy and labor are typically the two highest cost components for miners. The dramatic fall in crude oil is a rare function of both a supply shock (the Organization of the Petroleum Exporting Countries [OPEC] price war) and a demand shock (pandemic shutdowns) co-occurring. The enormity of both events will have lasting price consequences well beyond a few quarters. Labor, the other component, has been devastated by the pandemic. A tremendous labor crisis is occurring globally. In the U.S. alone, jobless claims have now exceeded 30 million, a crushing toll. Both of these conditions are deflationary shockwaves that will ripple out to all corners of the economy. There is virtually no major cost component (reagents, consumables, equipment) that will not see lower costs. Though near-term gold company earnings may be volatile due to COVID-19 disruptions, the potential increase in long-term profit margins may be unlike anything seen in recent history, and most comparable to the 1930s when gold company revenues soared and costs plummeted.

As QE (quantitative easing) Infinity continues to expand and ZIRP (zero interest rate policy) takes hold in a likely recession (or depression), growth equities will become highly sought after. Gold mining equities will have one of, if not the highest growth in earnings of any industry. Because of the nature of its revenue product (gold bullion), and its input costs (deflation), gold equities will likely develop into a convexity trade. Relative to the broad market, gold mining equities have a more direct path to higher prices. In the absence of earnings and post liquidity lift, general market equities require QE to increase stock prices by suppressing the risk-free rate and credit spreads, thereby reducing the discount rate used to calculate the present value of cash flows. Currently, cash flows are near impossible to forecast. The broad market equity risk is if earnings do not recover for more than a year due to COVID-19 and/or if a risk event pushes up credit spreads (i.e., credit defaults). Both risks are quite high compared to the risk for gold mining equities.

The Likely Market Impact of the Fed Stimulus and Fiscal Policy Response

At the end of April, the Fed Balance Sheet had expanded to $6.66 trillion (previous high was $4.5 trillion) and will climb higher. The final number is unknown due to moving variables and the lack of visibility, but $10 trillion by summer is in the ballpark. The deficit for 2020 is estimated to be $3.7 trillion (18% to 20% of gross domestic product [GDP]), an all-time high with risk to the upside. The debt-to-GDP current expected range of 110% to 120% will probably prove to be too low despite being the highest ever. More billions of dollars, week by week, are being added to a dizzying array of Federal programs, credit facilities and swap lines to mitigate the damage of the pandemic.

The amount of debt is genuinely numbing in its size and scale and will keep growing. Long term, there is very little hope that the economy can grow out of this debt load. To manage this debt, we believe the Fed will need to implement three broad conditions: 1) negative real yields, longer and lower than previously expected; 2) yield curve control to maintain a flat and low rate structure, and 3) a weaker or capped U.S. dollar.

1) Negative Real Interest Rates

We have discussed numerous times the importance of negative real interest rates in reducing (debasing) the debt. The huge increase in debt levels and the likely lingering effects of COVID-19 on the global economy will assure that negative real interest rates will be here for years. There will be a persistent and growing erosion of wealth via negative real yields.

Figure 4. U.S. Real Yields Near Zero
The Fed Funds target rate is 0.00-0.25%, and real yields are approximately -0.43%. Gold tends to thrive in low-interest rate environments. 

Source: Bloomberg. Data as of 5/5/2020. Nominal yields are measured by the USGG10YR Index, representing U.S. generic 10-year bond yields. Real yields are measured by USGGT10Y Index, representing U.S. 10-year TIPs (Treasury Inflation Protected) yields. The FDTR Index represents the Federal Funds Target Rate, which is set by the central bank in its efforts to influence short-term interest rates as part of its monetary policy strategy.

2) Yield Curve Control

Yield curve control was last used during World War II to finance the war. As the term implies, the U.S. government exerted control on both ends of the curve. Yields were capped with the short end lower than the long end. The long end was capped at around 2% irrespective of the economic condition. Controlled low yields provided a stable and manageable interest expense. By issuing more Treasuries in the short end, the government encouraged investors to borrow at the short end and to lend in the long end. Also, by issuing more at the short end of the curve, it ensured there was constant ample liquidity searching for yield. Today’s world is vastly different, but we expect to see a similar effort to control the yield curve. The Fed will continue to use QE Infinity to monetize the majority of bond issuances with an effort to keep rates as low as possible and the curve as flat as possible. For example, the $2.2 trillion of fiscal stimulus announced in March has already been monetized; 10-year Treasury yields are around 0.60% and the Fed Fund Rate is at zero.

3) Lower or Capped U.S. Dollar

We have also discussed the importance of a weaker U.S. dollar in previous commentaries. The impact of the global pandemic and the total collapse of crude oil pricing has elevated the importance of the U.S. dollar significantly. The sudden deceleration in global economic activity has dramatically reduced the flow of U.S. dollars. The U.S. dollar is the world’s reserve currency; about 60% to 70% of the world’s economic activity is transacted in U.S. dollars. Crude oil is one of the most critical sources of U.S. dollar liquidity. At year-end, an oil market of 100 Mb/d (million barrels a day) at $50 per barrel equated to $1.8 trillion of yearly U.S. dollar flows. Today, at 75 MB/d at $20 per barrel, crude oil-based U.S. dollar flows are now at $0.55 trillion. Now apply that to every industry that transacts globally, and the magnitude of U.S. dollar funding shortage becomes apparent.

There is an estimated $12 to $13 trillion of U.S. dollar-denominated debt held by foreign holders. The U.S. dollar is now the biggest financial short and there is a massive ongoing short squeeze as the global shutdown makes funding and servicing of this debt difficult. That the U.S. has launched trillions in fiscal and monetary stimulus, and the U.S. dollar has barely budged is an alarming sight. A runaway U.S. dollar in a financial and economic crisis coupled with a deflationary shockwave would be nothing short of a disaster scenario. In March, we had a small taste of what a U.S. dollar funding shortage and dollar hoarding had on global liquidity.

If the Fed has any chance of making this version of MMT (modern monetary theory) work, it will do everything in its power to keep the U.S. dollar in check and control a flat yield curve. Fighting the Fed’s efforts is this significant mismatch between U.S. dollar assets and liabilities. Historically, this has been the justification to devalue the dollar (or the prevailing reserve currency at the time) to bail out the world. Price regime changes typically occur with currency debasements. If we reach the point where the U.S. dollar stages a significant uncontrolled breakout higher, gold will spike as the market begins to price in the possibility of a reset of asset prices. At that point, gold would become the ultimate convexity trade for U.S. dollar debasement. Dollar debasement is a key tail risk in the end game.

Figure 5. The U.S. Dollar (DXY): Highs of March 2020 will be a Crucial Level


Source: Bloomberg. Data as of 4/30/2020.

A Realignment of Asset Classes

In just a few months, a global pandemic has caused a shutdown of the economy to an estimated tune of -25% annualized GDP for Q2, over 30 million U.S. workers filing jobless claims and trillions of dollars (and growing) added to the debt. Whether the news of the virus gets better or worse in the next few quarters, we will be in a ZIRP environment for years due to the debt level. With the Fed capping rates, yields will remain low and the curve flat whether the economic recovery is V-shaped, U, L, or any other alphabet shape (yield curve control). The economy will no longer determine the level of interest rates and the yield curve. The Fed will keep real interest rates negative; the only question is how negative? Investing in Treasuries has moved from a “return on capital” to a “return OF capital” proposition. Investing in Treasuries today is an erosion of wealth in real dollar terms.

The broader U.S. stock market has now recovered a significant part of its decline entirely due to the sheer amount of stimulus thrown by the Fed. To value the equity market today would require a look past a deep valley of uncertain duration, to the other side that may be changed entirely. As companies pull guidance due to the lack of visibility, equities can only rise mainly by never-ending liquidity. Equity valuations are already back to their all-time highs. Equity markets, like the bond market, will continue to decouple from the economy further.

Gold Makes Sense as Equity Volatility Increases 

Moreover, if we are correct that the Fed’s main risk focus is containing the U.S. dollar and controlling the yield curve, equity risk (volatility) will trade higher vis-a-vis the U.S. dollar and bond prices than historical parameters (Figure 5). If this becomes the new reality, this repricing of volatility will have a dramatic effect on all asset classes. It will mean more effective equity hedges will be needed, such as gold. The one risk that the Fed cannot remove entirely is a tail risk event in which this current environment is a breeding ground.

Figure 6. Equity Risk Volatility is Trading Higher than Bond Volatility
The VIX7 (CBOE Volatility Index for equities) has likely entered into a new trading range relative to the MOVE Index8 (Implied volatility of Treasuries across the yield curve) with far-reaching consequences.


Source: Bloomberg. Data as of 4/30/2020.

SOURCE: https://sprott.com/insights/gold-stocks-take-flight/

https://sprott.com/insights/gold-stocks-take-flight/

Scotiabank’s Metals Business Closure Could Impact Daily Gold Price Discovery SPONSOR: Labrador Gold $LAB.ca $RIO.ca $WHM.ca $SIC.ca $NXS.ca

Posted by AGORACOM at 11:03 AM on Wednesday, April 29th, 2020

SPONSOR: Labrador Gold – Two successful gold explorers lead the way in the Labrador gold rush targeting the under-explored gold potential of the province. Exploration has already outlined district scale gold on two projects, including a 40km strike length of the Florence Lake greenstone belt, one of two greenstone belts covered by the Hopedale Project. Recently acquired 14km of the potential extension of the new discovery by New Found Gold’s Queensway project to the south. Click Here for More Info

  • We were already having a tough time getting the amount of physical that we require. I think it’s going to be that much harder – Sprott Inc CEO Peter Grosskopf

(Kitco News) Turbulent times of first trying to sell, then downsizing its bullion desk, Canadian Bank of Nova Scotia (Scotiabank) (TSX: BNS.TO) now appears to be closing its metals business, according to Reuters. 

Reports came to light on Tuesday with Reuters citing two sources familiar with the matter. “Scotia had a global call with all its metals staff and said it was shutting down its metals business,” one source said. “The plan is to unwind the metals business,” said another one.

The goal is to reportedly wind down all existing metals business by the beginning of 2021, the sources added.

The move could mean more challenges for the gold market that has already seen a supply crunch and wide price spreads between spot and futures prices, analysts told Kitco News. 

“The Scotiabank shuttering of its metals business is a sign of these historic times of markets upheaval. However, such is not a shock to the metals marketplace that has in recent weeks already seen many companies and mines so severely impacted by the Covid-19 pandemic,” said Kitco’s senior technical analyst Jim Wyckoff. 

“From my perspective the Comex futures market has at least temporarily overshadowed the spot, or cash, gold market in terms of accurate daily price discovery, given the significant slowing of spot business and spot market-making. Thus, the gold market from a price perspective will take this news in stride,” Wyckoff noted.

One fear is that spot prices could become less reliable, which could be a a big hit for the gold market that has already been struggling with a wide spread between spot and futures prices due to all the logistical issues connected with all the COVID-19 shutdowns. 

“It definitely will have an effect on price discovery. The less big banks that are participating in the metals markets, the less reliable those prices coming out of London will be, which we’ve already seen has been a problem in the past couple of weeks,” Gainesville Coins precious metals expert Everett Millman told Kitco News on Tuesday. 

The problem could be made worse if more banks like this close their bullion businesses, Millman added. “A lot of people are worried that Scotiabank is just going to be the first of many banks right now to kind of exit the metals business. We have to see if there’s a domino effect that exacerbates the problem,” he said.  

Another area of concern is some disruption on the client inter-phase side, said Kitco Metals global trading director Peter Hug.

“I would imagine Scotia has financing projects/lease agreements, metals accounts for their clients, as well as inventory financing deals with dealers. Scotia, I assume will attempt to sell these deals or handle them to maturity … Clients that may need new credit facilities, with other bullion banks or mines that have financing in place may be a bit nervous and are likely already looking for new options,” Hug said. 

The news of Scotiabank winding down its bullion desk might also add pressure to the supply side, said Sprott Inc CEO Peter Grosskopf. 

“We were already having a tough time getting the amount of physical that we require. I think it’s going to be that much harder,” said Grosskopf. “It’s almost the opposite of what’s happening in the oil market right now.” 

Other analysts said they believe that the nature of the physical market is not going to change.

RBC Wealth Management managing director George Gero said that the spot price was never really reliable because “it is not liquid and it is full cash, there is no margin.”

“Lately I’ve seen a number of banks move their trading departments or close their trading departments. A lot of it has to do with other things like Brexit. The problem of the traders all having to work remote from home,” Gero added. 

The character of investments has also been changing, he noted. “The problem with the trading of the gold is that it’s just changed a lot. But it will not affect anything because you have more central bank business and traditionally the central bank business is in the spot market.”

Back in 2017, Scotiabank tried to sell ScotiaMocatta, the world’s oldest gold trader owned by Scotiabank.

Unable to finalize the sale, however, Scotiabank ended up keeping its precious metals trading business but downsizing it at the beginning of 2018.

Only around 15 people currently work in Scotia’s metals business, Reuters said. Seventy-five percent of the employees are on the precious metals side and the rest are on the industrial metals side. Just five years ago, the unit had about 140 employees with offices across the world.

ScotiaMocatta’s history goes all the way back to 1600s when Moses Mocatta partnered with the East India Co. to ship gold to India. The operations were set up in London in 1684. In 1997, Scotiabank acquired Mocatta Bullion by purchasing it from Standard Chartered.

Source:https://www.kitco.com/news/2020-04-28/Scotiabank-s-metals-business-closure-could-impact-daily-gold-price-discovery-analysts.html

By Anna Golubova