Agoracom Blog Home

Posts Tagged ‘#Discovery’

Gold’s Outlook for 2020 – SPONSOR: American Creek Resources $AMK.ca $TUD.ca $SII.ca $GTT.ca $AFF.ca $SEA.ca $SA $PVG.ca $AOT.ca

Posted by AGORACOM at 2:20 PM on Friday, January 10th, 2020

This article is an overview of the economic conditions that will drive the gold price in 2020 and beyond. The turn of the credit cycle, the effect on government deficits and how they are to be financed are addressed.

In the absence of foreign demand for new US Treasuries and of a rise in the savings rate the US budget deficit can only be financed by monetary inflation. This is bound to lead to higher bond yields as the dollar’s falling purchasing power accelerates due to the sheer quantity of new dollars entering circulation. The relationship between rising bond yields and the gold price is also discussed.

It may turn out that the recent extraordinary events on Comex, with the expansion of open interest failing to suppress the gold price, are an early recognition in some quarters of the US Government’s debt trap.

The strains leading to a crisis for fiat currencies are emerging into plain sight.

Introduction

In 2019, priced in dollars gold rose 18.3% and silver by 15.1%. Or rather, and this is the more relevant way of putting it, priced in gold the dollar fell 15.5% and in silver 13%. This is because the story of 2019, as it will be in 2020, was of the re-emergence of fiat currency debasement. Particularly in the last quarter, the Fed began aggressively injecting new money into a surprisingly illiquid banking system through repurchase agreements, whereby banks’ reserves at the Fed are credited with cash loaned in return for T-bills and coupon-bearing Treasuries as collateral. Furthermore, the ECB restarted quantitative easing in November, and the Bank of Japan stands ready to ease policy further “if the momentum towards its 2% inflation target comes under threat” (Kuroda – 26 December).

The Bank of Japan is still buying bonds, but at a pace which is expected to fall beneath redemptions of its existing holdings. Therefore, we enter 2020 with money supply being expanded by two, possibly all three of the major western central banks. Besides liquidity problems, the central bankers’ nightmare is the threat that the global economy will slide into recession, though no one will confess it openly because it would be an admission of policy failure. And policy makers are also terrified that if bankers get wind of a declining economy, they will withdraw loan facilities from businesses and make things much worse.

Of the latter concern central banks have good cause. A combination of the turn of the credit cycle towards its regular crisis phase and Trump’s tariff war has already hit international trade badly, with exporting economies such as Germany already in recession and important trade indicators, such as the Baltic dry index collapsing. No doubt, President Trump’s most recent announcement that a trade deal with China is ready for signing is driven by an understanding in some quarters of the White House that over trade policy, Trump is turning out to be the turkey who voted for Christmas. But we have heard this story several times before: a forthcoming agreement announced only to be scrapped or suspended at the last moment.

The subject which will begin to dominate monetary policy in 2020 is who will fund escalating government deficits. At the moment it is on few investors’ radar, but it is bound to dawn on markets that a growing budget deficit in America will be financed almost entirely by monetary inflation, a funding policy equally adopted in other jurisdictions. Furthermore, Christine Lagarde, the new ECB president, has stated her desire for the ECB’s quantitative easing to be extended from government financing to financing environmental projects as well.

2020 is shaping up to be the year that all pretence of respect for money’s role as a store of value is abandoned in favour of using it as a means of government funding without raising taxes. 2020 will then be the year when currencies begin to be visibly trashed in the hands of their long-suffering users.

Gold in the context of distorted markets

At the core of current market distortions is a combination of interest rate suppression and banking regulation. It is unnecessary to belabour the point about interest rates, because minimal and even negative rates have demonstrably failed to stimulate anything other than asset prices into bubble territory. But there is a woeful lack of appreciation about the general direction of monetary policy and where it is headed.

The stated intention is the opposite of reality, which is not to rescue the economy: while important, from a bureaucrat’s point of view that is not the greatest priority. It is to ensure that governments are never short of funds. Inflationary financing guarantees the government will always be able to spend, and government-licenced banks exist to ensure the government always has access to credit.

Unbeknown to the public, the government licences the banks to conduct their business in a way which for an unlicensed organisation is legally fraudulent. The banks create credit or through their participation in QE they facilitate the creation of base money out of thin air which is added to their reserves. It transfers wealth from unsuspecting members of the public to the government, crony capitalists, financial speculators and consumers living beyond their means. The government conspires with its macroeconomists to supress the evidence of rising prices by manipulating the inflation statistics. So successful has this scheme of deception been, that by fuelling GDP, monetary debasement is presented as economic growth, with very few in financial mainstream understanding the deceit.

The government monopoly of issuing money, and through their regulators controlling the expansion of credit, was bound to lead to progressively greater abuse of monetary trust. And now, in this last credit cycle, the consumer who is also the producer has had his income and savings so depleted by continuing monetary debasement that he can no longer generate the taxes to balance his government’s books later in the credit cycle.

The problem is not new. America has not had a budget surplus since 2001. The last credit cycle in the run up to the Lehman crisis did not deliver a budget surplus, nor has the current cycle. Instead, following the Lehman crisis we saw a marked acceleration of monetary inflation, and Figure 2 shows how dollar fiat money has expanded above its long-term trend since then.

In recent years, the Fed’s attempt to return to monetary normality by reducing its balance sheet has failed miserably. After a brief pause, the fiat money quantity has begun to grow at a pace not seen since the immediate aftermath of the Lehman crisis itself and is back in record territory. Figure 1 is updated to 1 November, since when FMQ will have increased even more.

In order to communicate effectively the background for the relationship between gold and fiat currencies in 2020 it is necessary to put the situation as plainly as possible. We enter the new decade with the highest levels of monetary ignorance imaginable. It is a systemic issue of not realising the emperor has no clothes. Consequently, markets have probably become more distorted than we have ever seen in the recorded history of money and credit, as widespread negative interest rates and negative-yielding bonds attest. In our attempt to divine the future, it leaves us with two problems: assessing when the tension between wishful thinking in financial markets and market reality will crash the system, and the degree of chaos that will ensue.

The timing is impossible to predict with certainty because we cannot know the future. But, if the characteristics of past credit cycles are a guide, it will be marked with a financial and systemic crisis in one or more large banks. Liquidity strains suggest that event is close, even within months and possibly weeks. If so, banks will be bailed, of that we can be certain. It will require central banks to create yet more money, additional to that required to finance escalating government budget deficits. Monetary chaos promises to be greater than anything seen heretofore, and it will engulf all western welfare-dependent economies and those that trade with them.

We have established that between keeping governments financed, bailing out banks and perhaps investing in renewable green energy, the issuance of new money in 2020 will in all probability be unprecedented, greater than anything seen so far. It will lead to a feature of the crisis, which may have already started, and that is an increase in borrowing costs forced by markets onto central banks and their governments. The yield on 10-year US Treasuries is already on the rise, as shown in Figure 3.


Assuming no significant increase in the rate of savings and despite all attempts to suppress the evidence, the acceleration in the rate of monetary inflation will eventually lead to runaway increases in the general level of prices measured in dollars. As Milton Friedman put it, inflation [of prices] is always and everywhere a monetary phenomenon.

Through QE, central banks believe they can contain the cost of government funding by setting rates. What they do not seem to realise is that while to a borrower interest is a cost to set against income, to a lender it reflects time-preference, which is the difference between current possession, in this case of cash dollars, and possession at a future date. Unless and until the Fed realises and addresses the time preference problem, the dollar will lose purchasing power. Not only will it be sold in the foreign exchanges, but depositors will move to minimise their balances and creditors their ownership of debt.

If, as it appears in Figure 3, dollar bond yields are beginning a rising trend, the inexorable pull of time preference is already beginning to apply and further rises in bond yields will imperil government financing. The Congressional Budget Office assumes the average interest rate on debt held by the public will be 2.5% for the next three years, and that net interest in fiscal 2020 will be $390bn, being about 38% of the projected deficit of $1,008bn. Combining the additional consequences for government finances of a recession with higher bond yields than the CBO expects will be disastrous.

Clearly, in these circumstances the Fed will do everything in its power to stop markets setting the cost of government borrowing. But we have been here before. The similarities between the situation for the dollar today and the deterioration of British government finances in the early to mid-1970s are remarkable. They resulted in multiple funding crises and an eventual bail-out from the IMF. Except today there can be no IMF bail-out for the US and the dollar, because the bailor gets its currency from the bailee.

Nearly fifty years ago, in the UK gold rose from under £15 per ounce in 1970 to £80 in December 1974. The peak of the credit cycle was at the end of 1971, when the 10-year gilt yield to maturity was 7%. By December 1974, the stock market had crashed, a banking crisis had followed, price inflation was well into double figures and the 10-year gilt yield to maturity had risen to over 16%.

History rhymes, as they say. But for historians the parallels between the outlook for the dollar and US Treasury funding costs at the beginning of 2020, and what transpired for the British economy following the Barbour boom of 1970-71 are too close to ignore. It is the same background for the relationship between gold and fiat currencies for 2020 and the few years that follow.

Gold and rising interest rates

Received investment wisdom is that rising interest rates are bad for the gold price, because gold has no yield. Yet experience repeatedly contradicts it. Anyone who remembers investing in UK gilts at a 7% yield in December 1971 only to see prices collapse to a yield of over 16%, while gold rose from under £15 to £80 to the ounce over the three years following should attest otherwise.

Part of the error is to believe that gold has no yield. This is only true of gold held as cash and for non-monetary usage. As money, it is loaned and borrowed, just like any other form of money. Monetary gold has its own time preference, as do government currencies. In the absence of state intervention, time preferences for gold and government currencies are set by their respective users, bearing in mind the characteristics special to each. It is not a subject for simple arbitrage, selling gold and buying government money to gain the interest differential, because the spread reflects important differences which cannot be ignored. It is like shorting Swiss francs and buying dollars in the belief there is no currency risk.

The principal variable between the time preferences of gold and a government currency is the difference between an established form of money derived from the collective preferences of its users, for which there is no issuer risk, and state-issued currency which becomes an instrument of funding by means of its debasement.

The time preference of gold will obviously vary depending on lending risk, which is in addition to an originary rate, but it is considerably more stable than the time preference of a fiat currency. Gold’s interest rate stability is illustrated in Figure 4, which covers the period of the gold standard from the Bank Charter Act of 1844 to before the First World War, during which time the gold standard was properly implemented. With the exception of uncontrolled bank credit, sterling operated as a gold substitute.


Admittedly, due to problems created by the cycle of bank credit, these year-end values conceal some significant fluctuations, such as at the time of the Overend Gurney collapse in 1866 when borrowing rates spiked to 10%. The depression following the Barings crisis of 1890 stalled credit demand which is evident from the chart. However, wholesale borrowing rates, which were effectively the cost of borrowing in gold, were otherwise remarkably stable, varying between 2-3½%. Some of this variation can be ascribed to changing perceptions of general borrower risk and some to changes in industrial investment demand, related to the cycle of bank credit.

Compare this with dollar interest rates since 1971, when the dollar had suspended the remaining fig-leaf of gold backing, which is shown in Figure 5 for the decade following.


In February 1972 the Fed Funds rate was 3.29%, rising eventually to over 19% in January 1981. At the same time gold rose from $46 to a high of $843 at the morning fix on 21 January 1980. Taking gold’s originary interest rate as approximately 2% it required a 17% interest rate penalty to dissuade people from hoarding gold and to hold onto dollars instead.

In 1971, US Government debt stood at 35% of GDP and in 1981 it stood at 31%. The US Government ran a budget surplus over the decade sufficient to absorb the rising interest cost on its T-bill obligations and any new Treasury funding. America enters 2020 with a debt to GDP ratio of over 100%. Higher interest rates are therefore not a policy option and the US Government, and the dollar, are ensnared in a debt trap from which the dollar is unlikely to recover.

The seeds of the dollar’s destruction were sown over fifty years ago, when the London gold pool was formed, whereby central banks committed to help the US maintain the price at $35, being forced to do so because the US could no longer supress the gold price on its own. And with good reason: Figure 6 shows how the last fifty years have eroded the purchasing power of the four major currencies since the gold pool failed.


Over the last fifty years, the yen has lost over 92%, the dollar 97.6%, the euro (and its earlier components 98.2% and sterling the most at 98.7%. And now we are about to embark on the greatest increase of global monetary inflation ever seen.

The market for physical gold

In recent years, demand for physical gold has been strong. Chinese and Indian private sector buyers have to date respectively accumulated an estimated 17,000 tonnes (based on deliveries from Shanghai Gold Exchange vaults) and about 24,000 tonnes (according to WGC Director Somasundaram PR quoted in India’s Financial Express last May).

It is generally thought that higher prices for gold will deter future demand from these sources, with the vast bulk of it being categorised as simply jewellery. But this is a western view based on a belief in objective values for government currencies and subjective prices for gold. It ignores the fact that for Asians, it is gold that has the objective value. In Asia gold jewellery is acquired as a store of value to avoid the depreciation of government currency, hoarded as a central component of a family’s long-term wealth accumulation.

Therefore, there is no certainty higher prices will compromise Asian demand. Indeed, demand has not been undermined in India with the price rising from R300 to the ounce to over R100,000 today since the London gold pool failed, and that’s despite all the government disincentives and even bans from buying gold.

Additionally, since 2008 central banks have accumulated over 4,400 tonnes to increase their official reserves to 34,500 tonnes. The central banks most active in the gold market are Asian, and increasingly the East and Central Europeans.

There are two threads to this development. First there is a geopolitical element, with Russia replacing reserve dollars for gold, and China having deliberately moved to control global physical delivery markets. And second, there is evidence of concern amongst the Europeans that the dollar’s role as the reserve currency is either being compromised or no longer fit for a changed world. Furthermore, the rising power of Asia’s two hegemons continues to drive over two-thirds of the world’s population away from the dollar towards gold.

Goldmoney estimates there are roughly 180,000 tonnes of gold above ground, much of which cannot be categorised as monetary: monetary not as defined for the purposes of customs reporting, but in the wider sense to include all bars, coins and pure gold jewellery accumulated for its long-term wealth benefits through good and bad times. Annual mine production adds 3,000-3,500 tonnes, giving a stock to flow ratio of over 50 times. Put another way, the annual increase in the gold quantity is similar to the growth in the world’s population, imparting great stability as a medium of exchange.

These qualities stand in contrast to the increasingly certain acceleration of fiat currency debasement over the next few years. Anyone prepared to stand back from the financial coalface can easily see where the relationship between gold and fiat currencies is going. Most of the world’s population is moving away from the established fiat regime towards gold as a store of value, their own fiat currencies lacking sufficient credibility to act as a dollar alternative. And financial markets immersed in the fiat regime have very little physical gold in possession. Instead, where it is now perceived that there is a risk of missing out on a rise in the gold price, investors have begun accumulating in greater quantities the paper alternatives to physical gold: ETFs, futures, options, forward contracts and mining shares.

Paper markets

From the US Government’s point of view, gold as a rival to the dollar must be quashed, and the primary purpose of futures options and forwards is to expand artificial supply to keep the price from rising. In a wider context, the ability to print synthetic commodities out of thin air is a means of suppressing prices generally and we must not be distracted by claims that derivatives improve liquidity: they only improve liquidity at lower prices.

When the dollar price of gold found a major turning point on 17 December 2015, open interest on Comex stood at 393,000 contacts. The year-end figure today is nearly double that at 786,422 contracts, representing an increase of paper supply equivalent to 1,224 tonnes. But that is not all. Not only are there other regulated derivative exchanges with gold contracts, but also there are unregulated over the counter markets. According to the Bank for International Settlements from end-2015 unregulated OTC contracts (principally London forward contracts) expanded by the equivalent of 2,450 tonnes by last June, taken at contemporary prices. And we must not forget the unknown quantity of bank liabilities to customers’ unallocated accounts which probably involve an additional few thousand tonnes.

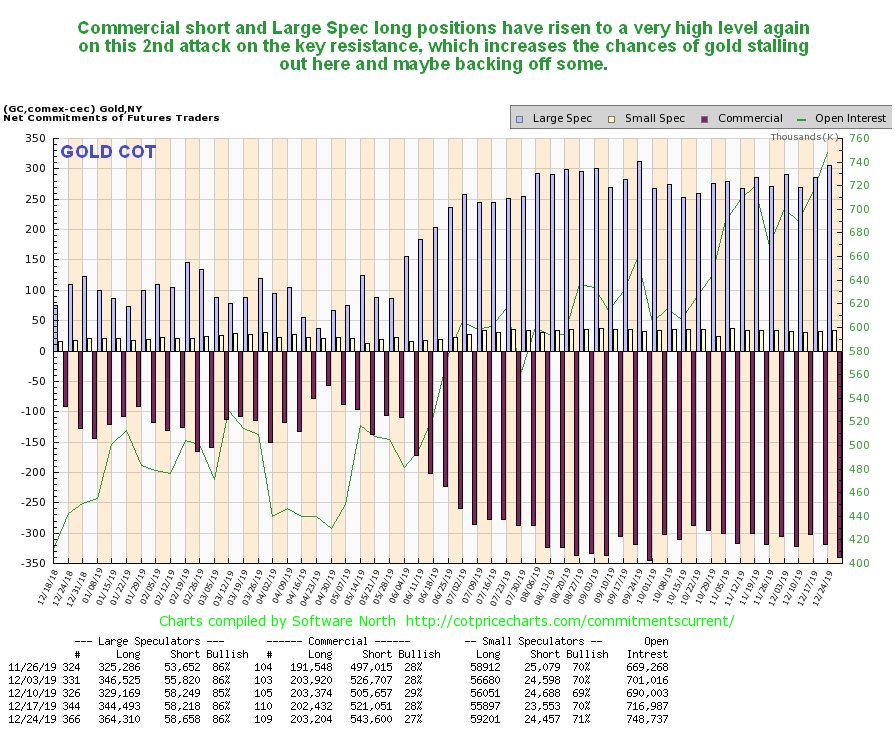
In recent months, the paper suppression regime has stepped up a gear, evidenced by Comex’s open interest rising. This is illustrated in Figure 7.


There are two notable features in the chart. First, the rising gold price has seen increasing paper supply, which we would expect from a market designed to keep a lid on prices. Secondly instead of declining with the gold price, open interest continued to rise following the price peak in early September while the gold price declined by about $100. This tells us that the price suppression scheme has run into trouble, with large buyers taking the opportunity to increase their positions at lower prices.

In the past, bullion banks have been able to put a lid on prices by creating Comex contracts out of thin air. The recent expansion of open interest has failed to achieve this objective, and it is worth noting that the quantity of gold in Comex vaults eligible for delivery and pledged is only 2% of the 2,446-tonne short position. In London, there are only 3,052 tonnes in LBMA vaults (excluding the Bank of England), which includes an unknown quantity of ETF and custodial gold. Physical liquidity for the forward market in London is therefore likely to be very small relative to forward deliveries. And of course, the bullion banks in London and elsewhare do not have the metal to cover their obligations to unallocated account holders, which is an additional consideration.

Clearly, there is not the gold available in the system to legitimise derivative paper. It now appears that paper gold markets could be drifting into systemic difficulties with bullion banks squeezed by a rising gold price, short positions and unallocated accounts.

There are mechanisms to counter these systemic risks, such as the ability to declare force majeure on Comex, and standard unallocated account contracts which permit a bullion bank to deliver cash equivalents to bullion obligations. But the triggering of any such escape from physical gold obligations could exacerbate a buying panic, driving prices even higher. It leads to the conclusion that any rescue of the bullion market system is destined to fail.

A two-step future for the gold price

It has been evident for some time that the world of fiat currencies has been drifting into ever greater difficulties of far greater magnitude than can be contained by spinning a few thousand tonnes of gold back and forth on Comex and in London. That appears to be the lesson to be drawn from the inability of a massive increase in open interest on Comex to contain a rising gold price.

It will take a substantial upward shift in the gold price to appraise western financial markets of this reality. In combination with systemic strains increasing, a gold price of over $2,000 may do the trick. Professional investors will have found themselves wrongfooted; underinvested in ETFs, gold mines and regulated derivatives, in which case their gold demand is likely to drive one or more bullion houses into considerable difficulties. We might call this the first step in a two-step monetary future.

The extent to which gold prices rise could be substantial, but assuming the immediate crisis itself passes, banks having been bailed in or out, and QE accelerated in an attempt to put a lid on government bond yields, then the gold price might be deemed to have risen too far, and due for a correction. But then there will be the prospect of an accelerating loss of purchasing power for fiat currencies as a result of the monetary inflation, and that will drive the second step as investors realise that what they are seeing is not a rising gold price but a fiat currency collapse.

The high levels of government debt today in the three major jurisdictions appear to almost guarantee this outcome. The amounts involved are so large that today’s paper gold suppression scheme is likely to be too small in comparison and cannot stop it happening. The effect on currency purchasing powers will then be beyond question. Monetary authorities will be clueless in their response, because they have all bought into a form of economics that puts what will happen beyond their understanding.

As noted above, the path to a final crisis for fiat currencies might have already started, with the failure by the establishment to suppress the gold price through the creation of an extra 100,000 Comex contracts. If not, then any success by the monetary authorities to reassert control is likely to be temporary.

Perhaps we are already beginning to see the fiat currency system beginning to unravel, in which case those that insist gold is not money will find themselves impoverished.

Source: Goldmoney Insights

https://www.goldmoney.com/research/goldmoney-insights/gold-s-outlook-for-2020

Gold-Backed ETF Holdings Hit All-Time High in 2019 SPONSOR: American Creek Resources $AMK.ca $TUD.ca $SII.ca $GTT.ca $AFF.ca $SEA.ca $SA $PVG.ca $AOT.ca

Posted by AGORACOM at 5:48 PM on Thursday, January 9th, 2020

American Creek owns a 20% Carried Interest to Production at the Treaty Creek Project in the Golden Triangle. 2019’s first hole averaged 0.683 g/t Au over 780m in a vertical intercept. The Treaty Creek property is located in the same hydrothermal system as the Pretivm and Seabridge’s KSM deposits.

https://www.mining.com/wp-content/uploads/2016/03/bank-vault-gold-900.jpg
Low-cost gold-backed ETFs in the US have seen positive flows for 18 of the past 19 months

Global gold-backed exchange-traded funds (ETFs) and similar products had $19.2 billion or 400 tonnes of net inflows in 2019 after holdings rebounded in December, the World Gold Council (WGC) reports. In the fourth quarter, ETF holdings reached an all-time high of 2,900 tonnes.

Overall, gold-backed assets under management (AUM) grew by 37% in dollar terms during the year owing to positive demand and an 18.4% increase in the gold price.

From a regional perspective, North American funds led the way with inflows of 206 tonnes ($10.1 billion, 14.4% AUM). SPDR Gold Shares – the world’s biggest gold ETF—and iShares Gold Trust accounted for nearly half of last year’s inflows.

Low-cost gold-backed ETFs in the US have seen positive flows for 18 of the past 19 months and increased their collective holdings by 60%, according to the latest WGC data.

Elsewhere, holdings in European funds increased by 188 tonnes ($8.8 billion, 13.6%), while funds listed in Asia were nearly flat, recording an outflow of 0.1 tonnes ($12 million, 0.3%). The remaining regions had combined inflows of 6.3 tonnes ($311 million, 16.3%).

Looking ahead, WGC analysts said that they expect investor demand to remain robust through 2020.

“The strength of gold was mainly the byproduct of a dovish shift in monetary policy. Our research indicates that a shift from a hawkish or neutral stance to a dovish one has historically led gold to outperform,” a WGC analyst said.

About American Creek

American Creek is a Canadian mineral exploration company with a strong portfolio of gold and silver properties in British Columbia. Three of those properties are located in the prolific “Golden Triangle”; the Treaty Creek and Electrum joint venture projects with Tudor Gold/Walter Storm as well as the 100% owned past producing Dunwell Mine.

More information about the Treaty Creek Project can be found here: https://americancreek.com/index.php/projects/treaty-creek/home

An exploration program is ongoing on American Creek’s 100% owned Dunwell Mine property located near Stewart. More information can be found here: https://americancreek.com/index.php/projects/dunwell-mine

The Corporation also holds the Gold Hill, Austruck-Bonanza, Ample Goldmax, Silver Side, and Glitter King properties located in other prospective areas of the province.

For further information please contact Kelvin Burton at: Phone: 403 752-4040 or Email: [email protected]. Information relating to the Corporation is available on its website at www.americancreek.com

Source: https://www.mining.com/gold-backed-etf-holdings-grew-14-in-2019/

Labrador Gold $LAB.ca Provides Review of 2019 Exploration and Outlines Plans for 2020 $RIO.ca $WHM.ca $SIC.ca $NXS.ca

Posted by AGORACOM at 9:52 AM on Thursday, January 9th, 2020
This image has an empty alt attribute; its file name is LAB-square-logo-2.png

Labrador Gold Corp. (TSX-V: LAB) (“LabGold” or the “Company”) is pleased to provide a review of its exploration activities completed during 2019. During 2020, LabGold intends to test the continuity of recently discovered mineralization at its Hopedale Project with a drilling program.

Roger Moss, President and CEO stated: “Exploration on both of our Labrador Projects during 2019 continued to successfully define areas of gold mineralization. These include the discovery of a new gold showing with assays from 1.67 to 8.26 g/t gold in grab samples at the Hopedale Project. This is located 500 metres along strike from the known Thurber Dog gold showing within a broader three kilometre stretch of anomalous gold in rock and soil. We look forward to continuing our systematic exploration, including drilling, of this mineralized system in 2020.”

 2019 Hopedale Project Highlights

  • Discovered a new gold showing north of the Thurber Dog gold occurrence, grab samples from which assayed between 1.67 and 8.26 g/t Au.
  • The Thurber Dog gold occurrence has assays in grab and channel samples from below detection up to 7.866 g/t Au, with 5 samples greater than 1 g/t Au and 16 samples assaying greater than 0.1 g/t Au.
  • The discovery extends the potential strike length of gold mineralization by approximately 500 metres along strike to the north.The new showing occurs within a larger 3km trend of anomalous gold in rock and soil associated with the contact between mafic/ultramafic volcanic rocks and felsic volcanic rocks.

 2019 Ashuanipi Project Highlights

  • Discovered a gold enriched zone near a high grade (8,973ppb) soil sample taken in 2018.
  • The zone is defined by anomalous gold in both soil (below detection up to 1,746ppb Au and including 12 samples over 100ppb Au) and grab rock samples (below detection up to 2.35 g/t Au) that cover an area of 450 metres by 450 metres.A second area of gold mineralization associated with garnet-bearing gossanous gneiss also shows potential.
  • Grab rock samples show values from below detection to 0.68 g/t Au with 10 samples showing values greater than 0.1 g/t Au over an area of 200m by 120m within a larger anomalous area of gold in soil samples.

 Note that grab samples are selected samples and are not necessarily representative of mineralization on the properties. 

Location of the new showing, Thurber Dog, Thurber North and Thurber South occurrences within the 3km long mineralized Thurber trend:

New Showing with rusty zones due to the presence of pyrite and arsenopyrite:

What to expect in 2020

Hopedale Project

Exploration at Hopedale during 2020 will focus on determining the extent of the Thurber Dog mineralized trend. Such work would aim to fill in the gaps between showings over the three-kilometre strike length with sampling and VLF-EM surveys. LabGold also intends to carry out an initial drill program targeting prospective areas along this trend, including the new showing.

Ashuanipi Project

LabGold’s priority at Ashuanipi is to reach an agreement with the Matimekush-Lac John First Nation to enable continued exploration of the property. The 2019 election of the new Chief and Council has been challenged in Federal Court in Quebec with a court date scheduled for the end of February. As such, community engagement and negotiations are on hold until the court case is settled.

Borden Lake Extension Project

During 2019, Newmont Goldcorp announced the start of commercial production at their Borden Mine. The Borden Lake Extension project is located less than five kilometres from the Borden Mine along the southeast trend of the Borden Gold zone. Note that mineralization hosted on nearby properties is not necessarily indicative of mineralization that may be hosted on the Company’s property.

Given the start of mining at Borden, follow up of past results at the Borden Lake Extension project will be undertaken in 2020. Such work will likely include additional till sampling and geochemical surveys to better define the previously outlined anomalous zones as well as a reinterpretation of VLF-EM data using the latest inversion software. Due to the glacial cover in the area, overburden drilling, guided by results of this work, would be the best means to define targets for follow up diamond drilling.

Location of the BLE property and anomalous gold zones along trend to the southeast of Newmont-Goldcorp’s Borden Gold Zone.

 All samples were shipped to the Bureau Veritas laboratory in Vancouver, BC, where they were crushed and split and a 500g sub sample pulverized to 200 mesh. Samples of 30g were analyzed for gold by fire assay with an atomic absorption finish and another 15g sample for 36 elements by ultratrace ICP-MS (inductively coupled plasma-mass spectrometry) following an aqua regia digestion. Over limit samples (greater than 10g/t Au) are re-assayed using fire assay with a gravimetric finish. In addition to the QA-QC conducted by the laboratory, the Company routinely submits blanks, field duplicates and certified reference standards with batches of samples to monitor the quality of the analyses.

Roger Moss, PhD., P.Geo., is the qualified person responsible for all technical information in this release.

The Company gratefully acknowledges the Newfoundland and Labrador Ministry of Natural Resources’ Junior Exploration Assistance (JEA) Program for its financial support for exploration of the Ashuanipi property.

About Labrador Gold:

Labrador Gold is a Canadian based mineral exploration company focused on the acquisition and exploration of prospective gold projects in the Americas. In 2017 Labrador Gold signed a Letter of Intent under which the Company has the option to acquire 100% of the Ashuanipi property in northwest Labrador and the Hopedale property in eastern Labrador.

The Hopedale property covers much of the Florence Lake greenstone belt that stretches over 60 km. The belt is typical of greenstone belts around the world but has been underexplored by comparison. Initial work by Labrador Gold during 2017 show gold anomalies in soils and lake sediments over a 3 kilometre section of the northern portion of the Florence Lake greenstone belt in the vicinity of the known Thurber Dog gold showing where grab samples assayed up to 7.8g/t gold. In addition, anomalous gold in soil and lake sediment samples occur over approximately 40 kilometres along the southern section of the greenstone belt (see news release dated January 25, 2018 for more details).

The Ashuanipi gold project is located just 35 km from the historical iron ore mining community of Schefferville, which is linked by rail to the port of Sept Iles, Quebec in the south. The claim blocks cover large lake sediment gold anomalies that, with the exception of local prospecting, have not seen a systematic modern day exploration program. Results of the 2017 reconnaissance exploration program following up the lake sediment anomalies show gold anomalies in soils and lake sediments over a 15 kilometre long by 2 to 6 kilometre wide north-south trend and over a 14 kilometre long by 2 to 4 kilometre wide east-west trend. The anomalies appear to be broadly associated with magnetic highs and do not show any correlation with specific rock types on a regional scale (see news release dated January 18, 2018). This suggests a possible structural control on the localization of the gold anomalies. Historical work 30 km north on the Quebec side led to gold intersections of up to 2.23 grams per tonne (g/t) Au over 19.55 metres (not true width) (Source: IOS Services Geoscientifiques, 2012, Exploration and geological reconnaissance work in the Goodwood River Area, Sheffor Project, Summer Field Season 2011). Gold in both areas appears to be associated with similar rock types.

The Company has 57,039,022 common shares issued and outstanding and trades on the TSX Venture Exchange under the symbol LAB.

For more information please contact:
Roger Moss, President and CEO
Tel: 416-704-8291
Or visit our website at: www.labradorgold.com
Twitter: @LabGoldCorp

SPONSOR: Affinity Metals $AAF.ca – 12-Year Breakout in Mining Stocks Relative to Gold $SII.ca $TUD.ca $GTT.ca $AMK.ca $OSK.ca

Posted by AGORACOM at 2:39 PM on Wednesday, January 8th, 2020

Sponsor: Affinity Metals (TSX-V: AFF) a Canadian mineral exploration company building a strong portfolio of mineral projects in North America. The Corporation’s flagship property is the Drill ready Regal Property near Revelstoke, BC. Recent sampling encountered bonanza grade silver, zinc, and lead with many samples reaching assay over-limits. Further assaying of over-limits has been initiated, results will be reported once received. Click Here for More Info

Excerpts from Crescat Capitals November Newsletter:

Precious Metals

Precious metals are poised to benefit from what we consider to be the best macro set up we’ve seen in our careers. The stars are all aligning. We believe strongly that this time monetary policy will come at a cost. Look in the chart below at how the new wave of global money printing just initiated by the Fed in response to the Treasury market funding crisis is highly likely to pull depressed gold prices up with it.

The gold and silver mining industry endured a severe bear market from 2011 to 2015 and have formed a strong base over the last four years.

The imbalance between historically depressed commodity prices relative to record overvalued US stocks remains at the core of our macro views. On the long side, we believe strongly commodities offer tremendous upside potential on many fronts. Precious metals remain our favorite. We view gold as the ultimate haven asset to likely outperform in an environment of either a downturn in the business cycle, rising global currency wars, implosion of fiat currencies backed by record indebted government, or even a full-blown inflationary set up. These scenarios are all possible. Our base case is that governments and central banks will keep their pedals to the metal to attempt to fend off credit implosion or to mop up after one has already occurred until inflation becomes a persistent problem.

The gold and silver mining industry is precisely where we see one of the greatest ways to express this investment thesis. These stocks have been in a severe bear market from 2011 to 2015 and have been formed a strong base over the last four years. They are offer and incredibly attractive deep-value opportunity and appear to be just starting to break out this year. We have done a deep dive in this sector and met with over 40 different management teams this year. Combining that work with our proprietary equity models, we are finding some of the greatest free-cash-flow growth and value opportunities in the market today unrivaled by any other industry. We have also found undervalued high-quality exploration assets that will make excellent buyout candidates.

We recently point out this 12-year breakout in mining stocks relative to gold now looks as solid as a rock. In our view, this is just the beginning of a major bull market for this entire industry. We encourage investors to consider our new Crescat Precious Metals SMA strategy which is performing extremely well this year.

“This is just the beginning of a major bull market for this entire industry”

Zero Discounting for Inflation Risk Today

With historic Federal debt relative to GDP and large deficits into the future as far as the eye can see, if the global financial markets cannot absorb the increase in Treasury debt, the Fed will be forced to monetize it even more. The problem is that the Fed’s panic money printing at this point in the economic cycle may hasten the unwinding of the imbalances it is so desperate to maintain because it has perversely fed the last-gasp melt up of speculation in already record over-valued and extended equity and corporate credit markets. It is reminiscent of when the Fed injected emergency cash into the repo market at the peak of the tech bubble at the end of 1999 to fend off a potential Y2K computer glitch that led to that market and business cycle top.
After 40 years of declining inflation expectations in the US, there is a major disconnect today between portfolio positioning, valuation, and economic reality. Too much of the investment world is long the “risk parity” trade to one degree or another, long stocks paired with leveraged long bonds, a strategy that has back-tested great over the last 40 years, but one that would be a disaster in a secular rising inflation environment.

With historic Federal debt relative to GDP and large deficits into the future as far as the eye can see, rising long-term inflation, and the hidden tax thereon, is the default, bi-partisan plan for the US government’s future funding regardless of who is in the White House and Congress after the 2020 elections. The market could start discounting this sooner rather than later.
The Fed’s excessive money printing may only reinforce the unraveling of financial asset imbalances today as it leads to rising inflation expectations and thereby a sell-off in today’s highly over-valued long duration assets including Treasury bonds and US equities, particularly insanely overvalued growth stocks. We believe we are in the vicinity of a major US stock market and business cycle peak.

Source:”Running Hot”

Courtesy of Crescat Capital: https://www.crescat.net/running-hot/

Thanks to

Kevin C. Smith, CFA
Chief Investment Officer

Tavi Costa
Portfolio Manager

American Creek Resources $AMK.ca Recognises 2019 as a Major Turning Point; Looks Forward to Major Developments in 2020 $TUD.ca $SII.ca $GTT.ca $AFF.ca $SEA.ca $SA $PVG.ca $AOT.ca

Posted by AGORACOM at 9:35 AM on Tuesday, January 7th, 2020
  • American Creek has strengthened its position both financially and strategically
  • Treaty Creek will be advancing in a major way
  • Eric Sprott made two separate investments of $1,000,000 making Mr. Sprott the largest external investor in Treaty Creek

American Creek Resources Ltd. (TSXV: AMK) (OTC Pink: ACKRF) (“American Creek”) (“the Corporation”) is pleased to report that 2019 was a pivotal year for the company which is now positioned to take full advantage of the precious metals bull run that many experts believe we are only in the early stages of, even though gold hit a 7 year high of $1,580 this week. Looking back, on the first day of trading in 2019 AMK closed at $0.03 and on the last day of trading in 2019 AMK closed at $0.09 representing a significant annual increase. Management envisions positive developments to continue in 2020 through the geological advancements of its properties including the potential for a world class resource on the Treaty Creek JV project located in the “Golden Triangle” of Northwestern British Columbia.

Darren Blaney, CEO of American Creek stated: “This past year was a significant turning point for the company and will be the catalyst for more exciting developments in 2020. The company has strengthened its position both financially and strategically and is poised to benefit from not only a strengthening gold and silver market but also from the investment community becoming more aware of the company’s projects and potential. The Treaty Creek project will be advancing in a major way and several of our other projects including the Dunwell and Gold Hill will also be the focus of attention this year. We very much look forward to 2020 and wish all of our shareholders the very best this upcoming year!”

Cannot view this image? Visit: https://orders.newsfilecorp.com/files/682/51189_2c4af78684226b7e_001.jpg


Image of the Goldstorm Zone found along the base of this hill at Treaty Creek.

To view an enhanced version of this image, please visit:
https://orders.newsfilecorp.com/files/682/51189_2c4af78684226b7e_001full.jpg

Financial Position

The company raised over $3.3 million in 2019 through common and flow-through shares along with the exercise of warrants. Through these events the company was able to strengthen existing alliances and create a number of new highly strategic relationships bringing strength, credibility and future increased exposure to American Creek.

Of note, Canadian billionaire Eric Sprott made two separate investments of $1,000,000 into American Creek as well as an additional $8,400,000 investment in our JV partner Tudor Gold for the development of the Treaty Creek property. This makes Mr. Sprott the largest external investor in Treaty Creek. He recently stated that he is “very excited about the opportunity there as the project has a great shot at having 20 million ounces.”

Geological Position

TREATY CREEK

The 2019 drilling at Treaty Creek was very successful and produced some of the most significant gold intercepts in the exploration industry. The focus has been on the gold enriched Goldstorm Zone which is on trend with, and part of, the same geological system as Seabridge Gold’s neighboring KSM deposits. With approximately one billion tonnes of gold enriched rock identified (potential for a resource calculation in 2020), the Goldstorm has potential to become a world class gold deposit. The 2019 drilling was designed to define a gold deposit with the potential of being open pit mined. The upcoming 2020 drilling is designed to significantly expand the deposit as the system is open to the north, the east and at depth.

The Treaty Creek Project is a joint venture with Tudor Gold owning 3/5th and acting as project operator. American Creek and Teuton Resources each have a 1/5th interest in the project. American Creek and Teuton are both fully carried until such time as a Production Notice is issued, at which time they are required to contribute their respective 20% share of development costs. Until such time, Tudor is required to fund all exploration and development costs while both American Creek and Teuton have “free rides”.

DUNWELL MINE

A maiden drill program was initiated in 2019 on the 100% owned Dunwell Mine project located in the heart of the Golden Triangle a few kilometers outside of Stewart, BC. This past producing high grade mine (gold, silver, lead, zinc) holds tremendous potential and may have the best logistics found in the Golden Triangle. Assays from the program are currently pending.

GOLD HILL AND OTHER PROJECTS

The Gold Hill property is believed to contain the principle source lode for Canada’s fourth largest placer deposit located downstream (Wild Horse River Gold Rush) which produced over 48 tonnes gold (and is still producing). Work is planned for 2020 which will advance this highly prospective project.

American Creek also holds several other high potential projects in other prospective areas of BC such as the Austruck-Bonanza, Ample Goldmax, Silver Side, and Glitter King.

Marketing

American Creek will be going to great lengths in 2020 to increase the Corporation’s exposure and recognition. Near future events including attending many conferences including the Vancouver Resource Investment Conference (Vancouver), AME Roundup (Vancouver), Red Cloud (Toronto), Raise Capital (Toronto), and the Prospectors and Developers Association of Canada (PDAC) convention (Toronto).

About American Creek

American Creek is a Canadian mineral exploration company with a strong portfolio of gold and silver properties in British Columbia. Three of those properties are located in the prolific “Golden Triangle”; the Treaty Creek and Electrum joint venture projects with Tudor Gold/Walter Storm as well as the 100% owned past producing Dunwell Mine.

More information about the Treaty Creek Project can be found here: https://americancreek.com/index.php/projects/treaty-creek/home

An exploration program is ongoing on American Creek’s 100% owned Dunwell Mine property located near Stewart. More information can be found here: https://americancreek.com/index.php/projects/dunwell-mine

The Corporation also holds the Gold Hill, Austruck-Bonanza, Ample Goldmax, Silver Side, and Glitter King properties located in other prospective areas of the province.

For further information please contact Kelvin Burton at: Phone: 403 752-4040 or Email: [email protected]. Information relating to the Corporation is available on its website at www.americancreek.com

American Creek Resources $AMK.ca – Gold Poised To Test Resistance From 2011-2013 As US/Iran Rhetoric Escalates $TUD.ca $SII.ca $GTT.ca $AFF.ca $SEA.ca $SA $PVG.ca $AOT.ca

Posted by AGORACOM at 3:28 PM on Monday, January 6th, 2020

American Creek owns a 20% Carried Interest to Production at the Treaty Creek Project in the Golden Triangle. 2019’s first hole averaged of 0.683 g/t Au over 780m in a vertical intercept. The Treaty Creek property is located in the same hydrothermal system as the Pretivm and Seabridge’s KSM deposits.

Welcome to 2020, a year in which the President of the United States conducts war via his Twitter account:

Regardless of how you feel about President Trump or the US/Iran situation, the fact is that things escalated a great deal over the weekend after a US airstrike eliminated Iranian General Suleimani on Thursday night in Baghdad. 

This dangerous escalation of posturing between the mightiest military on the planet and a country of more than 80 million people which also happens to possess formidable conventional and unconventional military capabilities could have potentially far reaching financial market implications. 

With Middle East equity indices already down between 3% and 5% I fully expect S&P futures to open lower Sunday night. Gold futures and crude oil futures could also rise sharply in thin Sunday night trading as scared short sellers are forced to close out losing positions.

My interest is in gold in particular.  Turning to the monthly chart we can see that gold ended last week right at previous support from 2011-2013:

Gold (Monthly)

There is layer of resistance stretching from the September 2019 peak at $1565 to the April 2013 high at $1604.30. If gold gaps higher into the teeth of this resistance it should make for an interesting week of trading which is likely to be characterized by higher volatility and higher trading volumes. Gold sentiment is running hot after a more than $100 rally over the span of five weeks. In addition, positioning among gold futures traders is also at an extreme with commercial traders (producers, swap dealers, etc.) in gold futures holding their largest net notional short position on record (more than US$50 billion):

Technically speaking, gold is getting a bit overheated on shorter time frames (daily, hourly, etc.). However, on the weekly and monthly charts the gold party could be just getting started after a 6+ year bottoming process that only transitioned into a nascent uptrend six months ago. 

Nobody knows how the US/Iran situation is going to unfold, but one thing is for sure and that is that it’s a scary situation which has the potential to get a lot worse before it gets better. If there was ever a time to own gold it would be now, and perhaps that is why we should take standard sentiment/technical indicators with a grain of salt.  Judging by the massive commercial short position in gold futures the yellow metal is in the midst of a massive short squeeze – short squeezes can often reach crazy extremes before experiencing a reversal (only once the most leveraged short players have been forced to cover at the highs).  This may be what is about to unfold in gold. 

Source: https://ceo.ca/@goldfinger/gold-poised-to-test-resistance-from-2011-2013-as-usiran-rhetoric-escalates

Labrador Gold $LAB.ca – Gold Market Update $RIO.ca $WHM.ca $SIC.ca $NXS.ca

Posted by AGORACOM at 11:54 AM on Monday, January 6th, 2020
This image has an empty alt attribute; its file name is LAB-square-logo-2.png

SPONSOR: Labrador Gold – Two successful gold explorers lead the way in the Labrador gold rush targeting the under-explored gold potential of the province. Exploration has already outlined district scale gold on two projects, including a 40km strike length of the Florence Lake greenstone belt, one of two greenstone belts covered by the Hopedale Project. Click Here for More Info

In this update I am not going to repeat the points made in the last fairly comprehensive update, instead we are going to focus on the importance of the resistance level just above where the price is now, and impact of the killing of the Iranian General and its potential implications for the gold price.

On the latest 10-year chart we can see that gold is making a 2nd attack on the key major resistance level in the $1530 – $1560 zone, which is hardly surprising considering what happened last week.


The reason that this resistance level is of such major importance is made abundantly clear by the following chart made by a subscriber and kindly forwarded to me, which I reproduce with his permission. As we can see gold made no less than 5 significant lows at this level between 2011 and 2013, before it finally crashed this support and plunged 15% in 2 days, so it is clearly of huge significance and is the biggest hurdle by far on the way up. Therefore, even given the latest mayhem in the Mid-East, we should not be surprised if it now stalls out here and possibly backs off for a while to form a trading range, which is also made likely by its now being critically overbought on its RSI indicator and by the latest COTs, which we will look at lower down the page, coming in with really extreme readings again. This makes sense given that we now at a time of maximum tension.

From a subscriber – highlighting gold’s key support at the $1530 – $1560 level, which is now of course strong resistance…


Detail showing the plunge that was triggered the failure of this support…


On the 6-month chart we can see how, after breaking out of the corrective downtrend in force from early September, gold has risen steeply, without one down day so far to become critically overbought on its RSI indicator as it drives into the zone of strong resistance with volume becoming heavy on Friday. This of course increases the chances of its reacting back the moment tension over the Mid-East situation eases, even if only slightly.


As for the COTs, they are showing extreme readings once more (chart is for 24th December), which suggest that, especially if tension over the Iran situation eases short-term, gold will probably back off some into a consolidation pattern that will enable it to charge up sufficiently to take out the key resistance in due course.

Click on chart to popup a larger, clearer version.


Now we come to the possible impact of the US killing of the top Iranian General. In order to figure out the real motivation for this act, we simply have to ask the usual question “Who stands to gain?” The first interest group that stands to gain is the US military, which receives about $700 billion of taxpayers’ money every year, and probably about $500 billion of this is in excess of what it needs to defend the Homeland. So in order to justify this bloated budget it creates enemies and conflicts around the world. The next interest group is Israel, which controls the US and uses the US military as a sledgehammer to achieve its objectives which include dominance of the Mid-East. Iran is the big prize. Finally the Republicans and Trump himself stand to gain at the polls later this year as the population will predictably “rally round the flag” as a result of conflict with Iran. Knowing all this, we can quickly deduce that the killing of the Iranian General was an act of extreme provocation designed to trigger some kind of counter attack by Iran that can then be used as an excuse to launch a bombing campaign against it. Even if Iran exercises maximum restraint and does nothing beyond making empty threats to assuage its angry populace, it may still fall victim to an onslaught after a calculated false flag attack which is blamed on it. So whatever it does, it loses – it’s been put in a classic “zugzwang” situation.

For all the bluster, Iran’s military is no match for that of the US of course, which spends more than the rest of the world put together on arms. The best way for Iran and Islam in general to “get even” with the West for all its many decades of Colonial interference in the Mid-East, exploitation and massive destruction inflicted on places like Iraq and Libya and the Palestinians therefore (looked at from their point of view) is to conduct “asymmetrical warfare”, invade Western countries and attack their churches and institutions etc, and then take them over gradually by outbreeding them. Western societies are now too corrupt, decadent, morally bankrupt and weak to stop this happening, and it is happening right now in Europe, and the only reason it isn’t happening to the same extent in the US is that it is a lot harder to pilot a rubber dingy across the Atlantic Ocean than the Mediterranean Sea, although as we know the Democrats and the Left appear to trying to take up the slack by destroying the country from within in places like Portland, L.A. and San Francisco, and this rot will spread unless right minded people take a vigorous stand.

All this is mentioned because it is clear that the killing of the Iranian General is the prelude to a military strike against Iran, which will probably take the form of an extensive and intensive bombing campaign that both Israel and the US have been looking forward to for years, because a ground invasion is out of the question due to the geography and logistics. The goal as usual will be to destroy its military capability and wreck its infrastructure with the eventual aim of installing a puppet government and opening up the country to Western exploitation, and the wild card in all this will be whether Russia and China will do anything to prevent it, or just stand and watch. It is thought that they don’t have the nerve to intervene. In any event, if such a campaign is launched, we can expect the world to be gripped by an acute sense of crisis and gold will spike. Iran may have the ability to disrupt the flow of oil out of the Persian Gulf, albeit temporarily, which would trigger an oil price spike and a stockmarket crash.

Last week’s updates concluded with a look at the highly bullish charts for gold measured against the Australian dollar and the Japanese Yen, and this week we will look at gold against the Canadian dollar and the Swiss Franc.

While many investors are still agonizing about whether gold is in a bullmarket or not, that is because they are fixated on the charts for gold in US dollars. When you look at gold in other currencies you realize that it is already very much in a bullmarket, and recently made new highs against many currencies, like the Canadian dollar shown below…


Even against the Swiss Franc, which amongst currencies enjoys some safe haven status, gold is performing better than it is against the dollar…


…and we should remember that the dollar may not remain as “king of the hill” forever, especially as a number of major powers in the Asia especially are preparing to ditch it.

Finally, we are going to take a quick look at an unusual chart for gold submitted by the same subscriber as some of the charts above. It is unusual because it is a yearly candlestick chart, meaning that each candle on it is for an entire year. Its supreme advantage is that it keeps things simple. The Triangle shown on it is his interpretation, not mine. It certainly looks positive here with a big white candle for 2019, with the arithmetic version shown looking even more bullish. This type of chart also has a potential advantage for the writer, as if only this chart were used, I would only have to write these updates once a year.


Courtesy of Clive Maund: https://www.clivemaund.com/gmu.php?art_id=68&date=2020-01-05

SPONSOR: Affinity Metals $AFF.ca – An Explosive Rally In Gold and the Key Levels to Watch $SII.ca $TUD.ca $GTT.ca $AMK.ca $OSK.ca $AOT.ca

Posted by AGORACOM at 1:21 PM on Friday, January 3rd, 2020

Sponsor: Affinity Metals (TSX-V: AFF) a Canadian mineral exploration company building a strong portfolio of mineral projects in North America. The Corporation’s flagship property is the Drill ready Regal Property near Revelstoke, BC. Recent sampling encountered bonanza grade silver, zinc, and lead with many samples reaching assay over-limits. Further assaying of over-limits has been initiated, results will be reported once received. Click Here for More Info

With an impressive start to the year this new heightened geopolitical development could be the catalyst to break out gold to multi year highs. The U.S. strike that killed a key Iranian general could have a ripple effect on the signing of the trade agreement on the 15th as China and Iran have recently worked together on joint military operations along with Russia. Any set back in the trade agreement would severely impact the direction of U.S. equities and the expectations for interest rate decisions globally. Price Analysis and Outlook The daily gold chart shows that momentum indicator slow stochastics are rising steadily and reaching overbought territory giving longer term indication that we have pushed into a Bull Market. While ADX, which measures strength of the trend, has turned up over 40 showing that the driving force behind the recent upward move is very strong. The 2 key levels of support to watch are the November 1st high of $1525.2 and the December 30th high of $1519.1. This should act as a consolidation level while a likely upside target completing this trend would be an objective of $1572

Source: https://www.kitco.com/commentaries/2020-01-03/An-Explosive-Rally-in-Gold-and-the-Key-Levels-to-Watch.html

American Creek $AMK.ca Congratulates Treaty Creek JV Partner Tudor Gold on Receiving a Further $2,900,000 in Exploration Funding from Eric Sprott $TUD.ca $SII.ca $GTT.ca $AFF.ca $SEA.ca $SA $PVG.ca $AOT.ca

Posted by AGORACOM at 9:20 AM on Tuesday, December 31st, 2019
http://blog.agoracom.com/wp-content/uploads/2019/12/American-Creek-Square-Logo-2.png

Cardston, Alberta–(December 31, 2019) – American Creek Resources Ltd. (TSXV: AMK) (OTC Pink: ACKRF) (“American Creek”) (“the Corporation”) is pleased to report that Canadian billionaire Eric Sprott has invested an additional $2,900,000 in our JV partner Tudor Gold for the upcoming 2020 drill program on Treaty Creek, located in the “Golden Triangle” of Northwestern British Columbia.

The 2019 drilling at Treaty Creek was very successful and produced some of the most significant gold intercepts in the exploration industry. The focus has been on the gold enriched Goldstorm Zone which is on trend with Seabridge Gold’s Iron Cap Zone located approximately five kilometers to the southwest. Drilling was designed to define a gold deposit with the potential of being open pit mined.

The Treaty Creek Project is a joint venture with Tudor Gold owning 3/5th and acting as project operator. American Creek and Teuton Resources each have a 1/5th interest in the project. American Creek and Teuton are both fully carried until such time as a Production Notice is issued, at which time they are required to contribute their respective 20% share of development costs. Until such time, Tudor is required to fund all exploration and development costs while both American Creek and Teuton have “free rides”.

Darren Blaney, CEO of American Creek stated: “Mr. Sprott has now made multiple significant investments in Tudor Gold in 2019 for the development of the Treaty Creek property. On December 13, 2019 Mr. Sprott stated: “Treaty Creek has a great shot at having 20 million ounces, the holes are so deep, they have a thousand-meter holes that are running close to a gram a ton and it’s wide open, so I’m very excited about the opportunity there”. He continues to put his money where his mouth is and has given another huge endorsement to the Treaty Creek project with this latest significant injection of cash. He also made two prior $1,000,000 investments in American Creek earlier in 2019.”

The Treaty Creek Project lies in the same hydrothermal system as Pretium’s Brucejack mine and Seabridge’s KSM deposits however, the Treaty Creek project has far better logistics.


Image of Sulphurets Hydrothermal System

To view an enhanced version of this graphic, please visit:
https://orders.newsfilecorp.com/files/682/51109_a0c53bd3540adbe0_001full.jpg

Sprott Weekly Roundup

On December 27, 2019 Sprotts “Weekly Roundup” show hosted Bob Thompson, Senior Vice President of Raymond James in Vancouver who does an excellent job at describing where we are on the “Mining Clock” along with other valuable insights into the precious metals industry.

We highly recommend you take a few minutes to listen:

About American Creek

American Creek is a Canadian mineral exploration company with a strong portfolio of gold and silver properties in British Columbia. Three of those properties are located in the prolific “Golden Triangle”; the Treaty Creek and Electrum joint venture projects with Tudor Gold/Walter Storm as well as the 100% owned past producing Dunwell Mine.

More information about the Treaty Creek Project can be found here: https://americancreek.com/index.php/projects/treaty-creek/home

An exploration program is ongoing on American Creek’s 100% owned Dunwell Mine property located near Stewart. More information can be found here: https://americancreek.com/index.php/projects/dunwell-mine

The Corporation also holds the Gold Hill, Austruck-Bonanza, Ample Goldmax, Silver Side, and Glitter King properties located in other prospective areas of the province.

For further information please contact Kelvin Burton at: Phone: 403 752-4040 or Email: [email protected]. Information relating to the Corporation is available on its website at www.americancreek.com

American Creek $AMK.ca Announces the Discovery of a Copper-Silver Horizon Significantly Enriching the Grades at Treaty Creek Located in the Golden Triangle $TUD.ca $SII.ca $GTT.ca $AFF.ca $SEA.ca $SA $PVG.ca $AOT.ca

Posted by AGORACOM at 9:56 AM on Thursday, December 19th, 2019

American Creek Resources (TSXV: AMK) (OTC Pink: ACKRF) (the “Corporation” or “American Creek”) is pleased to announce its partner Tudor Gold has concluded the interpretation of a copper-silver mineralized zone, the ‘CS 600 Horizon’, within the Goldstorm Zone. Composite grades for drill holes GS19-42, 47, 48, 49, 52 and CB18-39 were re-calculated utilizing the copper and silver grades obtained from the 2019 drill-hole program. These holes are located in the northeastern-most area of the project. The copper and silver mineralization contributed greatly to increasing the gold equivalent content of all drill holes that cut the new copper-rich ‘CS 600 Horizon’.

  • The largest increase in gold equivalent content to the ‘300 Horizon’ was from GS19-42. The gold-only grade previously reported for the 370.5 m interval was 1.097 gpt Au. After adding the copper-silver mineralization, the gold metal equivalent content has increased to 1.275 gpt Au Eq over the same 370.5 metre interval. This was due mainly to the elevated silver grades.
  • Copper grades were very consistent within the ‘CS 600 Horizon’. Grades ranged from approximately 0.16% Cu to 0.34% Cu over intervals of 69m to 151.5m in holes GS19-42, 47, 48, 49 and 52. These intercepts led to the largest gold equivalent increases within the Goldstorm System.
  • Silver grades averaged as high as 10 gpt within both the ‘300 Horizon’ and the ‘CS 600 Horizon’ and the metal appears to occur throughout the entire Goldstorm System.

Vice President of Project Development, Ken Konkin P.Geo. comments: “The newly discovered copper-rich ‘CS 600 Horizon’ is a very important feature of the Goldstorm System. The presence of copper and silver mineralization gives this discovery a true polymetallic nature yet it remains a gold-dominant project. Copper grades appear to be increasing with depth within the ‘CS 600 Horizon’. In the following weeks our technical team will continue to examine the rest of the drill holes to re-compute the gold-equivalent grades to include copper and silver throughout the entire system.”

Table l provides gold equivalent composites from five drill holes completed on three sections that cut the ‘300 Horizon’ and the ‘CS 600 Horizon’ within the Goldstorm System. Although the sixth hole in this table (CB18-39) did not intersect the ‘CS 600 Horizon’, the Au Eq composite increased the grade of the intercept by over 11% within the ‘300 Horizon’. Sections attached demonstrate that the copper pulse is un-like the main gold mineralization within the ‘300 Horizon’ as the ‘CS 600 Horizon’ appears to be dipping sub-parallel to the main Treaty Thrust Fault (TTF1) shown in section 111+00 NE. The Company’s Press Release dated October 24th provides the drill collar data including drill hole location, elevation, inclination, azimuth and drill hole length.

Table l: Gold Equivalent Composites GS19-42, 47, 48, 49,52 and CB18-39

To view an enhanced version of Table I, please visit:
https://orders.newsfilecorp.com/files/682/50940_table1.jpg

* All assay grades are uncut and intervals reflect drilled intercept lengths. True widths of the mineralization have not been determined. HQ and NQ2 diameter core samples were sawn in half and typically sampled at standard 1.5m intervals.

**Prices used to calculate the AuEq metal content are: Gold $1322/oz, Ag: $15.91/oz, Cu: $2.86/lb. All metals are reported in USD and calculations do not consider metal recoveries.

The goal is to design a diamond drill hole program that will fast-track the exploration program for 2020 with the objective to begin the Mineral Resource Estimate work at the end of the 2020 field season. Tudor hopes to accomplish as much drilling needed to bring a Measured and Indicated Mineral Resource Estimate forward as quickly as possible.

Walter Storm, President and CEO, stated: “These new gold equivalents are extremely encouraging as our technical team continues to take positive steps advancing Tudor Gold’s flagship Treaty Creek Au-Ag-Cu project. During the following months our geologist and engineers will continue to work with the geological model and begin to prepare the diamond drill hole proposal for 2020 .”

Darren Blaney, President and CEO of American Creek, stated: “The Goldstorm deposit on Treaty Creek continues to amaze us. Its scale has grown exponentially over the last two years to close to a billion tonnes and these recent calculations are giving us a more accurate indication of the grades within the system. The focus has been on the 300 zone as it’s a gold enriched area just below the surface giving it great potential to be open pitted, and now we’re starting to see the tremendous potential at depth in the CS 600 zone. The Goldstorm is open at depth and to the north and east which is where these pulses of copper and silver are becoming more concentrated. With power and the highway only 20km down the valley, and the deposit increasing in size exponentially, the Goldstorm truly has the potential to be a world class deposit.”

The Treaty Creek Project is a Joint Venture with Tudor Gold owning 3/5th and acting as operator. American Creek and Teuton Resources each have a 1/5th interest in the project. American Creek and Teuton are both fully carried until such time as a Production Notice is issued, at which time they are required to contribute their respective 20% share of development costs. Until such time, Tudor is required to fund all exploration and development costs while both American Creek and Teuton have “free rides”.

The Treaty Creek Project lies in the same hydrothermal system as Pretium’s Brucejack mine and Seabridge’s KSM deposits with far better logistics.


Map 1

To view an enhanced version of Map 1, please visit:
https://orders.newsfilecorp.com/files/682/50940_90c505c404ac3984_002full.jpg

QA/QC

Drill core samples were prepared at MSA Labs’ Preparation Laboratory in Terrace, BC and assayed at MSA Labs’ Geochemical Laboratory in Langley, BC. Analytical accuracy and precision are monitored by the submission of blanks, certified standards and duplicate samples inserted at regular intervals into the sample stream by Tudor Gold personnel. MSA Laboratories quality system complies with the requirements for the International Standards ISO 17025 and ISO 9001. MSA Labs is independent of the Company.

Qualified Person

The Qualified Person for this news release for the purposes of National Instrument 43-101 is the Company’s Vice President of Project Development, Ken Konkin, P.Geo. He has read and approved the scientific and technical information that forms the basis for the disclosure contained in this news release.


Figure 1: Goldstorm Zone Section 111+00 NE

To view an enhanced version of Figure 1, please visit:
https://orders.newsfilecorp.com/files/682/50940_90c505c404ac3984_003full.jpg

Figure 2: Goldstorm Zone Section 112+50 NE

To view an enhanced version of Figure 2, please visit:
https://orders.newsfilecorp.com/files/682/50940_90c505c404ac3984_004full.jpg

Figure 3: Goldstorm Zone Section 114+00 NE

To view an enhanced version of Figure 3, please visit:
https://orders.newsfilecorp.com/files/682/50940_90c505c404ac3984_005full.jpg

About American Creek

American Creek is a Canadian junior mineral exploration company with a strong portfolio of gold and silver properties in British Columbia. Three of those properties are located in the prolific “Golden Triangle”; the Treaty Creek and Electrum joint venture projects with Tudor Gold/Walter Storm as well as the 100% owned past producing Dunwell Mine.

More information about the Treaty Creek Project can be found here: https://americancreek.com/index.php/projects/treaty-creek/home

An exploration program is ongoing on American Creek’s 100% owned Dunwell Mine property located near Stewart B.C.. More information can be found here: https://americancreek.com/index.php/projects/dunwell-mine

The Corporation also holds the Gold Hill, Austruck-Bonanza, Ample Goldmax, Silver Side, and Glitter King properties located in other prospective areas of the province.

For further information please contact Kelvin Burton at: Phone: 403 752-4040 or Email: [email protected]. Information relating to the Corporation is available on its website at www.americancreek.com