Agoracom Blog Home

Posts Tagged ‘#Drilling’

Secular Gold Bull Resumes with Force SPONSOR: Affinity Metals $AAF.ca $SII.ca $TUD.ca $GTT.ca $AMK.ca $OSK.ca $RKR.ca

Posted by AGORACOM at 12:50 PM on Monday, May 11th, 2020
This image has an empty alt attribute; its file name is Affinity_Metals_Corp_Logo.png

Sponsor: Affinity Metals Corp. (TSX-V: AFF) is a Canadian mineral exploration company building a strong portfolio of mineral projects in North America. The Corporation’s flagship property is the drill ready Regal Property near Revelstoke, BC where Affinity Metals is making preparations for a spring drill program to test two large Z-TEM anomalies. Click Here for More Info
COVID-19: The Pin that Punctured the Credit Balloon

Gold is on the cusp of breaking out to all-time highs in U.S. dollars and has already done so in virtually every other currency. Gold mining stocks continue to lag the metal and, in our opinion, represent a compelling investment opportunity at this moment. The COVID-19 pandemic panic was merely the black swan that punctured a financial market asset bubble that took almost a decade to inflate.

Think of the pandemic as the pin that punctured the credit balloon. In a few months, the pandemic will ease (hopefully) with the formulation of a COVID-19 vaccine, widespread testing and other responses that will surely come from the healthcare industry. However, the fiscal and monetary policy damage committed by all governments to save the world has created a debt hangover that will linger for years. Economic growth will rebound but only to subpar levels once extreme health-related restrictions are lifted and “stimulus” kicks in.

The requisites for robust economic growth most likely to misfire are investment confidence and bank lending. Both have been severely compromised. Whether this landscape evolves into a long stretch of deflation or combusts into untamed inflation remains to be seen. What seems quite apparent is that traditional Keynesian stimulus measures are in their endgame. They will most likely deliver only steadily diminishing returns. Starkly opposite economic outcomes are possible from this policy morass; both would be positive for gold but negative for real returns on fixed income or equities.

Q1 Marks a Pivotal Turning Point for All Asset Classes

As of this writing, gold is trading about 10% less than its all-time high of US$1,900 attained nine years ago (September 2011). In effect, it has gone nowhere for a decade despite a tectonic shift in the investment and economic outlook. A lengthy correction lasting until 2016 and subsequent churning resulted in the establishment of a powerful multi-year basing structure. From this base and with strong macroeconomic tailwinds, we believe new highs well above $1,900 can be achieved over the next four years.

Despite enthusiastic advocacy and much chatter from investment luminaries, including Ray Dalio, Jeff Gundlach, Seth Klarman and others, gold remains severely and inappropriately underrepresented in the portfolios of fiduciaries, endowments and family offices. Flows into channels such as gold-backed exchange traded funds (“ETFs”) have been strong relative to previous low levels, but must still be considered a trickle in terms of what could still come. 

 Figure 1. Gold-Backed ETFs Reach Record Levels
Global gold-backed ETFs added 298 tonnes and net inflows of US$23 billion in Q1 2020 — the highest quarterly amount ever in absolute U.S. dollar terms and the largest tonnage additions since 2016.
Source: World Gold Council. Data as of 3/31/2020.

In our opinion, the first quarter of 2020 will mark a pivotal, secular turning point for all major asset classes including equities, bonds, gold and currencies. A return to the pre-2020 financial market normalcy and investment complacency is unlikely. In our view, consensus hopes remain high that the credit smash is only a temporary repercussion of the health scare. We disagree and suggest the effects will be long lasting.

Despite the solid price gains achieved by gold in the past two years, there is much more upside to come as investors gradually give up on repeated equity market bottom fishing and the hope of a return to financial market normalcy. A full reversal to the previous complacency cannot take place following a brief crash. The mood change will more likely become pervasive after grueling stretches of disappointing returns from previously successful investment strategies.

Unprecedented Central Bank Monetary Expansion

In our view, the decade preceding 2020 was characterized by the systematic stifling of price discovery for interest rates and the appropriate dependent valuations for financial assets. Such distortion was made possible only by unprecedented central bank balance sheet expansion that encouraged, abetted and rewarded risk taking in the form of ever greater leverage.

The prolonged somnolence of gold was among the most egregious price distortions of the previous decade and this suppressed interest in the metal as a risk mitigator and portfolio diversifier. Disinterest was fed in large part by the nearly universal expectation that the past would always be prologue and that highly leveraged financial and economic structures would perpetually result in outsized returns. In our view, the greatest change stemming from the credit bust will be a mood shift or paradigm change in the opposite direction.

At gold’s previous peak in 2011, the combined balance sheets of the U.S. Federal Reserve (“U.S. Fed”) and the European Central Bank (“ECB”) totaled approximately US$5.5 trillion. Today, that number is more than $11.4 trillion and rapidly moving higher. The USD gold price is still lower than nine years ago. In our view, gold price is still well below where it should be and will likely trade higher in the new macro landscape.

 Figure 2. Pandemic Policy Response Pushes Global Balance Sheets to Record Levels
Source: Bloomberg. Data as of 3/31/2020.

Gold Mining Stocks are Inexpensive

If gold is not correctly priced for what has transpired and what lies ahead, gold mining stocks are even more inappropriately priced. Based on current metal prices, most companies are generating positive earnings and cash flow and in many cases, free cash flow that can be applied to higher dividend payouts. Compared to other sectors of the economy, the gold mining industry stands almost alone in looking forward to strong 2020 earnings and a positive outlook for 2021.

2020 free cash flow yields for large-cap producers range from 3%-7% and 6%-25% for intermediate producers based on conventional sell-side research. The stats are similar or better for 2021 based on spot gold prices. As Figure 3. shows, mining stocks are inexpensive in absolute terms and have never been so cheap relative to the gold price. 

Figure 3. Gold Equities Are Undervalued Relative to Bullion
Ratio of XAU Index to Spot Gold (12/23/1983-3/31/2020)

Since 2008, the relative valuation of gold equities to gold bullion has fallen 75% from the prior 25-year average. The ratio of the XAU Index to spot gold averaged 0.2497x for a quarter century through 2008. As of 3/31/2020, the ratio was 0.0501x.

It is undoubtedly true that the industry will suffer health-related mine shutdowns and other shortfalls this year. Much of the disruption potential has already been broadcast and priced into the market. Some downside news may still have yet to surface. However, most miners are not financially levered and should be able to survive a few quarters of lower or no production. Unlike the airline, leisure, retail and manufacturing sectors, gold not produced today should grow in value and be produced at higher prices and lower costs next year and those beyond. It is not the same story for many other sectors of the economy. Based on fundamentals, gold stocks are inexpensive. By contrast, several other sectors of the economy could face long stretches of poor earnings, bad news flow and financial woes.

The gold mining sector registered a decline of approximately 20% in Q1 (as measured by GDX2) as shares did get battered by indiscriminate liquidations during March. However, as of this writing, two weeks after the close of the quarter, most shares trade near to where they stood at the beginning of the year, and have certainly registered outstanding performance in relative terms. It is remarkable that the largest sector ETF, GDX, suffered outflows of $381 million3 during the quarter at what could be the threshold of an upside breakout. In a favorable cycle for the gold price, mining stocks have historically delivered outperformance 3 to 5 times that of the metal itself.

Gold mining shares continue to be viewed by investors with deep skepticism as reflected by valuation and flows. When we scan Figure 4, it appears to us that the sector is on the verge of an upside breakout from a multi-year base should our assessment of the macroeconomic environment prove correct.

Figure 4. NYSE Arca Gold BUGS Index (HUI4)

Monetary and Fiscal Policy Going Ballistic

There is no need to belabor the obvious. However, the consequences of these actions have yet to be priced into the financial markets or gold. The risk parity trade has fallen short, partly because bonds were caught up in the indiscriminate liquidations of Q1. Looking forward, bonds may no longer be able to play the safe haven role they traditionally filled to balance equity risk. The vacuum could be filled in part by increased gold exposure for all classes of investors. Sovereign credit liquidity injections are likely to remain significant and permanent. The bond market has become socialized. Owning Treasury bonds of any duration could become akin to parking Treasury bills, with little upside and considerable risk of impairment through inflation. Gold is the antidote to the fixed-income investor’s dilemma.

Gold is extremely under-owned, under-represented, and poorly thought of in the circles of conventional investment thinking. It is still considered to be a fringe asset. Just ask Goldman Sachs which recently advised its clients:

 “We concluded then (2010) that gold does not have a role as a strategic asset class in clients’ already well-diversified portfolios. We have updated the research and the evidence is even more compelling today than it was then.” (4/5/2020; Goldman Sachs Investment Strategy Group)

We remind the reader that Goldman is the same firm that in December 2019 declared the U.S. economy to be “recession proof” and then in March 2020 cautioned that stocks had substantial further downside:

“Overall, the changes underlying the Great Moderation appear intact, and we see the economy as structurally less recession prone today.” (12/31/2019; Goldman economists Jan Hatzius and David Mericle)

“Goldman Sachs on Friday dramatically cut its U.S. economic forecast, saying it now expects GDP to decline by 25% in the second quarter of 2020 because of the coronavirus panic.” (3/20/2020; Business Insider)

“What is your estimate for the S&P 500 by yearend 2020? David Kostin, “3400.” (1/2020; GS Podcast, David Kostin Goldman, U.S. chief equity strategist and Jake Siewert) 

“Kostin thinks the market goes lower. ‘In the near term, we expect the S&P 500 will fall towards a low of 2000.’” (3/22/2020; Yahoo Finance)

Goldman’s commentary is, in our opinion, a reasonable proxy for conventional wisdom. One could easily find other embarrassing examples of mainstream thinking ignorant of the best-performing asset class (by far) versus equities and bonds since 2000.

Contrarians and value investors, take note! The secular gold bull that began in 2000 and corrected for a few years has returned to life with renewed vigor. Pullbacks — price declines during this uptrend — should be bought. The setup for gold and gold mining shares ticks every box for highly rewarding investment returns.

Figure 5. Gold Has Outperformed Stocks, Bonds and USD over the Past 20 Years
Returns for Period from 12/31/1999-4/13/2020

Source: Bloomberg. Period from 12/31/1999-4/20/2020. Gold is measured by GOLDS Comdty; US Agg Bond Index is measured by the Bloomberg Barclays US Agg Total Return Value Unhedged USD (LBUSTRUU Index); S&P 500 TR is measured by the SPX; and the U.S. Dollar is measured by DXY Curncy. Past performance is no guarantee of future results.

Figure 6. Gold Provides Portfolio Diversification
Gold provides diversification in a portfolio, and has low correlation with other asset classes. The period measured is April 1, 2015 to April 1, 2020.


* Source: World Gold Council. Period from April 1, 2015 to April 1, 2020, based on monthly returns. Gold is measured by the LBMA Gold Price; stocks by the S&P 500 Index; commodities by the Bloomberg Commodity Index;  Bonds by the BarCap Treasuries and Corporates.

1The S&P 500 or Standard & Poor’s 500 Index is a market-capitalization-weighted index of the 500 largest U.S. publicly traded companies. You cannot invest directly in an index. TR, “Total Return”, represents the index with dividend income reinvested.
2VanEck Vectors Gold Miners ETF (GDX) seeks to replicate the NYSE Arca Gold Miners Index (GDMNTR), which is intended to track the overall performance of companies involved in the gold mining industry.
3Source: ETFtrends.com.
4The NYSE Arca Gold BUGS Index (HUI) is a modified equal dollar weighted index of companies involved in gold mining.

SOURCE: https://sprott.com/insights/sprott-gold-report-secular-gold-bull-resumes-with-force/#

American Creek $AMK.ca Reports Commencement of 20,000m Drill Program on Its JV Treaty Creek Property in the Golden Triangle $TUD.ca $SII.ca $GTT.ca $AFF.ca $SEA.ca $SA $PVG.ca $AOT.ca $ESK.ca

Posted by AGORACOM at 11:05 AM on Monday, May 11th, 2020
  • The length of the northeast axis of the Goldstorm System is over 850 meters
  • The Southeast axis is at least 600m
  • The system remains open in both dimensions, as well as to depth.
  • The strongest mineralization encountered to date is from two consecutive 150m step-out holes at the northeast end of the drill grid: GS-19-42 yielded 0.849 g/t Au Eq over 780 m with the 300 Horizon averaging 1.275 g/t Au Eq over 370.5m and GS-19-47 yielded 0.697 g/t Au Eq over 1,081.5m with the 300 Horizon averaging 0.867 g/t Au Eq over 301.5m.
  • Program focused on expanding the mineralized area from these two very encouraging step-out holes.
  • Furthermore, we plan to continue advancing along the NE axis with yet another 150 meter step out hole. The best results from the southeast dimension came from GS-19-52 which yielded 0.783 g/t Au Eq over 601.5m with 1.062 g/t Au Eq over 336.0m within the 300 Horizon.

Cardston, Alberta–(Newsfile Corp. – May 11, 2020) – American Creek Resources Ltd. (TSXV: AMK) (“the Corporation”) is pleased to report that its JV partner Tudor Gold Corp has begun this season’s diamond drill hole program at its flagship property, Treaty Creek, located in the heart of the Golden Triangle of Northwestern British Columbia. Diamond drilling has begun with two drill rigs on the Goldstorm Zone which is on-trend from Seabridges’ KMS Project located just five kilometers to the southwest. These first two drills have begun drilling the initial holes of the 20,000 meter exploration program.

Tudor Gold’s Vice President of Project Development, Ken Konkin, P.Geo., states: “We are very proud of the hard work and dedication that our crews exhibited during the weeks prior to the start of drilling. Due to their diligence in preparing the camp we have been able to start our drill program a month earlier than last year’s program. The priority is to continue to expand the Goldstorm System to the southeast and to the northeast.”

“The current known length of the northeast axis of the Goldstorm System is over 850 meters, and the southeast axis is at least 600 m; the system remains open in both dimensions, as well as to depth. The strongest mineralization encountered to date is from two consecutive 150m step-out holes at the northeast end of the drill grid: GS-19-42 yielded 0.849 g/t Au Eq over 780 m with the 300 Horizon averaging 1.275 g/t Au Eq over 370.5m and GS-19-47 yielded 0.697 g/t Au Eq over 1,081.5m with the 300 Horizon averaging 0.867 g/t Au Eq over 301.5m. Our program will be focused on expanding the mineralized area from these two very encouraging step-out holes. Furthermore, we plan to continue advancing along the NE axis with yet another 150 meter step out hole. The best results from the southeast dimension came from GS-19-52 which yielded 0.783 g/t Au Eq over 601.5m with 1.062 g/t Au Eq over 336.0m within the 300 Horizon.

(The above results were from Tudors news release dated March 3rd, 2020,, in which the following metal prices were used to calculate the Au Eq metal content: Gold $1322/oz, Ag: $15.91/oz, Cu: $2.86/lb. Calculations used the formula Au Eq g/t = (Au g/t) + (Ag g/t x 0.012) + (Cu% x 1.4835). All metals are reported in USD and calculations do not consider metal recoveries. True widths have not been determined as the mineralized body remains open in all directions. Further drilling is required to determine the mineralized body orientation and true widths.)

Tudor Gold and its associated service companies have taken extreme measures to maintain the highest professional standards while working under COVID-19 health and safety protocols. Only essential personnel are permitted to enter the camp and staging areas. An on-site certified paramedic conducts strict daily monitoring of temperatures and general health conditions of personnel and service providers who are working at the project site and the staging area.


Walter Storm, Tudor President and CEO, stated: “I am very pleased with the safe start-up of the 2020 exploration program thanks to the hard work and dedication of our crews. The Company’s intent is to advance the Treaty Creek Project with full recognition and confidence in the recommended COVID-19 safety protocols. The goal for this year is to complete enough drilling that we can begin to delineate a first resource estimation at Treaty Creek.”

Darren Blaney, American Creek President and CEO stated: “2019 was a very successful year at Treaty Creek and this year looks to be far better with an extension of the drilling season and a drill program that is over twice as big as last years. With the recent announcement of working towards a resource calculation along with baseline studies and metallurgical work for an initial economic assessment, Mr Storm was right in calling this a transformational year at Treaty Creek.”

Qualified Person

The Qualified Person for this news release for the purposes of National Instrument 43-101 is the Companys Vice President of Project Development, Ken Konkin, P.Geo. He has read and approved the scientific and technical information that forms the basis for the disclosure contained in this news release.

Treaty Creek JV Partnership

The Treaty Creek Project is a Joint Venture with Tudor Gold owning 3/5th and acting as operator. American Creek and Teuton Resources each have a 1/5th interest in the project creating a 3:1 ownership relationship between Tudor Gold and American Creek. American Creek and Teuton are both fully carried until such time as a Production Notice is issued, at which time they are required to contribute their respective 20% share of development costs. Until such time, Tudor is required to fund all exploration and development costs while both American Creek and Teuton have “free rides”.

Treaty Creek Background

The Treaty Creek Project lies in the same hydrothermal system as Pretium’s Brucejack mine and Seabridge’s KSM deposits with far better logistics.

Sulphurets Hydrothermal System

https://orders.newsfilecorp.com/files/682/55669_1e096bdf247ef89b_001.jpg

To view an enhanced version of this graphic, please visit:
https://orders.newsfilecorp.com/files/682/55669_1e096bdf247ef89b_001full.jpg

About American Creek

American Creek is a Canadian junior mineral exploration company with a strong portfolio of gold and silver properties in British Columbia. Three of those properties are located in the prolific “Golden Triangle”; the Treaty Creek and Electrum joint venture projects with Tudor Gold/Walter Storm as well as the 100% owned past producing Dunwell Mine.

More information about the Treaty Creek Project can be found here: https://americancreek.com/index.php/projects/treaty-creek/home

The Corporation also holds the Gold Hill, Austruck-Bonanza, Ample Goldmax, Silver Side, and Glitter King properties located in other prospective areas of the province.

For further information please contact Kelvin Burton at: Phone: 403 752-4040 or Email: [email protected]. Information relating to the Corporation is available on its website at www.americancreek.com

INTERVIEW: Loncor Resources $LN.ca Is The Small Cap With 2 Mega Producers Behind It $ABX.ca $TECK.ca $RSG $NGT.to $GOLD $NEM

Posted by AGORACOM-JC at 8:43 PM on Sunday, May 10th, 2020
This image has an empty alt attribute; its file name is Loncor-Small-Square.png

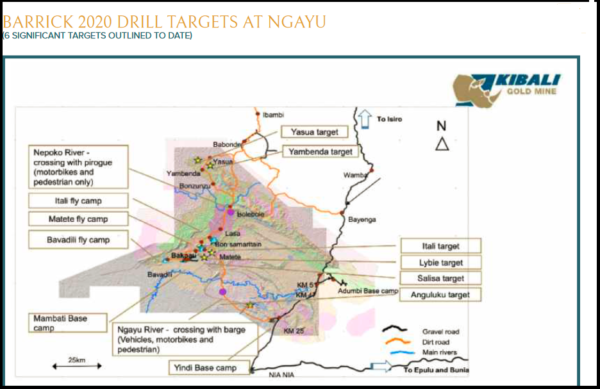
Loncor Resources ( LN:TSX ) is the preeminent gold exploration company to own. Armed with a Barrick JV on their 200km NGAYU Greenstone property anticipates a maiden drill program on multiple targets in 2020. Loncor controls 3.6 million ounces of high grade gold outside of this relationship.

If the JV and Ounces aren’t enough to grab your attention, then look at ownership; African Majors own impressive pieces of Loncor:

Resolute Mining owns 27% and has a 30% ROFR on any Loncor financing, 

Newmont Goldcorp Corporation owns 7.8% of Loncor’s outstanding shares;

and Management ownership is loudest with Arnold Kondrat.  Founder, Chief Executive Officer and director with 28,963,909 shares (or 28.45%).

Loncor is hunting for elephant deposits in elephant country and are inviting everyone for the ride. Grab your favourite beverage and have a listen.

Barrick Eyes Deals as Profit Surges 55% on Higher Gold Prices SPONSOR: Loncor Resources $LN.ca $ABX.ca $TECK.ca $RSG $NGT.to $GOLD $NEM

Posted by AGORACOM at 10:27 AM on Friday, May 8th, 2020

Sponsor: Loncor, a Canadian gold explorer controlling over 3.6 million high grade ounces outside of a Barrick JV. The Ngayu JV property is 200km southwest of the Kibali gold mine, operated by Barrick, which produced 814,000 ounces of gold in 2019. Barrick manages and funds exploration at the Ngayu project until the completion of a pre-feasibility study on any gold discovery meeting their Tier One investment criteria. Newmont $NGT $NEM owns 7.8%, Resolute $RSG owns 27% Management owns 29% Click Here for More Info

This image has an empty alt attribute; its file name is Loncor-Small-Square.png
  • Concerns about the health of the global economy due to the coronavirus pandemic have boosted ‘safe-haven’ gold by 12%

Barrick Gold Corp posted a nearly 55 per cent rise in quarterly profit on Wednesday as gold prices surged, bolstering its ability to snap up mines including in copper, its chief executive said.

Concerns about the health of the global economy due to the coronavirus pandemic have boosted “safe-haven” gold by 12 per cent so far this year, while copper, seen as a bellwether for economic health, is down about 15 per cent.

Barrick CEO Mark Bristow has previously said the world’s No. 2 gold miner could raise its exposure in copper because of its expected higher use in electrification.

He added on Wednesday the relative price performance between copper and gold made deals more attractive.

“(A stronger balance sheet) improves our capacity to take up opportunities that might arise in the short to medium term given the dynamic nature of the global economy,” Bristow told Reuters.

He did not elaborate, but has expressed an interest in acquiring Freeport-McMoran Inc’s flagship Grasberg mine.

Barrick, which maintained its quarterly dividend of 7 cents per share, trimmed its annual production forecast for gold after shutting its mine in Papua New Guinea.

The Canadian miner now expects attributable gold production of 4.6-5.0 million ounces versus 4.8-5.2 million previously.

The government of Papua New Guinea announced in April it would not renew a 20-year special mining lease for the Porgera gold mine, which is jointly owned by Barrick and China’s Zijin Mining, due to environmental damage and social unrest.

Barrick (Niugini) Limited, the local venture in which both miners have a 47.5 per cent stake, had produced about 597,000 ounces of gold in 2019 from the Porgera mine.

Barrick has said it will contest the move, which it regards as “tantamount to nationalization without due process,” and in the meantime has placed Porgera on temporary care and maintenance, while suspending 2020 guidance for the mine.

Bristow said a mediator would be appointed to help negotiations if initial talks between the government and Barrick failed.

The company, with operations in North and South America and Africa, has not closed any of its mines due to coronavirus restrictions which have hit competitors.

Larger rival Newmont, which was forced to shutter some mines in Canada and South America, warned on Tuesday of a financial hit in the second quarter.

Barrick’s first quarter production fell 9 per cent to 1.25 million ounces. Excluding one-off items, Barrick reported a profit of 16 cents per share, in line with analyst estimates.

Source: https://business.financialpost.com/commodities/mining/barrick-reports-55-higher-adj-profit-helped-by-gold-prices 

Gold Stocks Take Flight SPONSOR: Labrador Gold $LAB.ca $RIO.ca $WHM.ca $SIC.ca $NXS.ca

Posted by AGORACOM at 10:02 AM on Friday, May 8th, 2020

SPONSOR: Labrador Gold – Two successful gold explorers lead the way in the Labrador gold rush targeting the under-explored gold potential of the province. Exploration has already outlined district scale gold on two projects, including a 40km strike length of the Florence Lake greenstone belt, one of two greenstone belts covered by the Hopedale Project. Recently acquired 14km of the potential extension of the new discovery by New Found Gold’s Queensway project to the south. Click Here for More Info

  • Gold Bullion Surges above March Lows
  • Gold Mining Equities Track Gold Higher
  • Gold Mining Equities vs. S&P 500 Show Convincing Breakout

Markets Recalibrate

Capital markets and society continue to recalibrate from the enormity of the fallout of the COVID-19 pandemic. As difficult as the current situation is, gold fundamentals continue to improve. Gold, as an investment, offers a hedge against the current financial turmoil and has significant capital appreciation potential in the years ahead.

The magnitude of central banks and government actions over the past several weeks will resonate for the rest of this decade. In our March commentary (March Roars in Like a Lion), we mentioned that we are now in the “end game” where debt explodes in the face of a financial calamity (although no one predicted that it would be a pandemic). We will discuss what near-term options the U.S. Federal Reserve (“Fed”) will likely implement, and how gold is likely to respond. We will also look at the recent move higher for gold mining equities.

Gold Bullion: Increased Demand for Physical Gold

Gold bullion ended April at $1,687, adding $109/oz, or +6.9% for the month. Gold began its surge in early April as physical delivery shortages resulted in gold futures (COMEX, New York) trading wildly higher than spot gold (London). COVID-19 has caused refining capacity for gold to decline and greatly restricted the transport of physical gold from London to New York. Typically, gold futures trade fairly tight with spot gold due to arbitrage, but in early April, the spreads spiked as high as $70/oz. The unprecedented fiscal and monetary policy response to the worst economic shock since the Great Depression has put gold squarely into investors’ minds.

Gold is almost always in contango (longer-dated contracts are more expensive than the near month). In April, parts of the gold futures curve traded in a rare backwardation (the near month contract is more expensive), usually indicative of a supply shortage. With the usual gold channels disrupted, futures are pulling spot prices higher as short positions are closed by going long futures. Compounding the disruption was the growing demand for gold in physical form, fueled by soaring investor buying interest. The unprecedented fiscal and monetary policy response to the worst economic shock since the Great Depression has put gold squarely into investors’ minds.

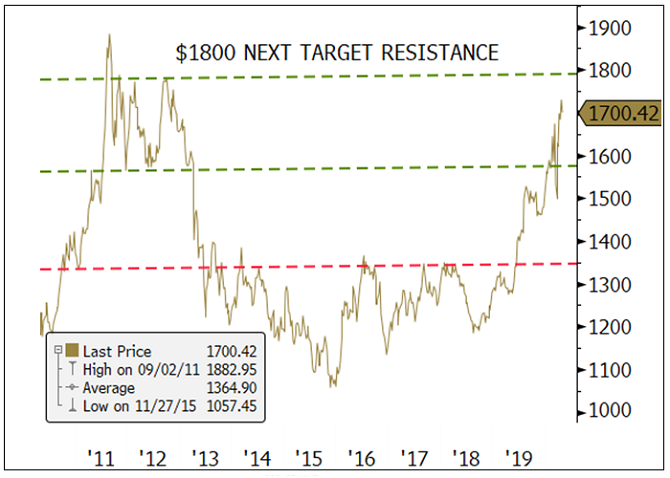
Figure 1. Gold Bullion Surges above March Lows
Our short-term target is $1,800, and we expect to reach new all-time highs.


Source: Bloomberg. Data as of 4/30/2020.

Gold Mining Equities: Convincing Breakout in April

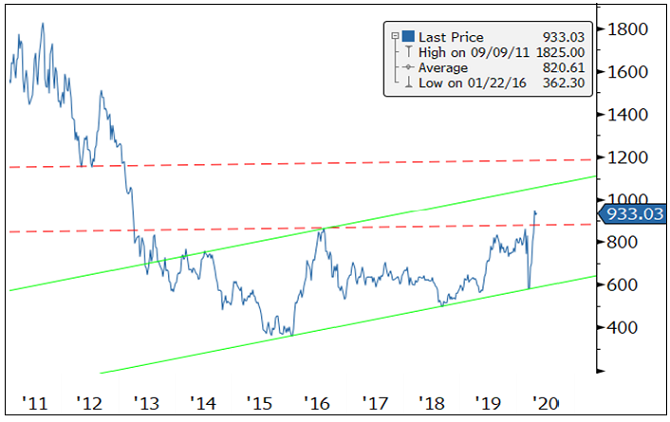
Gold equities broke out of a multi-year resistance level on massive buying flows. Using the NYSE Arca Gold Miners Index (GDM)5 as a reference, the 860 index resistance level was taken out convincingly. As shown in Figure 2, there is very little meaningful resistance until 1,200 (+25%). In March, gold equities, like bullion, experienced a forced liquidation event. Selling in GDX forced the ETF to trade at a significant discount to its underlying net asset value (NAV). Like many other ETFs, the selling volumes in GDX outpaced the liquidity in the underlying securities. Off the lows, the price action as measured by volume, breadth and money flow far exceeds the bullish thrust of the 2019 summer rally. This breakout, without question, is impressive on the technical measures.

Figure 2. Gold Mining Equities Track Gold Higher
The NYSE Arca Gold Miners Index (GDM) has broken out of a broad base pattern; our short-term target is 1,200.


Source: Bloomberg. Data as of 4/30/2020.

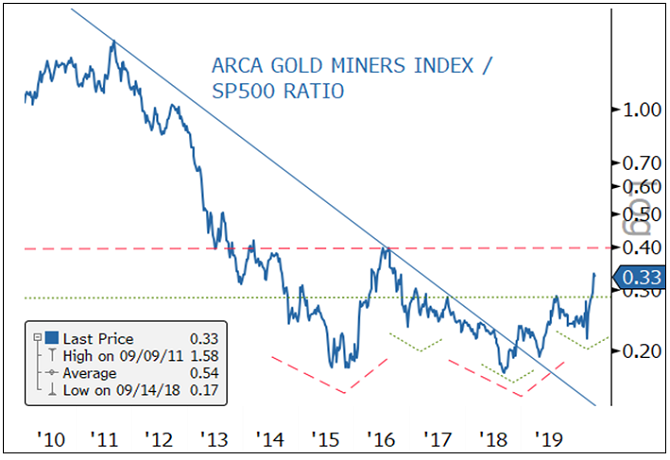
The absolute price action is impressive, but when measured relative to the S&P 500 Index6 (Figure 3), the chart pattern looks even more impressive. Typically, new market leadership is more evident when measured against the broad market index. As shown in Figure 3, the NYSE Arca Gold Miners Index (GDM) relative to the S&P 500 Index has put in a very bullish bottom base pattern. There is a double bottom pattern set up with the right bottom shaping a head and shoulder breakout pattern. This bullish pattern within a bullish pattern is a very positive sign.

Figure 3. Gold Mining Equities vs. S&P 500 Show Convincing Breakout
GDM is putting a remarkable long-term basing chart pattern and breaking out in the medium term.


Source: Bloomberg. Data as of 4/30/2020.

Increasing Revenue with Deflationary Input Costs

The gold mining industry, like many other industries, is experiencing disruptions due to pandemic shutdowns. But unlike other industries, gold producers are experiencing a steep increase in the selling price of its product. Gold bullion is up +11% year to date and up over +31% year-over-year (through April 30, 2020). From a cost perspective, energy and labor are typically the two highest cost components for miners. The dramatic fall in crude oil is a rare function of both a supply shock (the Organization of the Petroleum Exporting Countries [OPEC] price war) and a demand shock (pandemic shutdowns) co-occurring. The enormity of both events will have lasting price consequences well beyond a few quarters. Labor, the other component, has been devastated by the pandemic. A tremendous labor crisis is occurring globally. In the U.S. alone, jobless claims have now exceeded 30 million, a crushing toll. Both of these conditions are deflationary shockwaves that will ripple out to all corners of the economy. There is virtually no major cost component (reagents, consumables, equipment) that will not see lower costs. Though near-term gold company earnings may be volatile due to COVID-19 disruptions, the potential increase in long-term profit margins may be unlike anything seen in recent history, and most comparable to the 1930s when gold company revenues soared and costs plummeted.

As QE (quantitative easing) Infinity continues to expand and ZIRP (zero interest rate policy) takes hold in a likely recession (or depression), growth equities will become highly sought after. Gold mining equities will have one of, if not the highest growth in earnings of any industry. Because of the nature of its revenue product (gold bullion), and its input costs (deflation), gold equities will likely develop into a convexity trade. Relative to the broad market, gold mining equities have a more direct path to higher prices. In the absence of earnings and post liquidity lift, general market equities require QE to increase stock prices by suppressing the risk-free rate and credit spreads, thereby reducing the discount rate used to calculate the present value of cash flows. Currently, cash flows are near impossible to forecast. The broad market equity risk is if earnings do not recover for more than a year due to COVID-19 and/or if a risk event pushes up credit spreads (i.e., credit defaults). Both risks are quite high compared to the risk for gold mining equities.

The Likely Market Impact of the Fed Stimulus and Fiscal Policy Response

At the end of April, the Fed Balance Sheet had expanded to $6.66 trillion (previous high was $4.5 trillion) and will climb higher. The final number is unknown due to moving variables and the lack of visibility, but $10 trillion by summer is in the ballpark. The deficit for 2020 is estimated to be $3.7 trillion (18% to 20% of gross domestic product [GDP]), an all-time high with risk to the upside. The debt-to-GDP current expected range of 110% to 120% will probably prove to be too low despite being the highest ever. More billions of dollars, week by week, are being added to a dizzying array of Federal programs, credit facilities and swap lines to mitigate the damage of the pandemic.

The amount of debt is genuinely numbing in its size and scale and will keep growing. Long term, there is very little hope that the economy can grow out of this debt load. To manage this debt, we believe the Fed will need to implement three broad conditions: 1) negative real yields, longer and lower than previously expected; 2) yield curve control to maintain a flat and low rate structure, and 3) a weaker or capped U.S. dollar.

1) Negative Real Interest Rates

We have discussed numerous times the importance of negative real interest rates in reducing (debasing) the debt. The huge increase in debt levels and the likely lingering effects of COVID-19 on the global economy will assure that negative real interest rates will be here for years. There will be a persistent and growing erosion of wealth via negative real yields.

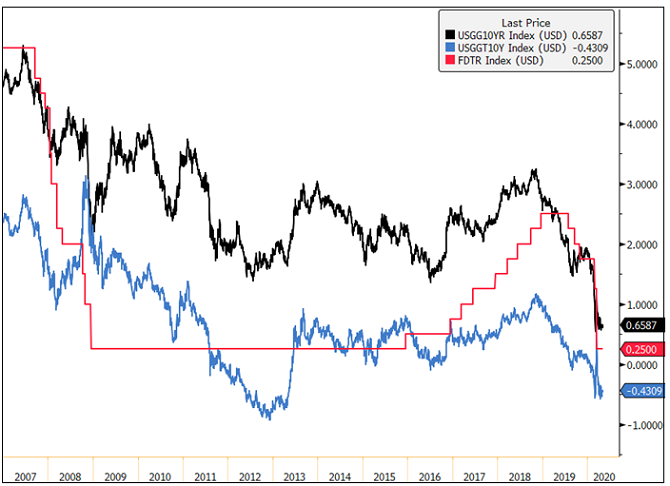
Figure 4. U.S. Real Yields Near Zero
The Fed Funds target rate is 0.00-0.25%, and real yields are approximately -0.43%. Gold tends to thrive in low-interest rate environments. 

Source: Bloomberg. Data as of 5/5/2020. Nominal yields are measured by the USGG10YR Index, representing U.S. generic 10-year bond yields. Real yields are measured by USGGT10Y Index, representing U.S. 10-year TIPs (Treasury Inflation Protected) yields. The FDTR Index represents the Federal Funds Target Rate, which is set by the central bank in its efforts to influence short-term interest rates as part of its monetary policy strategy.

2) Yield Curve Control

Yield curve control was last used during World War II to finance the war. As the term implies, the U.S. government exerted control on both ends of the curve. Yields were capped with the short end lower than the long end. The long end was capped at around 2% irrespective of the economic condition. Controlled low yields provided a stable and manageable interest expense. By issuing more Treasuries in the short end, the government encouraged investors to borrow at the short end and to lend in the long end. Also, by issuing more at the short end of the curve, it ensured there was constant ample liquidity searching for yield. Today’s world is vastly different, but we expect to see a similar effort to control the yield curve. The Fed will continue to use QE Infinity to monetize the majority of bond issuances with an effort to keep rates as low as possible and the curve as flat as possible. For example, the $2.2 trillion of fiscal stimulus announced in March has already been monetized; 10-year Treasury yields are around 0.60% and the Fed Fund Rate is at zero.

3) Lower or Capped U.S. Dollar

We have also discussed the importance of a weaker U.S. dollar in previous commentaries. The impact of the global pandemic and the total collapse of crude oil pricing has elevated the importance of the U.S. dollar significantly. The sudden deceleration in global economic activity has dramatically reduced the flow of U.S. dollars. The U.S. dollar is the world’s reserve currency; about 60% to 70% of the world’s economic activity is transacted in U.S. dollars. Crude oil is one of the most critical sources of U.S. dollar liquidity. At year-end, an oil market of 100 Mb/d (million barrels a day) at $50 per barrel equated to $1.8 trillion of yearly U.S. dollar flows. Today, at 75 MB/d at $20 per barrel, crude oil-based U.S. dollar flows are now at $0.55 trillion. Now apply that to every industry that transacts globally, and the magnitude of U.S. dollar funding shortage becomes apparent.

There is an estimated $12 to $13 trillion of U.S. dollar-denominated debt held by foreign holders. The U.S. dollar is now the biggest financial short and there is a massive ongoing short squeeze as the global shutdown makes funding and servicing of this debt difficult. That the U.S. has launched trillions in fiscal and monetary stimulus, and the U.S. dollar has barely budged is an alarming sight. A runaway U.S. dollar in a financial and economic crisis coupled with a deflationary shockwave would be nothing short of a disaster scenario. In March, we had a small taste of what a U.S. dollar funding shortage and dollar hoarding had on global liquidity.

If the Fed has any chance of making this version of MMT (modern monetary theory) work, it will do everything in its power to keep the U.S. dollar in check and control a flat yield curve. Fighting the Fed’s efforts is this significant mismatch between U.S. dollar assets and liabilities. Historically, this has been the justification to devalue the dollar (or the prevailing reserve currency at the time) to bail out the world. Price regime changes typically occur with currency debasements. If we reach the point where the U.S. dollar stages a significant uncontrolled breakout higher, gold will spike as the market begins to price in the possibility of a reset of asset prices. At that point, gold would become the ultimate convexity trade for U.S. dollar debasement. Dollar debasement is a key tail risk in the end game.

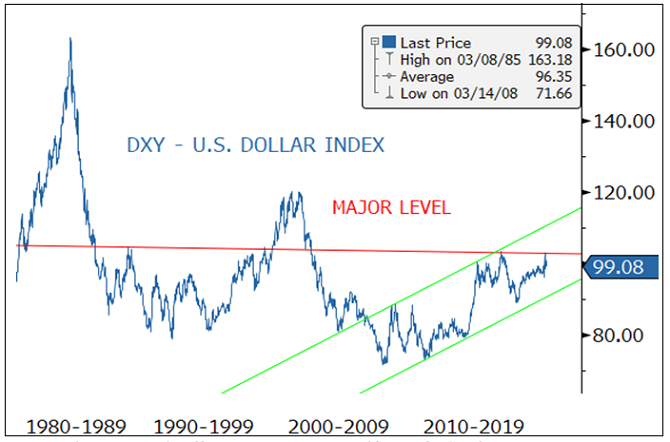
Figure 5. The U.S. Dollar (DXY): Highs of March 2020 will be a Crucial Level


Source: Bloomberg. Data as of 4/30/2020.

A Realignment of Asset Classes

In just a few months, a global pandemic has caused a shutdown of the economy to an estimated tune of -25% annualized GDP for Q2, over 30 million U.S. workers filing jobless claims and trillions of dollars (and growing) added to the debt. Whether the news of the virus gets better or worse in the next few quarters, we will be in a ZIRP environment for years due to the debt level. With the Fed capping rates, yields will remain low and the curve flat whether the economic recovery is V-shaped, U, L, or any other alphabet shape (yield curve control). The economy will no longer determine the level of interest rates and the yield curve. The Fed will keep real interest rates negative; the only question is how negative? Investing in Treasuries has moved from a “return on capital” to a “return OF capital” proposition. Investing in Treasuries today is an erosion of wealth in real dollar terms.

The broader U.S. stock market has now recovered a significant part of its decline entirely due to the sheer amount of stimulus thrown by the Fed. To value the equity market today would require a look past a deep valley of uncertain duration, to the other side that may be changed entirely. As companies pull guidance due to the lack of visibility, equities can only rise mainly by never-ending liquidity. Equity valuations are already back to their all-time highs. Equity markets, like the bond market, will continue to decouple from the economy further.

Gold Makes Sense as Equity Volatility Increases 

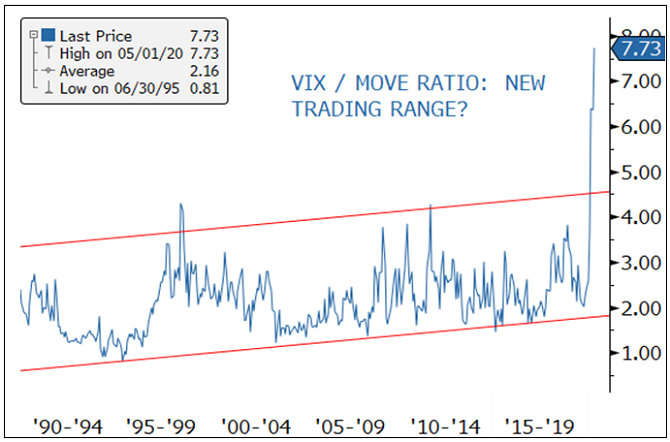
Moreover, if we are correct that the Fed’s main risk focus is containing the U.S. dollar and controlling the yield curve, equity risk (volatility) will trade higher vis-a-vis the U.S. dollar and bond prices than historical parameters (Figure 5). If this becomes the new reality, this repricing of volatility will have a dramatic effect on all asset classes. It will mean more effective equity hedges will be needed, such as gold. The one risk that the Fed cannot remove entirely is a tail risk event in which this current environment is a breeding ground.

Figure 6. Equity Risk Volatility is Trading Higher than Bond Volatility
The VIX7 (CBOE Volatility Index for equities) has likely entered into a new trading range relative to the MOVE Index8 (Implied volatility of Treasuries across the yield curve) with far-reaching consequences.


Source: Bloomberg. Data as of 4/30/2020.

SOURCE: https://sprott.com/insights/gold-stocks-take-flight/

https://sprott.com/insights/gold-stocks-take-flight/

Scotiabank’s Metals Business Closure Could Impact Daily Gold Price Discovery SPONSOR: Labrador Gold $LAB.ca $RIO.ca $WHM.ca $SIC.ca $NXS.ca

Posted by AGORACOM at 11:03 AM on Wednesday, April 29th, 2020

SPONSOR: Labrador Gold – Two successful gold explorers lead the way in the Labrador gold rush targeting the under-explored gold potential of the province. Exploration has already outlined district scale gold on two projects, including a 40km strike length of the Florence Lake greenstone belt, one of two greenstone belts covered by the Hopedale Project. Recently acquired 14km of the potential extension of the new discovery by New Found Gold’s Queensway project to the south. Click Here for More Info

  • We were already having a tough time getting the amount of physical that we require. I think it’s going to be that much harder – Sprott Inc CEO Peter Grosskopf

(Kitco News) Turbulent times of first trying to sell, then downsizing its bullion desk, Canadian Bank of Nova Scotia (Scotiabank) (TSX: BNS.TO) now appears to be closing its metals business, according to Reuters. 

Reports came to light on Tuesday with Reuters citing two sources familiar with the matter. “Scotia had a global call with all its metals staff and said it was shutting down its metals business,” one source said. “The plan is to unwind the metals business,” said another one.

The goal is to reportedly wind down all existing metals business by the beginning of 2021, the sources added.

The move could mean more challenges for the gold market that has already seen a supply crunch and wide price spreads between spot and futures prices, analysts told Kitco News. 

“The Scotiabank shuttering of its metals business is a sign of these historic times of markets upheaval. However, such is not a shock to the metals marketplace that has in recent weeks already seen many companies and mines so severely impacted by the Covid-19 pandemic,” said Kitco’s senior technical analyst Jim Wyckoff. 

“From my perspective the Comex futures market has at least temporarily overshadowed the spot, or cash, gold market in terms of accurate daily price discovery, given the significant slowing of spot business and spot market-making. Thus, the gold market from a price perspective will take this news in stride,” Wyckoff noted.

One fear is that spot prices could become less reliable, which could be a a big hit for the gold market that has already been struggling with a wide spread between spot and futures prices due to all the logistical issues connected with all the COVID-19 shutdowns. 

“It definitely will have an effect on price discovery. The less big banks that are participating in the metals markets, the less reliable those prices coming out of London will be, which we’ve already seen has been a problem in the past couple of weeks,” Gainesville Coins precious metals expert Everett Millman told Kitco News on Tuesday. 

The problem could be made worse if more banks like this close their bullion businesses, Millman added. “A lot of people are worried that Scotiabank is just going to be the first of many banks right now to kind of exit the metals business. We have to see if there’s a domino effect that exacerbates the problem,” he said.  

Another area of concern is some disruption on the client inter-phase side, said Kitco Metals global trading director Peter Hug.

“I would imagine Scotia has financing projects/lease agreements, metals accounts for their clients, as well as inventory financing deals with dealers. Scotia, I assume will attempt to sell these deals or handle them to maturity … Clients that may need new credit facilities, with other bullion banks or mines that have financing in place may be a bit nervous and are likely already looking for new options,” Hug said. 

The news of Scotiabank winding down its bullion desk might also add pressure to the supply side, said Sprott Inc CEO Peter Grosskopf. 

“We were already having a tough time getting the amount of physical that we require. I think it’s going to be that much harder,” said Grosskopf. “It’s almost the opposite of what’s happening in the oil market right now.” 

Other analysts said they believe that the nature of the physical market is not going to change.

RBC Wealth Management managing director George Gero said that the spot price was never really reliable because “it is not liquid and it is full cash, there is no margin.”

“Lately I’ve seen a number of banks move their trading departments or close their trading departments. A lot of it has to do with other things like Brexit. The problem of the traders all having to work remote from home,” Gero added. 

The character of investments has also been changing, he noted. “The problem with the trading of the gold is that it’s just changed a lot. But it will not affect anything because you have more central bank business and traditionally the central bank business is in the spot market.”

Back in 2017, Scotiabank tried to sell ScotiaMocatta, the world’s oldest gold trader owned by Scotiabank.

Unable to finalize the sale, however, Scotiabank ended up keeping its precious metals trading business but downsizing it at the beginning of 2018.

Only around 15 people currently work in Scotia’s metals business, Reuters said. Seventy-five percent of the employees are on the precious metals side and the rest are on the industrial metals side. Just five years ago, the unit had about 140 employees with offices across the world.

ScotiaMocatta’s history goes all the way back to 1600s when Moses Mocatta partnered with the East India Co. to ship gold to India. The operations were set up in London in 1684. In 1997, Scotiabank acquired Mocatta Bullion by purchasing it from Standard Chartered.

Source:https://www.kitco.com/news/2020-04-28/Scotiabank-s-metals-business-closure-could-impact-daily-gold-price-discovery-analysts.html

By Anna Golubova

The DRC Should Become the Largest Mining Economy in Africa SPONSOR: Loncor Resources $LN.ca $ABX.ca $TECK.ca $RSG $NGT.to $GOLD $NEM

Posted by AGORACOM at 10:07 AM on Wednesday, April 29th, 2020

Sponsor: Loncor, a Canadian gold explorer controlling over 3.6 million high grade ounces outside of a Barrick JV. The Ngayu JV property is 200km southwest of the Kibali gold mine, operated by Barrick, which produced 814,000 ounces of gold in 2019. Barrick manages and funds exploration at the Ngayu project until the completion of a pre-feasibility study on any gold discovery meeting their Tier One investment criteria. Newmont $NGT $NEM owns 7.8%, Resolute $RSG owns 27% Management owns 29% Click Here for More Info

This image has an empty alt attribute; its file name is Loncor-Small-Square.png
https://d3gvybjp3zjp3i.cloudfront.net/wp-content/uploads/2020/04/drc-money-new-640x480.jpg

“Investment appetite in the resources sector is low and investment hurdles have been raised which means that only the best investment jurisdictions, like the Democratic Republic of Congo, will receive much needed investment for growth.”

This is according to Dr Tony Harwood, president and CEO of Montero Mining and Exploration.

“The slow-down in the global economy has depressed metal prices and the advent of the Coronavirus (COVID-19) has also exacerbated this, bringing many countries into a negative growth and some in recession,” Dr Harwood, who is also an ambassador for DRC Mining Week, continues.

In addition, the implementation of the new DRC mining legislation has caused concerns with existing investors and potentially new foreign investors to the DRC.

Despite these challenges progress made on some very exciting mining and exploration projects, notably developments of the world class Kamoa-Kakula copper project and Kipushi zinc project, notes Harwood.

“Other highlights for the DRC include the development of the high grade Bisie Tin project as well as seeing gold production being achieved at Kibali gold mine,” Harwood points out.

Positive approach needed

In addressing the challenges surrounding the country’s divisive mining legislation Harwood encourages current investors to discuss changes in a positive manner with government for an equally equitable solution for both parties.

Harwood believes the development of the Kamoa-Kakula copper project will open the Katanga province and encourage further exploration and development not only in this area but the country as well.

“Its success will aid greatly in the development of the DRC mining sector not only from a production perspective but also by increasing employment, skills transfers, taxes paid, infrastructure development both in the DRC and in neighbouring countries,” states Harwood.

Looking to the future Harwood is adamant good mining legislation with investor incentives will boost local capital and entice foreign investors will ensure growth and if the DRC gets this right it will become the largest mining economy in Africa.

Harwood founded and listed the company on the TSX Venture exchange. He is also a non-executive director of private and public companies largely operating in Africa. In all he has listed three companies over the last 10 years all of which operate in Africa from a base in Africa.

Between 2006 and 2009 he was the President and CEO of Africo Resources, a company attempting to develop a high-grade coper project in Katanga.

During the exploration and development period the company entered various cooperative community development programmes with local villages surrounding the project.

These programmes largely revolved around agriculture and the company assisted in setting up community co-operatives for growing vegetables to be sold to the company and the surrounding communities. “In addition, we also set up health screening initiatives with the DRC health administration in and around our project area,” explains Harwood.

“In 2007 to 2008 we also distributed 328 wheelchairs for children. These had been designed for use in the country and had thick rubber tyres – this brought children a new mobility and enabled them to get to school and participate in their communities,” he concludes.

Source: https://www.miningreview.com/base-metals/the-drc-should-become-the-largest-mining-economy-in-africa/

The Fed Can’t Print Silver SPONSOR: Affinity Metals $AAF.ca $SII.ca $TUD.ca $GTT.ca $AMK.ca $OSK.ca $RKR.ca

Posted by AGORACOM at 11:21 AM on Tuesday, April 28th, 2020
This image has an empty alt attribute; its file name is Affinity_Metals_Corp_Logo.png

Sponsor: Affinity Metals Corp. (TSX-V: AFF) is a Canadian mineral exploration company building a strong portfolio of mineral projects in North America. The Corporation’s flagship property is the drill ready Regal Property near Revelstoke, BC where Affinity Metals is making preparations for a spring drill program to test two large Z-TEM anomalies. Click Here for More Info

As a general rule, the most successful man in life is the man who has the best information Richard (Rick) Mills, Ahead of the Herd

April 27, 2020 (Investorideas.com Newswire) Silver prices will test $19 an ounce later this year on the back of heavy investment demand, as the coronavirus continues to depress markets and push investors in the direction of safe havens like precious metals.

That is the conclusion of The Silver Institute’s annual World Silver Survey, compiled by research firm Metals Focus and released in April.

Silver prices are driven by mine supply/ recycling and demand from both retail/ institutional investors and industry.

Over half of silver demand comes from industrial uses like solar panels, electronics and automotive parts. (Around 20 grams of silver are required to build a solar panel)

While most of the world’s mined gold is still around, either cast as jewelry, or smelted into bullion and stored for investment purposes, the same cannot be said for silver. It’s estimated around 60% of silver is utilized in industrial applications, leaving only 40% for investing. Of the 60% used for industrial applications almost 80% ends up in landfills.

The drop in demand for most goods and services owing to covid-19 doesn’t exempt silver – industrial fabrication is seen falling by 7%, along with jewelry and silverware offtake – but the report projects these declines will be offset by a 16% increase in silver bar and coin demand. There is also expected to be strong inflows into silver-backed ETFs as well as net buying by institutional investors on both the futures and OTC markets.

And while the white metal, sometimes called “poor man’s gold”, is expected to be in surplus again this year, the Silver Institute says the glut will be limited (to 14.7 million ounces, 53% smaller than in 2019), by a number of government shutdowns in top producers Mexico and Peru. As of April 3rd silver mine closures had restricted 40% of global production.

The Silver Institute therefore expects silver prices, currently trading around $15 an ounce, to hit $19/oz before year-end, possibly even outperforming gold on the back of its historically low relative value. If that happens, it would be a repeat of silver’s pattern last year.

Catching gold’s wave

In analyzing silver we also need to look at gold. The precious metals often follow each other’s price movements and they are frequently found together in mineral deposits.

Silver and gold both spiked last summer after the US Federal Reserve began cutting interest rates to deal with slowing global growth and signs of a worsening US economy. In July the Fed lowered rates three times before freezing the federal funds rate at a range of 1.5 – 1.75%. (they have subsequently been cut to near 0%)

Rate cuts, along with similarly dovish policies among other central banks, a record $17-trillion of negative-yielding sovereign debt, and safe-haven demand due to tensions with Iran, to name a key issue, powered the precious metals to new heights.

Silver prices rose 15% in 2019, helped by a 12% increase in silver investment demand – the highest annual growth since 2015. 

The onset of the coronavirus, first appearing as an epidemic in China, then spreading to Iran and South Korea, before becoming a full-blown pandemic in mid-March, has meant high volatility for gold and silver.

We’ve seen gold spike on safe-haven demand, as investors piled into gold ETFs, US Treasuries and the US dollar, only to fall sharply mid-March, as traders sold their gold holdings to cover losses in other assets

Since the beginning of April gold has surged, reclaiming $1,700/oz on the back of a record $2.2 trillion spending package announced by the US government, to combat the economic fallout from covid-19.

Other central banks have launched huge stimulus measures to head off, or more likely dampen, the effects of a global recession or even depression.

On April 14 Comex gold futures for June delivery vaulted to $1,785 an ounce, the highest since October 2012. Although gold prices have slipped back a bit, currently trading around $1,720/oz, some analysts see the potential for another leg up. Bloomberg quoted Hans Goetti, founder and chief executive officer of HG Research, saying:

“What’s happening here is that the Fed is expanding its balance sheet and every other central bank in the world is doing the same,” he told Bloomberg TV. “What you’re looking at is massive currency debasement in the long term. That’s the major reason why gold is higher, and I would think that over the next few weeks or months, we’re probably going to retest the high that we saw in 2011” (when gold passed an all-time high of $1,900/oz).

Another factor in gold’s favor is negative real interest rates.

Many countries including the United States have seen bond yields approach or even go below 0%. When real rates (yield minus rate of inflation) turn negative, investors tend to rotate from bonds into gold.

And while securities analysts quoted by Bloomberg expect the Federal Reserve’s renewed quantitative easing, combined with large fiscal stimulus (spending), could see long-end rate rise during the recovery phase of coronavirus, they don’t see that happening without inflation, “which should keep real rates suppressed.”

This week, Bank of America released a forecast predicting gold will rocket as high as $3,000 an ounce within 18 months.

According to Marketwatch, BofA Global Research raised its 18-month price target from an earlier $2,000, citing the prospects of endless monetary expansion from central banks, including the Federal Reserve, to limit the economic damage from the COVID-19 pandemic.

“The rather lofty upside gold price forecast from Bank of America continues to echo in the marketplace with the widely publicized quote ‘the Fed can’t print gold’ a very strong point for the bull camp,” analysts at Zaner Metals wrote in a daily update.

As we showed in a previous article, there is a close relationship between gold and debt-to-GDP ratios.

Undervalued silver

Gold and silver prices are often compared, to get a sense of which direction each are headed. The gold-silver ratio is the amount of silver one can buy with an ounce of gold. Simply divide the current gold price by the price of silver, to find the ratio.

When gold is over-valued compared to silver, investors take advantage of the arbitrage opportunity, by selling some of their gold holdings to buy silver. The opposite occurs when silver is over-valued compared to gold. In that situation, precious metals investors sell silver to buy gold.

The higher the number, the more undervalued is silver.

The current gold-silver ratio, 113:1, is double the historical ratio of 50-60 ounces of silver to one ounce of gold, meaning that silver is highly undervalued compared to gold. It means an investor with an ounce of gold could sell his gold for 113 ounces of silver.

All the bullish factors for gold are in place: a “black swan” event that has created huge fear and uncertainty, imploding global stocks and sending traders/ investors flocking to the safety of havens like the US dollar, US Treasuries and precious metals. The demand for Treasuries has pushed up their prices, causing their yields to fall to new lows. Negative real yields (yields minus inflation) are bullish for gold, and we expect real yields to remain negative for some time.

Remember, gold rises proportionally to debt. As long as governments are wrangling the coronavirus, we fully expect national debt piles to keep growing. Indeed the political pressure on governments to help the most vulnerable in society, for fear not only of losing power, but in some countries, extreme social unrest, is bound to keep the stimulus taps gushing.

While demand for silver, like for most industrial metals, will fall during this period of virus-related uncertainty, after the pandemic is beaten, we expect it to come roaring back, and the extremely out-of-whack gold-silver ratio to correct, in silver’s favor.

Silver mines, ranked

Silver supply is sensitive to mine production cuts – as we have seen recently with coronavirus-related stoppages. However, silver is also vulnerable to supply slippage, more so than gold, because there are relatively few pure-play silver mines.

Only around 30% of annual supply comes from primary silver mines while more than a third is produced at lead/zinc operations and a further 20% is from copper mines. Over two-thirds of the world’s silver resources are sourced from polymetallic ore deposits.

That makes silver quite a bit different from gold, in that primary gold deposits, with relatively few other minerals, are common. Large deposits of gold are also found in copper-gold porphyries.

Not so for silver, which most often has to be coaxed out of lead and zinc ores, followed by mines specializing in copper and gold, in that order.  Only twenty eight percent of global silver production is sourced from primary silver mines. Last year’s World Silver Survey delineated the world’s largest primary silver mines. Topping the list was Fresnillo’s Saucito mine in Mexico, which in 2018 produced 19.9 million ounces. Second spot went to Polymetal’s Dukat mine in Russia (16.5Moz), followed by Buenaventura Mines’ Uchucchacua mine in Peru, producing 15.4Moz. According to the US Geological Survey, Mexico is by far the largest producer, outputting 6,300 tonnes in 2019, followed by Peru and China, at a respective 3,600t and 3,800t. Next on the list are Russia, Poland and Australia. Global silver production in 2019 totaled 27,000 tonnes, or 868 million ounces. 

Where are the world’s largest silver mines, including mines that produce silver as a by-product of other metals?

The 2020 Silver Survey has KGHM Polska Miedz’s three copper-silver mines in Poland – Lubin, Rudna and Polkowice-Sieroszowice – leading by a long shot, at 40.2Moz in 2019.

That is almost twice the production of number 2 Penasquito (22.7Moz) and over double Dukat’s 19.3Moz. Saucito, ranked highest last year in primary silver mine production in 2020, is the fourth-largest mine in the world containing silver and other metals.


Poland’s Kupferschiefer silver

State-run Polska Miedź (KGHM) is the second largest silver producer in the world, behind only Fresnillo, and the sixth biggest copper miner. 

Why is so much silver produced from one company, KGHM Polska Miedz, versus Mexico and Peru, which are more closely associated with silver mining?

To know the answer, we must first understand Poland’s giant “Kupfershiefer” copper-silver deposits, of which the Lubin, Rudna and Polkowice-Sieroszowice mines, containing 1.4 billion ounces of silver reserves, are a significant part.

Sedimentary-hosted stratiform copper deposits are among the two most important copper sources in the world, the other being copper porphyries. They typically range from 1.6 million to 170 million tonnes copper ore, grading between 0.7% and 4.2%, with a median of 14 million tonnes at an average grade of 1.6% Cu, according to a 2019 academic paper, ‘The Kupferschiefer Deposits and Prospects in SW Poland: Past, Present and Future’.

Sedimentary copper deposits are formed in ocean basins, where copper and other minerals travel up through porous lithologies such as sandstone and become trapped in the upper sequence of sandstone and overlaying it black shale and limestone.

Red-bed deposits, so named due to oxidation resulting from exposure to the atmosphere, are divided into volcanic and sedimentary.

Kupferschiefer deposits are similar to red-beds but larger, even regionally extensive. They typically form in a marine setting, after land is gradually submerged into a shallow sea, then overlain by sedimentary rocks – which formed from the gradual deposition of the carcasses of dead sea creatures, onto the ocean floor.

A classic “Kupferschiefer” consists of three main layers – sandstone, bituminous shale and limestone overlain by evaporates often containing oil and gas. Copper-containing fluids migrate up through the sandstone and get trapped by the carbon-rich copper shale. This is where most of the mineralization is concentrated, although it can also be found in the sandstone, limestone, or a combination of all three layers.

The Kupferschiefer copper belt that underlies Germany and Poland is among only three giant sediment-hosted copper deposits in the world. It is also within an elite 1% of deposits that contain over 60 million tonnes of copper.

Orebodies can range in thickness from 0.3 m, contained largely within the black shale of the Kupferschiefer sensu stricto, up to more than 50 m, where sublevel stoping, backfilling, and pillar mining reflect the pervasive mineralization, states a research paper.

According to the Polish Geological Institute, Poland holds the largest economic copper resources in Europe, about 36 million tonnes, and the most anticipated economic silver resources on the continent, about 3.4 billion troy ounces.

Other metals recovered from copper ores at Poland’s Kupferschiefer deposits include gold, platinum, palladium and rhenium.

Despite being a small country, about the size of New Mexico, Poland produced 54.6 million ounces of silver in 2019, up 18% from 2018, mainly as a product of copper mining.

The richest silver deposits are located in the Lower and Upper Silesia regions, where the first shallow mines pre-date the Roman Empire, going back as far as 1136 AD.

According to the US Geological Survey, the massive volume of metal in Poland’s Kupferschiefer deposits is due to continuous mineralization that extends down dip and laterally for kilometers.

Identified resources within the giant Lubin-Sieroszowice deposit, are 1.6 billion tonnes of ore containing 30.3 million tonnes of copper and 2.7 billion ounces of silver, at average grades of 1.63% Cu and 57 g/t Ag. Reserves are 23.7 million tonnes copper and 1.4 billion ounces silver.

The strongest copper sulfide mineralization occurs in the black clay shales, including chalcocite, bornite, covelline and chalcopyrite, accompanied by minerals associated with silver, native silver, lead, zinc, cobalt and nickel.

A comparison at this point is interesting. #1 primary silver mine Saucito contains 130.3Moz in reserves, at an average silver grade of 272 g/t Ag. #2 is Dukat, with 93.4 Moz in reserves averaging 4.1 g/t Ag. The third largest primary silver mine, Uchucchacua, has 98.5Moz at 294.2 g/t.

Lubin-Sieroszowice dwarfs all three, at 10 times the reserves of Saucito, 15 times those of Dukat, and 14 times Uchucchacua’s. (Saucito and Uchucchacua are admittedly much higher-grade)

Minerals from three underground mines – Lubin, Polkowice-Sieroszowice and Rudna – are extracted using the room and pillar method at depths of between 600 and 1,250 meters. Expected minelife is 50 to 60 years, producing at a rate of 30 million tonnes a year. Consider that three of the four original mines have been producing since the late 1960s. They’ve already been going for 50+ years, yet they have another 50-60 more years to go and mineralization is open down dip.

The earliest exploration dates back to 1914, when German geologists conducted studies of the Zlotoryja region, and later, Grodziec. The first mine, Lena, started in 1936 but production was halted due to the onset of World War Two.

In 1959, 24 drill holes outlined the Lubin-Sieroszowice deposit, found at depths of between 400 and 1,000 meters. A resource estimate tallied indicated resources of 1.364 billion tonnes of ore grading 1.42%, containing 19.34 million tonnes of copper and about 1.157 billion ounces of silver.

Copper mining began in 1968 with the commissioning of two mines, Lubin and Polkowice.

According to KGHM’s 2019 results, the Lubin, Polkowice-Sieroszowice and Rudna mines produced 1,400 tonnes of silver last year, or 45 million ounces, at an average 48.7 g/t Ag.

In 2014, a project called “Deep Glogow” began mining from below the 1,200m level, using infrastructure from Rudna and Polkowice-Sieroszowice. The project contains 265.5 million tonnes grading 1.6% copper and 54 g/t silver, and has a minelife of 40 years.

There are also three undeveloped deposits to the north with identified resources (2018) of 139,535 million tonnes of ore including 2.2 million tonnes of copper and 356.3 million ounces of silver. And this year, 2020, Zielona Góra Copper (a Canadian company) documented a new Cu-Ag deposit “Nowa Sól” located northwest from the Lubin area. This new deposit has an estimated resource of 848 MT of copper and 0.036 MT of silver.

CESAR copper+silver project

The reason we have spent so much time writing about Poland’s Kupferschiefer is because of Max Resources (TSX.V:MXR).

Since November, Max’s geological teams have been identifying copper and silver targets within a 120 km x 20 km area, at their CESAR copper+silver project in northeastern Colombia.

Max field crew has been mapping copper-silver bearing stratabound horizons, rock chip channel sampling across mineralized beds and wall rock and following continuity of identified horizons along strike, to determine potential size prior to drilling.

The Vancouver-based company sees similarity of mineralization at the CESAR project to Kupferschiefer as a new giant sediment-hosted coppersilver mineralized system.

In a Feb. 27 news release, Max notes that its recent AM North and AM South discoveries are hosted in well-bedded sandstone-siltstone similar to KGHM’s monster “Kupferschiefer” mines in Poland.

In an earlier interview with AOTH, Max’s head geologist, Piotr Lutynski, said Colombia’s stratigraphy is similar to his homeland, Poland, and its cluster of Kupferschiefer sediment-hosted copper-silver deposits.

The last news release from CESAR concerns the AM South discovery – which features a stratabound copper-silver horizon, with mineralized structures totaling over 5 km of strike length. Earlier this year, sampling from 0.1 to 25-meter intervals returned highlight values of 5.4% copper and 63 g/t silver.

Having recently discovered a 10-meter by 2-meter panel which returned copper and silver grades of 3.5% Cu + 26 g/t Ag, the 1.4-km stratabound copper-silver horizon has been extended 1,000m, to 2,400m. (2.4 km).

Max also reported a new discovery, AM-2, located 500 meters south of AM-1. The new zone extends for 1,000 meters, and is open along strike and dip. The fact that it is parallel to AM-2 strongly suggests stacked horizons.

Assays at AM-2 are pending.

The CESAR project and its potential to be a Kupfershiefer analogue has grabbed the attention of one of the most important research centers in the world for the study of these sedimentary-hosted stratiform copper deposits which are also large repositories of silver.

In the press release below, Max says it has sent surface rock samples extracted from CESAR’s stratabound copper-silver mineralization horizons to the University of Science and Technology’s Department of Economic Geology, located in Krakow, Poland. Researchers at the university, which has worked extensively with KGHM in Poland, will conduct mineralogical and geochemical studies on the samples; also, a Masters-level student is planning on writing a thesis paper on the results.

Vancouver B.C., April 21, 2020 – MAX RESOURCE CORP. (“Max” or the “Company”) (TSX.V: MXR; OTC: MXROF; Frankfurt: M1D2) is pleased to report the involvement of the University of Science and Technology (“AGH-UST”), Faculty of Geology, Geophysics and Environmental Protection, Department of Economic Geology (“AGH”), Krakow, Poland in a study of the sediment-hosted copper-silver mineralization of the CESAR project, located 420-km north of Bogota, in NE Colombia.

Max has dispatched surface rock samples extracted from the CESAR stratabound copper-silver mineralized horizons to AGH. From these samples, AGH will conduct various mineralogical and geochemical studies.

AGH Professors and teaching staff have a long history of cooperation with KGHM Polska Miedz (“KGHM”), the largest copper producer in Europe and the worlds largest silver producer. AGH will leverage their extensive knowledge of KGHM’s world renowned Kupferschiefer sediment-hosted copper-silver deposits in Poland, on the academic study of CESAR.

Max and AGH agreed that results from the study on CESAR may be used for public presentations and scientific papers. In addition, discussion have commenced with respect to an AGH M.Sc. student focusing their thesis on selected material sent from the CESAR project.

AGH-UST in Krakow, Poland has a distinguished history and a deep understanding of sediment-hosted copper-silver deposits, due to their extensive work with Kupferschiefer, established in Poland as a world-class producer of copper and silver since 1968, also producing, gold, palladium, platinum and rhenium as by-products.

“We anticipate the scientific team from the Department of Economic Geology will play a significant role in identifying the similarities with Kupferschiefer and unlocking the ultimate potential of CESAR,” Max CEO, Brett Matich, commented.

“Max’s CESAR project in Colombia provides for significant exposure to both copper and silver, and notably silver has increased from a low of $11.74 per ounce in March to a high of $16.06 in April,” Mr. Matich concluded.

Max cautions investors that mineralization at Kupferschiefer is not necessarily indicative of similar mineralization at CESAR.

Conclusion

Investment demand for silver looks solid, with no end in sight to the low-interest-rate/ loose monetary policy direction of central banks, combined with record-breaking stimulus packages being passed by governments, as the coronavirus crisis rages on.

Adding higher demand due to shrinking silver supply, lower grades, and less by-product credits from falling lead and zinc mine production, we see a floor forming under silver prices.

The 113:1 gold-silver ratio is very high by historical standards. This is a warning to investors that at any time, the ratio could correct, either meaning a move up in silver prices or a move down in gold prices. Trust me, gold is not going down anytime soon, meaning silver prices must eventually correct.

The coronavirus has lit a fire under gold prices, which have burned past $1,720 an ounce. Historically, silver rides the wave started by gold.

As long as governments are wrangling the coronavirus, we fully expect national debt piles to keep growing. Gold prices rise proportionally to debt.

Consider what a $10 trillion Fed balance sheet will do to the debt-to-GDP ratio. Consider what it will do for gold and silver!

Despite broad-based market volatility, now is an unbelievably good time to be investing in precious metals. Buying physical gold and silver won’t hurt you, but high prices do not make an attractive entry point and we don’t see a significant pullback happening anytime soon.

Historically, and especially so today, the greatest leverage to rising precious metals prices has been owning the shares of junior resource companies focused on acquiring, discovering and developing precious metals deposits.

Identifying who owns the most attractive silver, in the ground, that can be bought at historically low valuations would seem to me a very prudent investing strategy at the moment.

For the last several months I’ve been following Max Resource Corp. as it develops CESAR. Max’s goal is to bring in a major as a partner, that can help finance a drill program at CESAR and bring it to a resource, then, fingers crossed, complete the rest of the steps (PEA, prefeasibility study, feasibility study, permits, etc.) required to build a mine.

We are also encouraged to see interest expressed by AGH-UST university in Poland, where some of the people most familiar with Kupfershiefer-type deposits, other than KGHM, will study samples from Max’s CESAR to see if there is a correlation. That’s exciting.

Could Max be sitting on another Kupfershiefer? Time will, as always, tell. But by the time we get a definitive answer I would expect the share price to have already runaway.

Richard (Rick) Mills

subscribe to my free newsletter

aheadoftheherd.com

Source:https://aheadoftheherd.com/Newsletter/2020/The-Fed-cant-print-silver.htm

Secular Gold Bull Resumes with Force SPONSOR: American Creek $AMK.ca $TUD.ca $SII.ca $GTT.ca $AFF.ca $SEA.ca $SA $PVG.ca $AOT.ca $ESK.ca

Posted by AGORACOM at 9:54 AM on Tuesday, April 28th, 2020

SPONSOR: American Creek owns a 20% Carried Interest to Production at the Treaty Creek Project in the Golden Triangle. 2019’s first hole averaged 0.683 g/t Au over 780m in a vertical intercept. 2020 drilling plans 18,000 to 20,000 metres from 7-10 drill platforms with four diamond drill rigs. The Treaty Creek property is located in the same hydrothermal system as the Pretivm and Seabridge’s KSM deposits and is fully funded for exploration in 2020. Click Here For More Info

COVID-19: The Pin that Punctured the Credit Balloon

Gold is on the cusp of breaking out to all-time highs in U.S. dollars and has already done so in virtually every other currency. Gold mining stocks continue to lag the metal and, in our opinion, represent a compelling investment opportunity at this moment. The COVID-19 pandemic panic was merely the black swan that punctured a financial market asset bubble that took almost a decade to inflate.

Think of the pandemic as the pin that punctured the credit balloon. In a few months, the pandemic will ease (hopefully) with the formulation of a COVID-19 vaccine, widespread testing and other responses that will surely come from the healthcare industry. However, the fiscal and monetary policy damage committed by all governments to save the world has created a debt hangover that will linger for years. Economic growth will rebound but only to subpar levels once extreme health-related restrictions are lifted and “stimulus” kicks in.

The requisites for robust economic growth most likely to misfire are investment confidence and bank lending. Both have been severely compromised. Whether this landscape evolves into a long stretch of deflation or combusts into untamed inflation remains to be seen. What seems quite apparent is that traditional Keynesian stimulus measures are in their endgame. They will most likely deliver only steadily diminishing returns. Starkly opposite economic outcomes are possible from this policy morass; both would be positive for gold but negative for real returns on fixed income or equities.

Q1 Marks a Pivotal Turning Point for All Asset Classes

As of this writing, gold is trading about 10% less than its all-time high of US$1,900 attained nine years ago (September 2011). In effect, it has gone nowhere for a decade despite a tectonic shift in the investment and economic outlook. A lengthy correction lasting until 2016 and subsequent churning resulted in the establishment of a powerful multi-year basing structure. From this base and with strong macroeconomic tailwinds, we believe new highs well above $1,900 can be achieved over the next four years.

Despite enthusiastic advocacy and much chatter from investment luminaries, including Ray Dalio, Jeff Gundlach, Seth Klarman and others, gold remains severely and inappropriately underrepresented in the portfolios of fiduciaries, endowments and family offices. Flows into channels such as gold-backed exchange traded funds (“ETFs”) have been strong relative to previous low levels, but must still be considered a trickle in terms of what could still come. 

 Figure 1. Gold-Backed ETFs Reach Record Levels
Global gold-backed ETFs added 298 tonnes and net inflows of US$23 billion in Q1 2020 — the highest quarterly amount ever in absolute U.S. dollar terms and the largest tonnage additions since 2016.
Source: World Gold Council. Data as of 3/31/2020.

In our opinion, the first quarter of 2020 will mark a pivotal, secular turning point for all major asset classes including equities, bonds, gold and currencies. A return to the pre-2020 financial market normalcy and investment complacency is unlikely. In our view, consensus hopes remain high that the credit smash is only a temporary repercussion of the health scare. We disagree and suggest the effects will be long lasting.

Despite the solid price gains achieved by gold in the past two years, there is much more upside to come as investors gradually give up on repeated equity market bottom fishing and the hope of a return to financial market normalcy. A full reversal to the previous complacency cannot take place following a brief crash. The mood change will more likely become pervasive after grueling stretches of disappointing returns from previously successful investment strategies.

Unprecedented Central Bank Monetary Expansion

In our view, the decade preceding 2020 was characterized by the systematic stifling of price discovery for interest rates and the appropriate dependent valuations for financial assets. Such distortion was made possible only by unprecedented central bank balance sheet expansion that encouraged, abetted and rewarded risk taking in the form of ever greater leverage.

The prolonged somnolence of gold was among the most egregious price distortions of the previous decade and this suppressed interest in the metal as a risk mitigator and portfolio diversifier. Disinterest was fed in large part by the nearly universal expectation that the past would always be prologue and that highly leveraged financial and economic structures would perpetually result in outsized returns. In our view, the greatest change stemming from the credit bust will be a mood shift or paradigm change in the opposite direction.

At gold’s previous peak in 2011, the combined balance sheets of the U.S. Federal Reserve (“U.S. Fed”) and the European Central Bank (“ECB”) totaled approximately US$5.5 trillion. Today, that number is more than $11.4 trillion and rapidly moving higher. The USD gold price is still lower than nine years ago. In our view, gold price is still well below where it should be and will likely trade higher in the new macro landscape.

 Figure 2. Pandemic Policy Response Pushes Global Balance Sheets to Record Levels
Source: Bloomberg. Data as of 3/31/2020.

Gold Mining Stocks are Inexpensive

If gold is not correctly priced for what has transpired and what lies ahead, gold mining stocks are even more inappropriately priced. Based on current metal prices, most companies are generating positive earnings and cash flow and in many cases, free cash flow that can be applied to higher dividend payouts. Compared to other sectors of the economy, the gold mining industry stands almost alone in looking forward to strong 2020 earnings and a positive outlook for 2021.

2020 free cash flow yields for large-cap producers range from 3%-7% and 6%-25% for intermediate producers based on conventional sell-side research. The stats are similar or better for 2021 based on spot gold prices. As Figure 3. shows, mining stocks are inexpensive in absolute terms and have never been so cheap relative to the gold price. 

Figure 3. Gold Equities Are Undervalued Relative to Bullion
Ratio of XAU Index to Spot Gold (12/23/1983-3/31/2020)
Data as of 3/31/2020. Source: Bloomberg. 12/23/1983 represents the inception of the XAU.

Since 2008, the relative valuation of gold equities to gold bullion has fallen 75% from the prior 25-year average. The ratio of the XAU Index to spot gold averaged 0.2497x for a quarter century through 2008. As of 3/31/2020, the ratio was 0.0501x.

It is undoubtedly true that the industry will suffer health-related mine shutdowns and other shortfalls this year. Much of the disruption potential has already been broadcast and priced into the market. Some downside news may still have yet to surface. However, most miners are not financially levered and should be able to survive a few quarters of lower or no production. Unlike the airline, leisure, retail and manufacturing sectors, gold not produced today should grow in value and be produced at higher prices and lower costs next year and those beyond. It is not the same story for many other sectors of the economy. Based on fundamentals, gold stocks are inexpensive. By contrast, several other sectors of the economy could face long stretches of poor earnings, bad news flow and financial woes.

The gold mining sector registered a decline of approximately 20% in Q1 (as measured by GDX2) as shares did get battered by indiscriminate liquidations during March. However, as of this writing, two weeks after the close of the quarter, most shares trade near to where they stood at the beginning of the year, and have certainly registered outstanding performance in relative terms. It is remarkable that the largest sector ETF, GDX, suffered outflows of $381 million3 during the quarter at what could be the threshold of an upside breakout. In a favorable cycle for the gold price, mining stocks have historically delivered outperformance 3 to 5 times that of the metal itself.

Gold mining shares continue to be viewed by investors with deep skepticism as reflected by valuation and flows. When we scan Figure 4, it appears to us that the sector is on the verge of an upside breakout from a multi-year base should our assessment of the macroeconomic environment prove correct.

Figure 4. NYSE Arca Gold BUGS Index (HUI4)
Source: Bloomberg. Data as of 4/20/2020.

Monetary and Fiscal Policy Going Ballistic

There is no need to belabor the obvious. However, the consequences of these actions have yet to be priced into the financial markets or gold. The risk parity trade has fallen short, partly because bonds were caught up in the indiscriminate liquidations of Q1. Looking forward, bonds may no longer be able to play the safe haven role they traditionally filled to balance equity risk. The vacuum could be filled in part by increased gold exposure for all classes of investors. Sovereign credit liquidity injections are likely to remain significant and permanent. The bond market has become socialized. Owning Treasury bonds of any duration could become akin to parking Treasury bills, with little upside and considerable risk of impairment through inflation. Gold is the antidote to the fixed-income investor’s dilemma.

Gold is extremely under-owned, under-represented, and poorly thought of in the circles of conventional investment thinking. It is still considered to be a fringe asset. Just ask Goldman Sachs which recently advised its clients:

 “We concluded then (2010) that gold does not have a role as a strategic asset class in clients’ already well-diversified portfolios. We have updated the research and the evidence is even more compelling today than it was then.” (4/5/2020; Goldman Sachs Investment Strategy Group)

We remind the reader that Goldman is the same firm that in December 2019 declared the U.S. economy to be “recession proof” and then in March 2020 cautioned that stocks had substantial further downside:

“Overall, the changes underlying the Great Moderation appear intact, and we see the economy as structurally less recession prone today.” (12/31/2019; Goldman economists Jan Hatzius and David Mericle)

“Goldman Sachs on Friday dramatically cut its U.S. economic forecast, saying it now expects GDP to decline by 25% in the second quarter of 2020 because of the coronavirus panic.” (3/20/2020; Business Insider)

“What is your estimate for the S&P 500 by yearend 2020? David Kostin, “3400.” (1/2020; GS Podcast, David Kostin Goldman, U.S. chief equity strategist and Jake Siewert) 

“Kostin thinks the market goes lower. ‘In the near term, we expect the S&P 500 will fall towards a low of 2000.’” (3/22/2020; Yahoo Finance)

Goldman’s commentary is, in our opinion, a reasonable proxy for conventional wisdom. One could easily find other embarrassing examples of mainstream thinking ignorant of the best-performing asset class (by far) versus equities and bonds since 2000.

Contrarians and value investors, take note! The secular gold bull that began in 2000 and corrected for a few years has returned to life with renewed vigor. Pullbacks — price declines during this uptrend — should be bought. The setup for gold and gold mining shares ticks every box for highly rewarding investment returns.

Figure 5. Gold Has Outperformed Stocks, Bonds and USD over the Past 20 Years
Returns for Period from 12/31/1999-4/13/2020

Source: Bloomberg. Period from 12/31/1999-4/20/2020. Gold is measured by GOLDS Comdty; US Agg Bond Index is measured by the Bloomberg Barclays US Agg Total Return Value Unhedged USD (LBUSTRUU Index); S&P 500 TR is measured by the SPX; and the U.S. Dollar is measured by DXY Curncy. Past performance is no guarantee of future results.

Figure 6. Gold Provides Portfolio Diversification
Gold provides diversification in a portfolio, and has low correlation with other asset classes. The period measured is April 1, 2015 to April 1, 2020.

* Source: World Gold Council. Period from April 1, 2015 to April 1, 2020, based on monthly returns. Gold is measured by the LBMA Gold Price; stocks by the S&P 500 Index; commodities by the Bloomberg Commodity Index;  Bonds by the BarCap Treasuries and Corporates.

1The S&P 500 or Standard & Poor’s 500 Index is a market-capitalization-weighted index of the 500 largest U.S. publicly traded companies. You cannot invest directly in an index. TR, “Total Return”, represents the index with dividend income reinvested.
2VanEck Vectors Gold Miners ETF (GDX) seeks to replicate the NYSE Arca Gold Miners Index (GDMNTR), which is intended to track the overall performance of companies involved in the gold mining industry.
3Source: ETFtrends.com.
4The NYSE Arca Gold BUGS Index (HUI) is a modified equal dollar weighted index of companies involved in gold mining.

SOURCE: Sprotts Thoughts

https://sprott.com/insights/sprott-gold-report-secular-gold-bull-resumes-with-force/#

CLIENT FEATURE: Loncor Resources $LN.ca 3.6 Million High Grade Gold Ounces in the DRC $ABX.ca $TECK.ca $RSG $NGT.to $GOLD $NEM

Posted by AGORACOM at 12:45 PM on Monday, April 27th, 2020
http://blog.agoracom.com/wp-content/uploads/2019/11/Loncor-Small-Square.png

LN:TSX

3.6 Million High Grade Gold Ounces in the Congo

Imbo Concession: Loncor controls 76.29% of the Imbo Project.

3 Seperate Deposits:

  • Adumbi, Kitenge and Manzako comprise 2.5 million ounces of gold
  • 30.65 million tonnes grading 2.54 g/t Au
  • 76.29% of the gold resource is attributable to Loncor via its 76.29% interest in the Imbo Project.

2020 Exploration Strategy:

  • Increase the mineral resources on the Imbo Project by undertaking additional drilling
  • Initiate Preliminary Economic Assessment on the Adumbi deposit.  
    • Increase and upgrade mineral resources within the open pit
    • Develop underground potential, mineralization remains open at depth

Makapela Project, NGAYU Belt: (100% Loncor Owned)

  • Indicated mineral resource of 614,200 ounces of gold
    • (2.20 million tonnes grading 8.66 g/t Au)
  •  Inferred mineral resource of 549,600 ounces of gold
    • (3.22 million tonnes grading 5.30 g/t Au).

Barrick JV in the NGAYU Belt:

  • Ngayu Belt is 200km southwest of the Kibali gold mine, operated by Barrick Gold
    • Kibali produced 814,000 ounces at “all-in sustaining costs” of US$693/oz 2019 
    • Barrick highlighted the Ngayu Greenstone Belt an area of particular exploration interest
    • Barrick earns 65% of any exploration discovery in 1,894 km2 of Loncor ground in the JV.
  • Barrick manages and funds exploration until the completion of a pre-feasibility study on any gold discovery meeting the investment criteria of Barrick.

Barrick highlighted 6 signifcant drill targets and is moving toward drilling in 2020

Loncor Resources Inc.

Loncor a Canadian gold explorer controlling over 3.6 million high grade ounces outside of a Barrick JV in the DRC. The Ngayu JV property is 200km southwest of the Kibali gold mine, operated by Barrick, which produced 814,000 ounces of gold in 2019. Barrick manages and funds exploration at the Ngayu project until the completion of a pre-feasibility study on any gold discovery meeting their Tier One investment criteria. Newmont $NGT $NEM owns 7.8%, Resolute $RSG owns 27%, Loncor Management owns 29%

Loncor Hub on Agoracom