- Loncor recently received the quarterly exploration report from joint venture partner Barrick for the fourth quarter of 2019
- As announced in November 2019, joint venture partner and operator Barrick has identified a number of priority drill targets within the 1,894 square kilometre joint venture land package at Ngayu and that are planned to be drilled during the current dry season, commencing next month.
TORONTO, Feb. 18, 2020 — Loncor Resources Inc. (“Loncor” or the “Company“) (TSX: “LN”; OTCQB: “LONCF”) is pleased is pleased to provide an update on its activities within the Ngayu Greenstone Belt, where the Company has a dominant foot-print through its joint venture with Barrick Gold (Congo) SARL (“Barrickâ€) and on its own majority-owned exploration licences and exploitation concessions including the Imbo exploitation concession.
The Ngayu Archean Greenstone Belt of northeastern Democratic Republic of the Congo (the “DRCâ€) is geologically similar to the belts which host the world class gold mines of AngloGold Ashanti/Barrick’s Kibali mine in the DRC and AngloGold Ashanti’s Geita mine in Tanzania.
Barrick Joint Venture
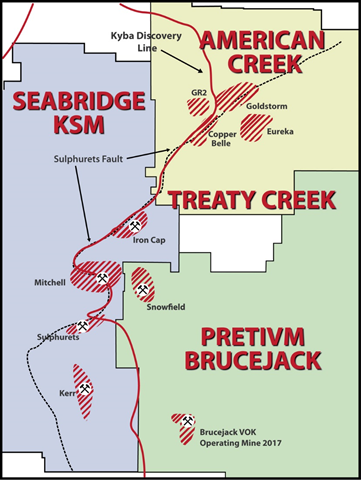
Loncor recently received the quarterly exploration report from joint venture partner Barrick for the fourth quarter of 2019. As announced in November 2019, joint venture partner and operator Barrick has identified a number of priority drill targets within the 1,894 square kilometre joint venture land package (the “JV Areasâ€) at Ngayu and that are planned to be drilled during the current dry season, commencing next month. Drill targets include Lybie, Salisa and Itali in the Imva area as well as Anguluku in the southwest of the Ngayu belt and Yambenda in the north (see Figure 1 below).
Four targets have been identified within the Lybie – Salisa block, which is approximately 6 kilometres in length, with Lybie (formerly known as Matete east) the priority. Lybie is characterized by a strongly brecciated cherty BIF (“Banded Ironstone Formationâ€) unit in the footwall of unmineralized magnetic BIF with a strong soil anomaly (generally >140ppb Au), along an east-northeast trending hill with dispersion downslope where artisanals mine the colluvium. The Salisa target is defined by 3 source lines of +80ppb Au over 2 kilometres in residual soils. It is associated with a northeast trending interpreted structure and anomalous lithosamples in the south. Work in Q4 2019 was focused on infill trenches towards the southwest (Salisa) of the trend to close the gap and test continuity of the 6 kilometre long anomalous soil trend, which has been confirmed by in-situ mineralization in wide spaced trenches to northeast of the trend. The completed phase one trenching programme at Lybie has outlined both narrow high grade and lower grade mineralised zones along a northeast-southwest trending, gold bearing shear zone over a strike length of 1.5 kilometres. The gold system is still open in all directions.
At Itali, trench extensions on the Medere trend defined three discrete zones hosted within sheared basalts. Overall results combining the three discrete zones indicate an average of 103.75 metres grading 0.71g/t Au in trench ITTR008 (including 12 metres grading 3.32g/t Au). The depth of the regolith with extensive cover has presented limiting factors with some trenches not reaching saprolite (oxidized bedrock). Part of the Itali target was previously identified and drilled by Loncor with the first core hole intersecting 38.82 metres (true width 37.97 metres) grading 2.66 g/t Au with the depth of oxidation exceeding 100 metres from surface (see Company press release dated January 26, 2012).
At Bakpau, initial surface work was completed and drill motivation was submitted for approval. Bakpau displays multiple contrasting lithologies, competencies (BIF, volcano-sedimentary package, granitoids, monzonite), alteration (sericite, chlorite, ankerite, silica, sulphides) and complex structural settings.
In January of this year, a LIDAR survey was completed on priority targets including Anguluku, Bakpau, Itali and Lybie-Salisa.
Imbo Exploitation Permit (Loncor 71.25%)
Outside of the Barrick joint venture, exploration activities have focussed on the Imbo exploitation concession in the east of the Ngayu belt where an Inferred Mineral Resource of 1.675 million ounces of gold (20.78 million tonnes grading 2.5 g/t Au, with 71.25% of this Inferred Mineral Resource being attributable to Loncor via its 71.25% interest) was outlined in January 2014 by independent consultants Roscoe Postle Associates Inc. on three separate deposits, Adumbi, Kitenge and Manzako. Further exploration activities have been undertaken on updating the Adumbi database as well as reconnaissance fieldwork on the Maiepunji prospect, 12 kilometres west-southwest of Adumbi where several artisanal workings occur over a strike length of 4 kilometres to the east of the Imbo river.
Based on previous studies by Barrick on regional, belt sized geochronological age dating and airborne VTEM, radiometric and magnetics of the Ngayu belt, it was found that a major structural, mineralised fracture zone separates an older volcano-sedimentary domain in the northern part of the belt from a younger, predominantly sedimentary basin in the south. At Barrick’s Kibali mine, a similar geological setting has been determined with the gold deposits spatially related to a major structural break between an older volcano-sedimentary domain and a younger predominantly sedimentary basin.
At Ngayu, the major structural fracture trends east-northeast through the Imva area where a number of targets are located and then trends southeast through the Imbo exploitation permit where the Adumbi, Kitenge and Manzako deposits are located and then across the Imbo river to the Maiepunji prospect. In total, this major structural break extends for 16 kilometres within the Imbo permit and will require further exploration to fully evaluate this prospective trend. Recent reconnaissance to the east of the Imbo river at the Maiepunji prospect has substantiated the potential of this structural trend with several artisanal workings being located over 4 kilometres of strike. Mineralization is found within steeply dipping metasediments with or without quartz veins with silica, sericite and graphitic alteration and mainly limonitic boxworks after pyrite. These metasediments are found immediately southwest of a prominent range of BIF. Assay results from 40 lithological grab samples recently taken are awaited. A detailed soil sampling, geological mapping and systematic channel sampling program is to be undertaken on the entire Maiepunji mineralized trend which will be aided by the recently completed LIDAR survey over the Imbo permit.
About Loncor Resources Inc.
Loncor
is a Canadian gold exploration company focused on two projects in the
DRC – the Ngayu and North Kivu projects. Both projects have historic
gold production. Exploration at the Ngayu project is currently being
undertaken by Loncor’s joint venture partner Barrick Gold Corporation
through its DRC subsidiary Barrick Gold (Congo) SARL (“Barrickâ€).
The Ngayu project is 200 kilometres southwest of the Kibali gold mine,
which is operated by Barrick and in 2019 produced 814,027 ounces of
gold. As per the joint venture agreement signed in January 2016, Barrick
manages and funds exploration at the Ngayu project until the completion
of a pre-feasibility study on any gold discovery meeting the investment
criteria of Barrick. Subject to the DRC’s free carried interest
requirements, Barrick would earn 65% of any discovery with Loncor
holding the balance of 35%. Loncor will be required, from that point
forward, to fund its pro-rata share in respect of the discovery in order
to maintain its 35% interest or be diluted.
Certain parcels of land within the Ngayu project surrounding and including the Makapela and Yindi prospects have been retained by Loncor and do not form part of the joint venture with Barrick. Barrick has certain pre-emptive rights over these two areas. Loncor’s Makapela prospect has an Indicated Mineral Resource of 614,200 ounces of gold (2.20 million tonnes grading 8.66 g/t Au) and an Inferred Mineral Resource of 549,600 ounces of gold (3.22 million tonnes grading 5.30 g/t Au). Loncor also recently acquired a 71.25% interest in the KGL-Somituri gold project in the Ngayu gold belt which has an Inferred Mineral Resource of 1.675 million ounces of gold (20.78 million tonnes grading 2.5 g/t Au), with 71.25% of this resource being attributable to Loncor via its 71.25% interest.
Resolute Mining Limited (ASX/LSE: “RSGâ€) owns 27% of the outstanding shares of Loncor and holds a pre-emptive right to maintain its pro rata equity ownership interest in Loncor following the completion by Loncor of any proposed equity offering. Newmont Goldcorp Corporation (NYSE: “NEMâ€; TSX: “NGTâ€) owns 7.8% of Loncor’s outstanding shares.
Additional information with respect to Loncor and its projects can be found on Loncor’s website at www.loncor.com.
Qualified Person
Peter N. Cowley, who is President of
Loncor and a “qualified person” as such term is defined in National
Instrument 43-101, has reviewed and approved the technical information
in this press release.
Technical Reports
Certain additional information with
respect to the Company’s Ngayu project is contained in the technical
report of Venmyn Rand (Pty) Ltd dated May 29, 2012 and entitled “Updated
National Instrument 43-101 Independent Technical Report on the Ngayu
Gold Project, Orientale Province, Democratic Republic of the Congo”. A
copy of the said report can be obtained from SEDAR at www.sedar.com and
EDGAR at www.sec.gov.
Certain additional information with respect to the Company’s recently acquired KGL-Somituri project is contained in the technical report of Roscoe Postle Associates Inc. dated February 28, 2014 and entitled “Technical Report on the Somituri Project Imbo Licence, Democratic Republic of the Congo”. A copy of the said report, which was prepared for, and filed on SEDAR by, Kilo Goldmines Ltd., can be obtained from SEDAR at www.sedar.com. To the best of the Company’s knowledge, information and belief, there is no new material scientific or technical information that would make the disclosure of the KGL-Somituri mineral resource set out in this press release inaccurate or misleading.
Cautionary Note to U.S. Investors
The
United States Securities and Exchange Commission (the “SEC”) permits
U.S. mining companies, in their filings with the SEC, to disclose only
those mineral deposits that a company can economically and legally
extract or produce. Certain terms are used by the Company, such as
“Indicated” and “Inferred” “Resources”, that the SEC guidelines strictly
prohibit U.S. registered companies from including in their filings with
the SEC. U.S. Investors are urged to consider closely the disclosure in
the Company’s Form 20-F annual report, File No. 001- 35124, which may
be secured from the Company, or from the SEC’s website at
http://www.sec.gov/edgar.shtml.
Cautionary Note Concerning Forward-Looking Information
This
press release contains forward-looking information. All statements,
other than statements of historical fact, that address activities,
events or developments that the Company believes, expects or anticipates
will or may occur in the future (including, without limitation,
statements regarding drill targets, exploration results, mineral
resource estimates, future drilling and other future exploration,
potential gold discoveries and future development) are forward-looking
information. This forward-looking information reflects the current
expectations or beliefs of the Company based on information currently
available to the Company. Forward-looking information is subject to a
number of risks and uncertainties that may cause the actual results of
the Company to differ materially from those discussed in the
forward-looking information, and even if such actual results are
realized or substantially realized, there can be no assurance that they
will have the expected consequences to, or effects on the Company.
Factors that could cause actual results or events to differ materially
from current expectations include, among other things, the possibility
that the planned drilling program by Barrick will be delayed,
uncertainties relating to the availability and costs of financing needed
in the future, risks related to the exploration stage of the Company’s
properties, the possibility that future exploration (including drilling)
or development results will not be consistent with the Company’s
expectations, failure to establish estimated mineral resources (the
Company’s mineral resource figures are estimates and no assurances can
be given that the indicated levels of gold will be produced), changes in
world gold markets or equity markets, political developments in the
DRC, gold recoveries being less than those indicated by the
metallurgical testwork carried out to date (there can be no assurance
that gold recoveries in small scale laboratory tests will be duplicated
in large tests under on-site conditions or during production),
fluctuations in currency exchange rates, inflation, changes to
regulations affecting the Company’s activities, delays in obtaining or
failure to obtain required project approvals, the uncertainties involved
in interpreting drilling results and other geological data and the
other risks disclosed under the heading “Risk Factors” and elsewhere in
the Company’s annual report on Form 20-F dated April 1, 2019 filed on
SEDAR at www.sedar.com and EDGAR at www.sec.gov. Forward-looking
information speaks only as of the date on which it is provided and,
except as may be required by applicable securities laws, the Company
disclaims any intent or obligation to update any forward-looking
information, whether as a result of new information, future events or
results or otherwise. Although the Company believes that the
assumptions inherent in the forward-looking information are reasonable,
forward-looking information is not a guarantee of future performance and
accordingly undue reliance should not be put on such information due to
the inherent uncertainty therein.
For further information, please visit our website at www.loncor.com, or contact: Arnold Kondrat, CEO, Toronto, Ontario, Tel: + 1 (416) 366 7300.
Figure 1 Ngayu Infrastructure & Motivated Drill Targets for 2020