Posted by AGORACOM
at 9:18 AM on Thursday, February 7th, 2019
The 2018 Exploration program Returned Results Including:
The most significant gold drill intersections (core length) from the phase 3 diamond drilling on the COD vein are as follows:
COD18-3: 14.62 g/t Au over 2.1 metres;
COD18-26: 10.30 g/t Au over 1.4 metres recovered core (within 2.35-metre interval);
COD18-28: 11.30 g/t Au over 0.51 metre;
COD18-33: 8.65 g/t Au over 2.98 metres;
COD18-34: 6.16 g/t Au over 3.41 metres;
COD18-37: 8.23 g/t Au over 3.95 metres;
COD18-45: 50.10 g/t Au over 2.05 metres;
COD18-46: 54.90 g/t Au over 1.47 metres;
COD18-49: 9.52 g/t Au over 1.47 metres;
COD18-54: 7.60 g/t Au over 1.66 metres.
The 2018 drilling program also tested the continuation of the Everest vein, which is located southwest of the COD vein work site. Chip samples collected in 2017 across the approximate 0.4-metre-wide vein exposure returned up to 52.8 g/t gold and 377 g/t silver, while a grab sample of a quartz vein boulder broken off the outcrop by the excavator returned 81.8 g/t gold and 630 g/t silver (news release of Aug. 21, 2017).
The Everest vein 2018 drill holes are located approximately 350 to 800 metres south of the area of 2017 and 2018 COD vein drill holes. High gold intersections (core length) from the phase 3 drill program at the Everest vein include (news release of July 19, 2018, and Sept. 13, 2018):
Posted by AGORACOM
at 8:26 AM on Tuesday, February 5th, 2019
Includes 2.86g/t gold in soils
In addition, over 1,000 soil samples with gold concentrations greater than the 90th percentile are considered anomalous and require detailed follow up.
LAB controls 57 km strike length of stratigraphy prospective for gold in the Florence Lake Greenstone Belt.
Detailed soil grids were placed over anomalous gold-in-soil targets with favorable geology and structure to develop specific targets for follow up leading to drilling
VANCOUVER,
British Columbia, Feb. 05, 2019 (GLOBE NEWSWIRE) — Labrador Gold
Corp. (TSX-V: LAB) (“Labrador Gold†or the “Companyâ€) is pleased to
announce results from detailed gold exploration of its Hopedale project
in Labrador. The company controls a 57 kilometre strike length of
stratigraphy prospective for gold in the Florence Lake Greenstone Belt.
The exploration program at Hopedale followed up on successful results of
2017 work that outlined regional scale gold in soil and lake sediment
anomalies along the length of the belt and included detailed soil
sampling, geological mapping, rock sampling and prospecting.
Detailed
soil grids were placed over anomalous gold-in-soil targets with
favorable geology and structure to develop specific targets for follow
up leading to drilling. A total of 10,594 soil samples were taken on 12
grids at a 100m line spacing and 25m sample spacing along the length of
the belt. Assays of the samples returned gold values from below
detection (<5ppb) to 2,860 ppb. Thirty-four samples returned values
greater than 100ppb Au, with five of these samples grading greater than
1,000 ppb Au (1g/t). In addition, over 1,000 soil samples with gold
concentrations greater than the 90th percentile are
considered anomalous and require detailed follow up. Arsenic values
range from less than detection to the upper limit of 10,000 ppm with 90
samples assaying greater than 1,000 ppm. Antimony values ranged between
0.05 and 171.5 ppm with eight samples assaying greater than 100 ppm.
Elevated
gold values were found in samples from all 12 grids although the
highest concentrations of samples with anomalous gold are found in the
Thurber Dog, Jasmine and Misery grids (See news release dated November
2, for initial results from the Misery and Jasmine grids). Anomalous
gold is typically found along the contacts (often sheared) between
ultramafic rocks and adjacent mafic, meta-sedimentary or felsic
meta-volcanic rocks. In addition, elevated gold concentrations may be
associated with specific structures such as a jog in stratigraphy in the
northern Thurber Dog grid, a fold nose in the south of the Jasmine grid
and an interpreted shear zone running through the Misery grid. These
structures are commonly associated with sites of gold mineralization in
greenstone belts elsewhere in the world.
Arsenic
concentrations are highest along a 4km north-south trend in the Jasmine
Grid where massive arsenopyrite was found. Antimony appears to be
elevated along interpreted structure, often forming elongate anomalies
parallel to such structures as seen on the Misery and Schist Lake grids.
“The
latest results of detailed soil sampling at Hopedale continues to turn
up gold values above 0.1g/t possibly related to near surface gold
mineralization, said Roger Moss, President and Chief Executive Officer
of Labrador Gold. “Our growing understanding of the geology and
structure of the greenstone belt will allow us to focus on the most
prospective areas during the coming field season which should be an
exciting one for Labrador Gold.â€
“With all the
soils from last season now in, we can clearly see nicely defined linear
gold trends, some over a kilometer in length, to follow up next field
season,†said Shawn Ryan, Technical Adviser to Labrador Gold. “We are
now compiling all the data gathered from the past 2 field seasons which
includes over 11,000 soils, 400 + rocks, geological and structural
mapping. This will be interpreted using the recent Geological Survey of
Canada airborne magnetic survey flown last year, along with the
historical magnetic surveys in the area. A detailed target
Interpretation map will be completed in the next three weeks which will
help rank anomalies for our Phase Three Summer 2019 follow up program.â€
The
company also announces that its major shareholder, Plethora Precious
Metals Fund (‘Plethoraâ€) has exercised 3,125,000 warrants. Plethora now
holds 9,750,000 shares of the company representing 17.45% of the issued
and outstanding shares. We appreciate the continued support of Plethora
and their confidence in the exploration strategy of our technical team.
Plethora’s principal, Douwe Van Hees, is not a related party of the
Company.
All samples were dried in the field
before being shipped to the Bureau Veritas preparation laboratory in
Timmins, Ontario, with analyses completed at the Vancouver laboratory.
Samples were analyzed for gold and another 36 elements by ICP-MS
(inductively coupled plasma-mass spectrometry) following an aqua regia
digestion. The company routinely submits blanks, field duplicates and
certified reference standards with batches of samples to monitor the
quality of the analyses.
Roger Moss, PhD., P.Geo., is the qualified person responsible for all technical information in this release.
The
company gratefully acknowledges the Newfoundland and Labrador Ministry
of Natural Resources’ Junior Exploration Assistance (JEA) Program for
its financial support for exploration of the Hopedale property.
About Labrador Gold:
Labrador
Gold is a Canadian based mineral exploration company focused on the
acquisition and exploration of prospective gold projects in the
Americas. In 2017 Labrador Gold signed a Letter of Intent under which
the Company has the option to acquire 100% of the 896 square kilometre
(km2) Ashuanipi property in northwest Labrador and the Hopedale (458 km2) property in eastern Labrador.
The
Hopedale property covers much of the Hunt River and Florence Lake
greenstone belts that stretch over 80 km. The belts are typical of
greenstone belts around the world but have been underexplored by
comparison. Initial work by Labrador Gold during 2017 show gold
anomalies in soils and lake sediments over a 3 kilometre section of the
northern portion of the Florence Lake greenstone belt in the vicinity of
the known Thurber Dog gold showing where grab samples assayed up to
7.8g/t gold. In addition, anomalous gold in soil and lake sediment
samples occur over approximately 40 kilometres along the southern
section of the greenstone belt (see news release dated January 25th 2018 for more details). Labrador Gold now controls approximately 57km strike length of the Florence Lake Greenstone Belt.
The
Ashuanipi gold project is located just 35 km from the historical iron
ore mining community of Schefferville, which is linked by rail to the
port of Sept Iles, Quebec in the south. The claim blocks cover large
lake sediment gold anomalies that, with the exception of local
prospecting, have not seen a systematic modern day exploration program.
Results of the 2017 reconnaissance exploration program following up the
lake sediment anomalies show gold anomalies in soils and lake sediments
over a 15 kilometre long by 2 to 6 kilometre wide north-south trend and
over a 14 kilometre long by 2 to 4 kilometre wide east-west trend. The
anomalies appear to be broadly associated with magnetic highs and do not
show any correlation with specific rock types on a regional scale (see
news release dated January 18th 2018). This suggests a
possible structural control on the localization of the gold anomalies.
Historical work 30 km north on the Quebec side led to gold intersections
of up to 2.23 grams per tonne (g/t) Au over 19.55 metres (not true
width) (Source: IOS Services Geoscientifiques, 2012, Exploration and
geological reconnaissance work in the Goodwood River Area, Sheffor
Project, Summer Field Season 2011). Gold in both areas appears to be
associated with similar rock types.
The Company has 56,264,022 common shares issued and outstanding and trades on the TSX Venture Exchange under the symbol LAB.
“The 2018 diamond drilling program on the Croinor Gold property was a
major success, as it enabled us to increase the size and gold content
of the planned stopes, confirm and expand the two underground bulk
sampling areas, extend the deposit to the east and west and at depth and
establish that the deposit is still open in all directions,” said Jean-Marc Lacoste,
President and Chief Executive Officer of Monarch. “The next phase will
focus on upgrading the deposit through infill drilling and drilling pure
exploration holes to test high-potential targets on our 151-km2
property.”
The initial 20,000-metre program started in March 2018
and focused on expanding and upgrading the Croinor Gold deposit. The
program was completed in early September, with a total of 19,935 metres
of core drilled in 89 holes. Given the positive results from that
drilling program, the Corporation decided to drill another 8,300 metres,
and managed to complete 6,645 metres in 18 holes before the winter
freeze (see longitudinal).
All the assays for the original program and the additional 6,645 metres
of drilling have been received (see table below and press releases
dated July 10, 2018, September 5, 2018, October 4, 2018 and January 15, 2019, for a compilation of the 2018 drill results).
Hole CR-18-685 returned 17.26 g/t Au over 1.95 metres, including
50.10 g/t Au over 0.6 metre, 315 metres below surface. This hole was
drilled 30 metres west of hole CR-18-676, and is 30 metres down dip from
hole CR-11-407 and 45 metres up dip and to the east of hole CR-15-441.
The two nearby historical holes combined with these two new holes will
create a new stope in the western part of the deposit, extending the
mineralization westward while keeping the deposit open to the west. The
closest stope to these holes is 125 metres to the east.
Hole CR-18-676 returned 10.33 g/t Au over 1.75 metres, including
25.40 g/t Au over 0.65 metres. It was drilled to follow up on hole
CR-18-583, drilled during the initial drilling program 20 metres west of
hole CR-18-676 and 30 metres east of hole CR-18-685. CR-18-676 was
drilled down dip, parallel to the host diorite, and intersected multiple
mineralized zones within the diorite, as shown in the table below.
Hole CR-18-678 returned 40.50 g/t Au over 1.00 metre. It is located
20 metres west from a planned stope, 250 metres below surface and 25
metres west of hole CR-18-672, another hole added based on the positive
results from the initial program.
Finally, hole CR-18-683 returned 23.61 g/t Au over 1.60 metres,
including 43.70 g/t Au over 0.65 metres. It is located 8 metres west of a
planned stope, thereby increasing the stope’s size and gold content.
Results from the additional 6,645 metres of drilling on Croinor Gold
Hole
Length
From
To
Width*
Grade
Area
Number
(m)
(m)
(m)
(m)
(g/t Au)
Targeted
CR-18-672
340
239.3
240.0
0.7
5.17
Deposit
251.4
252.0
0.6
9.37
261.6
263.6
2.0
11.24
Including
261.6
262.6
1.0
22.00
CR-18-673
424
264.7
266.7
2.0
10.46
Deposit
Including
264.7
265.7
1.0
19.25
273.0
273.7
0.7
9.67
305.8
306.3
0.5
9.31
CR-18-674
319
298.5
299.6
1.1
1.72
Deposit
CR-18-675
319
260.6
261.6
1.0
10.15
Deposit
CR-18-676**
751
27.4
30.25
2.85
2.20
Deposit
55.75
58.5
2.75
7.46
Including
55.75
56.3
0.55
10.75
Including
58.0
58.5
0.5
12.30
62.5
64.1
1.6
6.01
Including
63.6
64.1
0.5
11.15
76.3
76.8
0.5
5.78
84.7
85.3
0.6
22.20
255.6
256.1
0.5
8.47
274.95
278.9
1.8
6.12
Including
274.95
275.55
0.6
11.85
286.6
288.2
1.6
3.80
298.0
298.5
0.5
5.82
300.75
301.35
0.6
11.25
368.1
369.85
1.75
10.33
Including
368.6
369.25
0.65
25.40
374.15
377.0
2.85
7.64
Including
376.0
376.5
0.5
16.25
378.2
379.4
1.2
4.38
CR-18-678
325
265.5
268.4
2.9
15.07
Deposit
Including
266.4
267.4
1.0
40.50
CR-18-679
400
252.2
254.8
2.6
3.17
Deposit
CR-18-680
280
181.5
182.6
1.1
2.36
Deposit
CR-18-681
352
214.2
216.2
2.0
6.26
Deposit
Including
215.2
216.2
1.0
10.55
255.8
256.3
0.5
5.29
CR-18-683
301
216.15
217.85
1.6
23.61
Deposit
Including
216.15
216.8
0.65
43.70
Including
217.35
217.85
0.5
18.70
233.15
234.2
1.05
9.43
Including
233.65
234.2
0.55
14.00
CR-18-684
502
374.1
375.15
1.05
1.21
Deposit
CR-18-685
352
257.0
258.95
1.95
17.26
Deposit
Including
258.35
258.95
0.6
50.10
CR-18-686
460
360.0
361.0
1.0
2.07
Deposit
CR-18-687
400
318.6
320.6
2.0
1.98
Deposit
CR-18-690
352
298.7
299.2
0.5
0.08
Exploration
CR-18-691
262
No significant values
Exploration
CR-18-693
250
94.4
94.9
0.5
0.37
Exploration
CR-18-694
256
70.9
71.5
0.6
0.61
Exploration
*The width shown is the core length. True width is estimated to be 90-95% of the core length.
**Hole CR-18-676 was drilled down dip, parallel to the diorite,
to test for the presence of multiple directions of quartz veining. The
width shown is the core length. True width is estimated to be 30-35% of
the core length.
The Croinor Gold deposit is hosted in a sheared diorite sill three
kilometres long by 60-120 metres wide, striking 295 degrees north and
dipping 50-65 degrees to the north. The mineralization is associated
with pyrite found within and adjacent to quartz-tourmaline veins.
Sampling normally consists of sawing the core into equal halves along
its main axis and shipping one of the halves to the ALS Minerals
laboratory in Val-d’Or, Quebec for assaying. The samples
are crushed, pulverized and assayed by fire assay, with atomic
absorption finish. Results exceeding 3.0 g/t Au are re-assayed using the
gravity method, and samples containing visible gold grains are assayed
using the metallic sieve method. Monarch uses a comprehensive QA/QC
protocol, including the insertion of standards, blanks and duplicates.
The technical and scientific content of this press release has been reviewed and approved by Ronald G. Leber, P.Geo., the Corporation’s qualified person under National Instrument 43-101.
ABOUT MONARCH GOLD CORPORATION
Monarch Gold Corporation (TSX: MQR) is an emerging gold mining
company focused on pursuing growth through its large portfolio of
high-quality projects in the Abitibi mining camp in Quebec, Canada. The Corporation currently owns close to 300 km² of gold properties (see map),
including the Wasamac deposit (measured and indicated resource of 2.6
million ounces of gold), the Beaufor Mine, the Croinor Gold (see video), McKenzie Break and Swanson
advanced projects and the Camflo and Beacon mills, as well as other
promising exploration projects. It also offers custom milling services
out of its 1,600 tonne-per-day Camflo mill.
Forward-Looking Statements The forward-looking
statements in this press release involve known and unknown risks,
uncertainties and other factors that may cause Monarch’s actual results,
performance and achievements to be materially different from the
results, performance or achievements expressed or implied therein.
Neither TSX nor its Regulation Services Provider (as that term is
defined in the policies of the TSX accepts responsibility for the
adequacy or accuracy of this press release.
Jean-Marc Lacoste, President and Chief Executive Officer, 1-888-994-4465, [email protected], www.monarquesgold.com; Elisabeth Tremblay, Senior Geologist – Communications Specialist, 1-888-994-4465, [email protected], www.monarquesgold.comCopyright CNW Group 2019
Tags: gold, gold exploration, tsx Posted in All Recent Posts, Monarques Gold | Comments Off on Monarch Gold $MQR.ca Intersects 17.26 g/t Au Over 1.95 Metres, Including 50.10 g/t Au Over 0.6 Metres, at its Croinor Gold Project $GDX.ca $ECR.ca $MZZ.ca $QMX.ca $IAG $MUX
Posted by AGORACOM-JC
at 9:54 AM on Friday, February 1st, 2019
Advises shareholders that it has received confirmation from the TSX Venture Exchange that effective at the opening on Monday, February 4, 2019,
the common shares of Beauce Gold Fields Inc. will commence trading on TSX Venture Exchange under the symbol BGF.
MONTREAL, Feb. 01, 2019 — HPQ Silicon Resources Inc. (HPQ) (TSX VENTURE:HPQ)(FRANKFURT:UGE)(OTC PINK:URAGF) is pleased to advise shareholders that it has received confirmation from the TSX Venture Exchange that effective at the opening on Monday, February 4, 2019, the common shares of Beauce Gold Fields Inc. (the “Company†or “BGFâ€) will commence trading on TSX Venture Exchange (the “Exchangeâ€) under the symbol BGF.
BGF was incorporated under the Canada Business Corporation Act on
August 1, 2016, primarily for the purpose of carrying out a spinout by
way of a plan of arrangement (the “Arrangementâ€) with HPQ Silicon
Resources Inc. (TSXV: HPQ) (“HPQâ€), of which the certificate of
arrangement was issued on November 23, 2018.
Pursuant to the Arrangement, HPQ completed the disposition of its
gold assets (the “Transferred Assetsâ€) to BGFI in consideration of the
issuance of an aggregate of 13,350,000 BGFI common shares (the “BGFI
Sharesâ€), of which 10,680,000 BGFI Shares were distributed to the
shareholders of HPQ. HPQ distribution notice was accepted pursuant to
the Exchange bulletin dated December 18, 2018.
On the day of listing, HPQ will own 2,870,133 shares of BGF, or 15.3% of the outstanding float of BGF.
Mr. Bernard Tourillon, President and CEO of HPQ Silicon Resources Inc stated, “The listing of Beauce Gold Fields on the TSX Venture Exchange is the final step in HPQ plan of arrangement spin out, and we are now happy to have completed this milestone that provided
HPQ shareholders shares in BGF, a Company created to showcase the
Beauce Gold project, a fantastic but overlooked historical placer gold
district. The Beauce is Canada’s last underexplored historical placer
mining camp. It’s similar to the White Gold projects in the Yukon or the
Cariboo district in B.C., that were both placer gold mining camps as
well, but recently had major gold discoveries as placer to hard rock
exploration projects.â€
For further information, please refer to the news releases of
HPQ-Silicon dated March 11, 2016, May 4, 2016, Sept. 7, 2016, Sept. 16,
2016, March 31, 2017, Feb. 8, 2018, June 13, 2018, Aug. 17, 2018, Oct.
4, 2018, Oct. 11, 2018, Dec. 12, 2018, Dec. 17, 2018, and Dec. 18, 2018.
This News Release is available on the company’s CEO Verified Discussion Forum, a moderated social media platform that enables civilized discussion and Q&A between Management and Shareholders.
About HPQ Silicon
HPQ Silicon Resources Inc. is a TSX-V listed resource company focuses on becoming a vertically integrated and diversified High Purity, Solar Grade Silicon Metal (SoG Si) producer and a manufacturer of multi and monocrystalline solar cells of the P and N types, required for production of high performance photovoltaic conversion.
HPQ’s goal is to develop, in collaboration with industry leaders,
PyroGenesis (TSX-V: PYR) and Apollon Solar, that are experts in their
fields of interest, the innovative PUREVAPTM “Quartz Reduction Reactors
(QRR)â€, a truly 2.0 Carbothermic process (patent pending), which will
permit the transformation and purification of quartz (SiO2) into high
purity silicon metal (Si) in one step and reduce by a factor of at least
two-thirds (2/3) the costs associated with the transformation of quartz
(SiO2) into SoG Si. The pilot plant equipment that will validate the
commercial potential of the process is on schedule to start mid-2019.
Disclaimers:
This press release contains certain forward-looking statements,
including, without limitation, statements containing the words “may”,
“plan”, “will”, “estimate”, “continue”, “anticipate”, “intend”,
“expect”, “in the process” and other similar expressions which
constitute “forward-looking information” within the meaning of
applicable securities laws. Forward-looking statements reflect the
Company’s current expectation and assumptions, and are subject to a
number of risks and uncertainties that could cause actual results to
differ materially from those anticipated. These forward-looking
statements involve risks and uncertainties including, but not limited
to, our expectations regarding the acceptance of our products by the
market, our strategy to develop new products and enhance the
capabilities of existing products, our strategy with respect to research
and development, the impact of competitive products and pricing, new
product development, and uncertainties related to the regulatory
approval process. Such statements reflect the current views of the
Company with respect to future events and are subject to certain risks
and uncertainties and other risks detailed from time-to-time in the
Company’s on-going filings with the securities regulatory authorities,
which filings can be found at www.sedar.com. Actual results, events, and
performance may differ materially. Readers are cautioned not to place
undue reliance on these forward-looking statements. The Company
undertakes no obligation to publicly update or revise any
forward-looking statements either as a result of new information, future
events or otherwise, except as required by applicable securities laws.
Neither the TSX Venture Exchange nor its Regulation Services
Provider (as that term is defined in the policies of the TSX Venture
Exchange) accepts responsibility for the adequacy or accuracy of this
release.
For further information, contact
Bernard J. Tourillon, Chairman and CEO Tel (514) 907-1011 Patrick Levasseur, President and COO Tel: (514) 262-9239 www.HPQSilicon.com
Shares outstanding: 222,284,053
Tags: Beauce, gold, Gold mining, stocks Posted in HPQ-Silicon Resources Inc. | Comments Off on $HPQ.ca Completes Beauce Gold Fields $BGF.c Plan of Arrangement Spin Out; BGF Shares to Start Trading on the TSX Venture Exchange on February 4, 2019
Posted by AGORACOM
at 9:17 AM on Friday, February 1st, 2019
JV partner Tudor Gold announced the designation of a new gold zone at Treaty Creek which has been named “Goldstorm”
The mineralization encountered to the northeast of Copper Belle has different characteristics, configuration and geometry.
“Goldstorm is a much larger system than Copper Belle at 300m wide and extends vertically for over 700m
Gold appears to be continuing towards the northeast and southeast and clearly becomes stronger in the northernmost hole, CB18-39 which returned 563.8 meters of 0.981 grams per tonne gold
Cardston, Alberta–(Newsfile Corp. – February 1, 2019) – American Creek Resources Ltd.
(TSXV: AMK) (“the Corporation”) today reports that JV partner Tudor
Gold announced the designation of a new gold zone at Treaty Creek which
has been named “Goldstorm”. It was previously thought that gold
mineralization identified by drilling northeast of the Copper Belle Zone
was simply a northeast extension of that same zone, but after
evaluating drill hole data from holes completed in 2016, 2017 and 2018,
it appears that the mineralization encountered to the northeast of
Copper Belle has different characteristics, configuration and geometry.
While it is unclear whether the zones are genetically linked, these
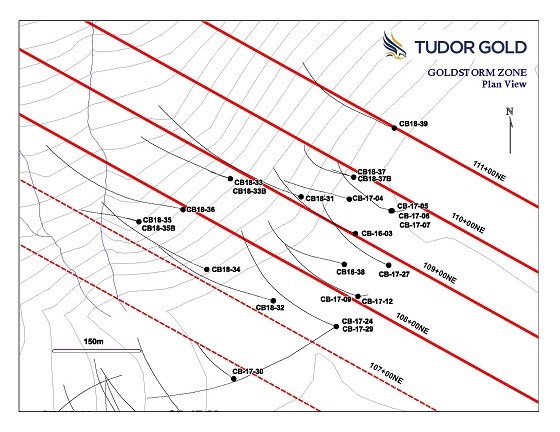
zones are physically separate. The surface drill hole location map at
the end of this news release shows the location of both gold zones.
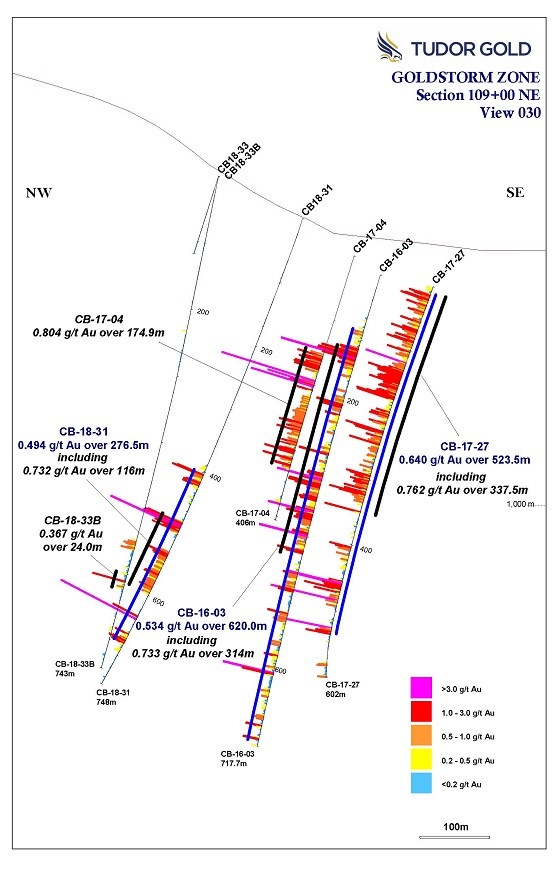
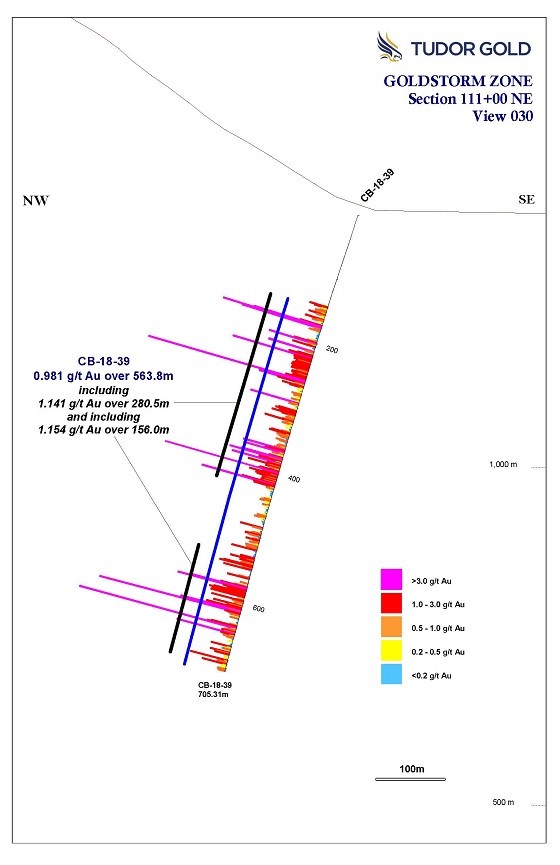
Tudor
Gold Exploration Manager, Ken Konkin explains: “Goldstorm is a much
larger system than Copper Belle, it is at least 300m wide and extends
vertically for over 700m. The zone has been traced for approximately 500
meters along a northeastern azimuth. Gold mineralization appears to be
continuing towards the northeast and southeast and clearly becomes
stronger in the northernmost hole, CB18-39 which returned 563.8 meters
of 0.981 grams per tonne gold. The upper portion of CB18-39 averaged
1.141 gpt gold over 280.5 meters and a lower zone in the same hole
averaged 1.154 grams per tonne gold over 156 meters. This hole bottomed
in mineralization and we will look at the option of re-entering the hole
this year in attempts to extend the mineralization deeper. But the
primary focus will be to extend the Goldstorm Zone along strike to the
northeast and to the southeast as well.
Over the coming months,
we hope to gain a better understanding of aspects that control gold
mineralization. Re-examination of drill hole information has revealed
the presence of a northwest dipping thrust fault that appears to define
the upper contact of the Goldstorm system. The relationship of this
fault to the formation of the mineral zone is an aspect of further
study, as are the various styles of sulphide mineralization,
silicification and alteration. Compilation and evaluation of this data
will help in planning for the drilling campaign to be undertaken in the
up-coming exploration season.”
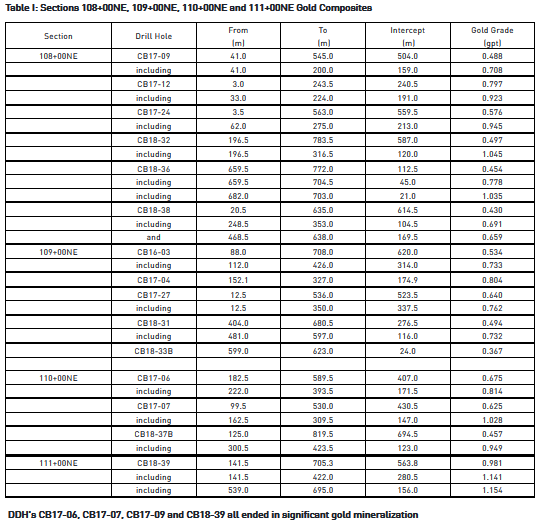
The following table gives gold
composite values over broad intervals from four drill hole sections that
cut the Goldstorm Zone, incorporating results from diamond drill holes
completed during 2016, 2017 and 2018. Low-grade gold mineralization
occurs as a broad envelope which contains a horizon of stronger gold
mineralization in the upper portion of the system. Furthermore, the
drill hole sections demonstrate what appears to be the presence of a
second, lower gold horizon. The corresponding sections 108+00 NE, 109+00
NE, 110+00 NE and 111+00 NE are displayed at the end of this news
release.
Table I: Sections 108+00NE, 109+00NE, 110+00NE and 111+00NE Gold Composites
* All assay values are uncut and intervals reflect drilled intercept lengths. * True widths of the mineralization have not been determined.
QA/QC
In
2016 and 2017, drill core samples were prepared and analyzed at
Activation Laboratories Ltd. in Kamloops, BC. In 2018, drill core
samples were prepared ALS Global’s Preparation Laboratory in Terrace, BC
and assayed at ALS Global’s Geochemical Laboratory in North Vancouver,
BC. Analytical accuracy and precision are monitored by the submission of
blanks, certified standards and duplicate samples inserted at regular
intervals into the sample stream by Tudor Gold personnel. Activation
Laboratories and ALS Global Laboratories quality systems comply with the
requirements for the International Standards ISO 17025: 2005.
QP
The
Qualified Person for this new release for the purposes of National
Instrument 43-101 is the Company’s Exploration Manager, Ken Konkin,
P.Geo. He has read and approved the scientific and technical information
that forms the basis for the disclosure contained in this news release.
Treaty Creek Joint Venture
The
Treaty Creek Project is a joint venture between Tudor Gold, Teuton
Resources Corp., and American Creek. Tudor is the operator and holds a
60% interest with both American Creek and Teuton each holding respective
20% carried interests in the property (fully carried until a production
notice is given).
For more information about Treaty Creek click here.
About American Creek
American
Creek is a mineral exploration company with a strong portfolio of gold
and silver properties in British Columbia. Three of those properties are
located in the prolific “Golden Triangle”; the Treaty Creek and
Electrum joint venture projects with Tudor Gold/Walter Storm as well as
the 100% owned past producing Dunwell Mine.
The Corporation recently completed a preliminary exploration program, including 2,000 meters of drilling, on its 100% owned Gold Hill project located in the Wild Horse River watershed of SE British Columbia. Assay results are pending.
The
Corporation also holds the Austruck-Bonanza, Ample Goldmax, Silver
Side, and Glitter King properties located in other prospective areas of
the province.
For further information please contact Kelvin Burton at: Phone: 403 752-4040 or Email: [email protected]. Information relating to the Corporation is available on its website at www.americancreek.com
Neither
the TSX Venture Exchange nor its Regulation Services Provider (as that
term is defined in the policies of the TSX Venture Exchange) accepts
responsibility for the adequacy or accuracy of this release.
Cautionary Statements regarding Forward-Looking Information
Certain
statements contained in this press release constitute forward-looking
information. These statements relate to future events or future
performance. The use of any of the words “could”, “intend”, “expect”,
“believe”, “will”, “projected”, “estimated” and similar expressions and
statements relating to matters that are not historical facts are
intended to identify forward-looking information and are based on the
Corporation’s current belief or assumptions as to the outcome and timing
of such future events. Actual future results may differ materially.
All
statements including, without limitation, statements relating to the
Goldstorm Zone as well as any other future plans, objectives or
expectations of the Corporation are forward-looking statements that
involve various risks and uncertainties. There can be no assurance that
such statements will prove to be accurate and actual results and future
events could differ materially from those anticipated in such
statements. Important factors that could cause actual results to differ
materially from the Corporation’s plans or expectations include risks
relating to the actual results of current exploration activities,
fluctuating gold prices, possibility of equipment breakdowns and delays,
exploration cost overruns, availability of capital and financing,
general economic, market or business conditions, regulatory changes,
timeliness of government or regulatory approvals and other risks
detailed herein and from time to time in the filings made by the
Corporation with securities regulators. The Corporation expressly
disclaims any intention or obligation to update or revise any
forward-looking statements whether as a result of new information,
future events or otherwise except as otherwise required by applicable
securities legislation.
Tags: #CopperBelle, #Discovery, #Tudor, gold, Seabridge Posted in American Creek Resources Ltd. | Comments Off on American Creek Reports That JV Partner Tudor Gold Confirmed the Presence of a Substantial New Gold Zone at the Treaty Creek Project, Golden Triangle $AMK.ca $TUE.ca $SEA.ca
Posted by AGORACOM
at 12:43 PM on Thursday, January 24th, 2019
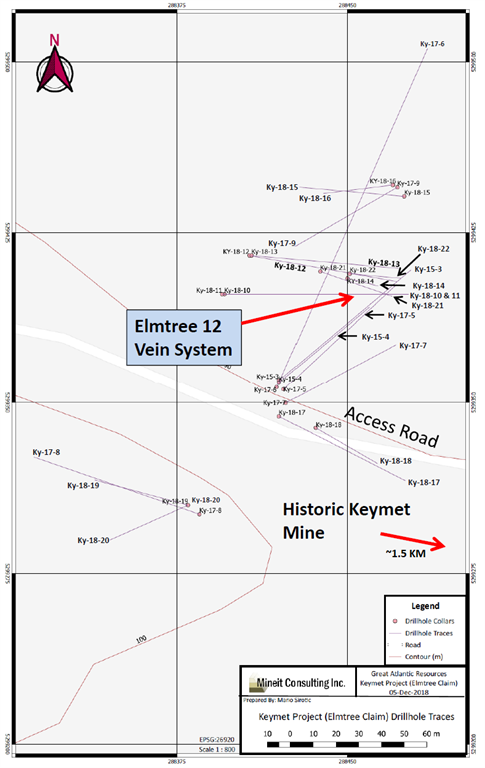
Drilling occurred in northwest region of the property, 1.5 km NW of the historic Keymet Mine.
Ky-18-14: 7.89% zinc equivalent over 34.3 meters (From 46.20 m to 80.50 m)
Elmtree 12 vein: System traced to approximately 145 meters depth, open at depth
Elmtree 12 vein: Strike length of approximately 110 meters and open along strike
The Company’s focus since acquiring the Keymet Property is the area of reported polymetallic veins with most work in the area of the Elmtree 12 copper-lead-zinc-silver bearing vein system.
At least seven vein occurrences with lead, zinc and +/- copper, silver and gold are reported in this region of the property in addition to the polymetallic veins reported at the historic Keymet Mine
FULL DISCLOSURE: Great Atlantic is an advertising client of AGORA Internet Relations Corp
Posted by AGORACOM
at 9:56 AM on Wednesday, January 23rd, 2019
Applied for a diamond drilling permit for the Company’s Golden Promise Jaclyn Main Zone (JMZ) and Jaclyn North Zone (JNZ)
In-fill drilling in west half of JMZ within conceptual pit-constrained area.
Explore along projected strike east of JNZ in area of high-grade quartz boulders (boulder samples of 163, 208 and 332 g/t gold
VANCOUVER, BC / ACCESSWIRE / January 23, 2019 / GREAT ATLANTIC RESOURCES CORP. (TSXV.GR) (the “Company” or “Great Atlantic”)
is pleased to announce it has applied for a diamond drilling permit for
the Company’s Golden Promise Gold Property, located in the central
Newfoundland gold belt. The application is for up to 50 drill holes (up
to 6,500 meters) in the northern half of the property at the Jaclyn
Zone, specifically at the Jaclyn Main Zone (JMZ) and Jaclyn North Zone
(JNZ). Pending approval of the drilling permit and financing, the
Company plans to begin drilling during spring 2019, with the following
focus:
In-fill drilling in west half of JMZ within conceptual pit-constrained area.
Both shallow and deeper drilling in central-east region of JMZ.
Provide data for up-dated JMZ mineral resource estimate, engineering studies and studies of mineralizing controls.
Explore
along projected strike east of JNZ in area of high-grade quartz
boulders (boulder samples of 163, 208 and 332 g/t gold – News Release of
August 31, 2017).
The Company recently reported a
National Instrument 43-101 mineral resource estimate for the JMZ (News
Release of December 6, 2018; and Sedar-filed National Instrument 43-101
Technical Report on the Golden Promise Property, Central Newfoundland
(revised), dated December 4, 2018 by Mr. Greg Z. Mosher, M.Sc. App.,
P.Geo., and Mr. Larry Pilgrim, B.Sc., P.Geo.). The reported inferred
mineral resource estimate for the JMZ is as follows:
Resource
Cutoff Au g/t
Au Cap g/t
Au Uncap g/t
Tonnes
Au Ounces Capped
Au Ounces Uncapped
Total
1.1
9.3
10.4
357,500
106,400
119,900
Pit-Constrained
0.6
11.4
14.1
157,300
57,800
71,200
Underground
1.5
7.5
7.6
200,200
48,600
48,700
Mineral Resources are not Mineral Reserves and do not have demonstrated economic viability.
There is no certainty that all or any part of the Mineral Resources estimated will be converted into Mineral Reserves.
Mineral
resource tonnage and contained metal have been rounded to reflect the
accuracy of the estimate, and numbers may not add due to rounding.
Mineral resource tonnage and grades are reported as undiluted.
Contained Au ounces are in-situ and do not include recovery losses
The
majority of 2019 planned diamond drill holes at the Golden Promise
Property will be in-fill drill holes in the west section of the JMZ in
the conceptual pit-constrained area. Some drilling is planned for the
central-east section of the JMZ. Historic drilling in this part of the
JMZ is less concentrated versus the west section. Planned drilling in
the central-east section of the JMZ will include near-surface drilling
to test continuation of gold mineralization to near-surface, and some
deeper holes. The drilling program will provide data for an up-dated JMZ
mineral resource estimate, engineering studies and studies of
mineralizing controls. Up to nine drill holes are planned testing
continuation of the JNZ east along projected strike. The Company
conducted trenching during 2017 along the projected east strike of the
JNZ. The trenching generally failed to reach bedrock due to thick
glacial till. However gold bearing quartz vein boulders were excavated
from multiple trenches, with some boulder samples returning high grade
gold (including 163.99, 208.51 and 332.67 g/t gold: News Release of
August 31, 2017). A qualified person managed the 2017 trenching program
and sampling and verified the analytical data.
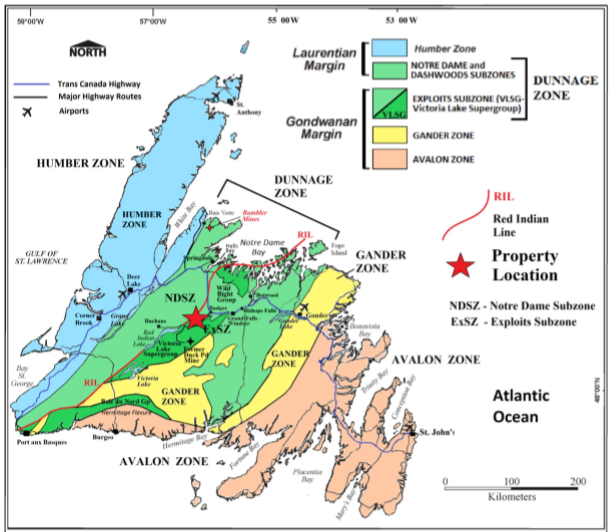
The Golden Promise
Property hosts multiple gold bearing quartz veins and is located in a
region of recent significant gold discoveries. The property is located
within the Exploits Subzone of the Newfoundland Dunnage Zone. Within the
Exploits Subzone, the property lies along the north-northwestern fringe
of the Victoria Lake Supergroup (VLSG), a volcano-sedimentary terrane.
The northwestern margin of the Golden Promise Property occurs proximal
to, and, in part, contiguous with a major (Appalachian-scale)
collisional boundary, and suture zone, known as the Red Indian Line
(RIL). The RIL forms the western boundary of the Exploits Subzone.
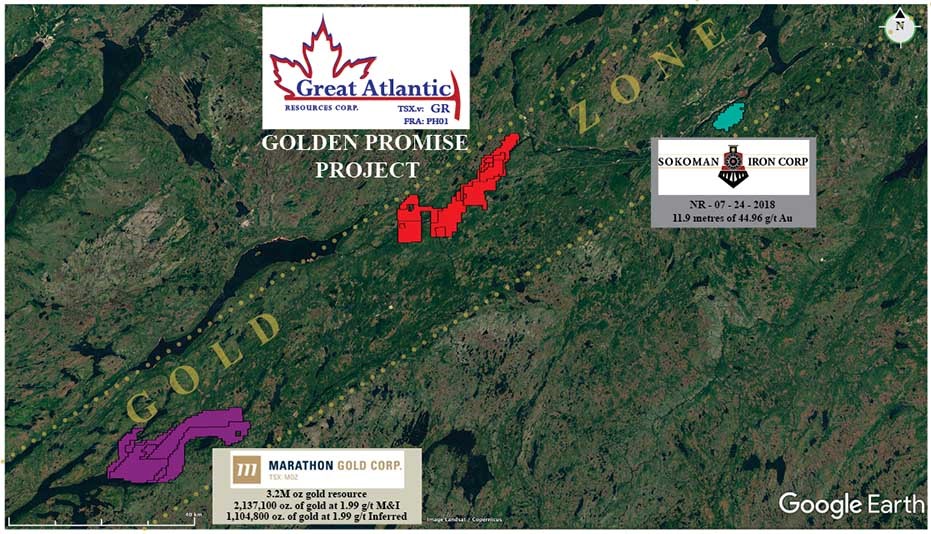
Recent significant gold discoveries in this region of the Exploits
Subzone include those of Sokoman Iron Corp. (TSXV.SIC) at the Moosehead Project and Marathon Gold Corp. (TSXV.MOZ) at the Valentine Lake Gold Camp.
Sokoman Iron Corp. (TSXV.SIC) recently
announced a high-grade gold discovery on its Moosehead Property,
located approximately 40 kilometers east-northeast of the Golden Promise
Property. The discovery was made during the 2018 diamond drilling
program. A drill intersection of 44.96 g/t gold over 11.90 meters core
length was reported including a 1.35 meters core length quartz vein
intersection of 385.85 g/t gold (Sokoman Iron Corp. News Release of July
24, 2018). The Valentine Lake Gold Camp of Marathon Gold Corp. (TSXV.MOZ) is
located approximately 55 kilometers southwest of the Golden Promise
Property. As reported on Marathon’s website, the Valentine Lake Gold
Camp currently hosts four near-surface, mainly pit-shell constrained,
deposits with measured and indicated resources totaling 2,691,400 oz. of
gold at 1.85 g/t gold and inferred resources totalling 1,531,600 oz. of
gold at 1.77 g/t. Readers are warned that mineralization at the
Moosehead Property and Valentine Lake Gold Camp is not necessarily
indicative of mineralization on the Golden Promise Property.
High-grade
gold is reported in quartz veins and quartz vein boulders within the
Golden Promise Property. Gold bearing quartz veins are reported in
multiple areas of the property, including at least 5 gold bearing quartz
vein systems reported in the Jaclyn Zone. Much of the reported
historical exploration within the property has been focused on the
Jaclyn Zone with gold bearing vein systems reported at the JMZ, JNZ,
Jaclyn South Zone, Jaclyn East Zone and Jaclyn West Zone. The majority
of historic drilling (2002-2010) was conducted at the JMZ. Gold bearing
veins and gold bearing float are reported in other regions of the
property. These include the Linda/Snow White vein in the southern region
and the Shawn’s Shot vein in the central region of the property.
As
reported in the National Instrument 43-101 Technical Report on the
Golden Promise Property, Central Newfoundland (revised), dated December
4, 2018 by Mr. Greg Z. Mosher, M.Sc. App., P.Geo., and Mr. Larry
Pilgrim, B.Sc., P.Geo., the JMZ was modelled as a single quartz vein
that strikes east-west and dips steeply to the south. Modelled vein
thickness was based on true thickness derived from quartz vein
intercepts. The estimate is based on 220 assays that were composited to
135 one-meter long composites. A bulk density of 2.7 g/cm3 was used.
Blocks in the model measured 15 meters east-west, 1-meter north-south
and 10 meters vertically. The block model was not rotated. Grades were
interpolated using inverse-distance squared (ID2) weighting and a search
ellipse that measured 100 meters along strike, two meters across strike
and 50 meters vertically. Grades were interpolated based on a minimum
of two and a maximum of 10 composites with a maximum of one composite
per hole so the grade of each block is based on at least two drillholes
thereby demonstrating continuity of mineralization. For the capped
mineral resource estimate, all assays that exceed 65 g/t gold were
capped at 65 g/t gold. All resources were classified as Inferred because
of the relatively wide spacing of drill holes through most of the zone.
Because
part of the vein is near surface the resource estimate was constrained
by a conceptual open pit to demonstrate reasonable prospects of eventual
economic extraction. Generic mining costs of US$2.50/tonne and
processing costs of US$25.00/tonne were used together with a gold price
of US$1,300/ounce. A conceptual pit slope of 45° was assumed with no
allowance for mining loss or dilution. Based on the combined
hypothetical mining and processing costs and the assumed price of gold, a
pit-constrained cutoff grade of 0.6 g/t was adopted. For the
underground portion of the resource a cutoff of 1.5 g/t was assumed. The
cutoff grade for the total resource is the weighted average of the
pit-constrained and underground cutoff grades.
Jaclyn Main Zone Total Inferred Mineral Resource Estimate
Resource
Cutoff Au g/t
Au Cap g/t
Au Uncap g/t
Tonnes
Au Ounces Capped
Au Ounces Uncapped
Total
1.1
9.3
10.4
357,500
106,400
119,900
Pit-Constrained
0.6
11.4
14.1
157,300
57,800
71,200
Underground
1.5
7.5
7.6
200,200
48,600
48,700
Mineral Resources are not Mineral Reserves and do not have demonstrated economic viability.
There is no certainty that all or any part of the Mineral Resources estimated will be converted into Mineral Reserves.
Mineral
resource tonnage and contained metal have been rounded to reflect the
accuracy of the estimate, and numbers may not add due to rounding.
Mineral resource tonnage and grades are reported as undiluted.
Contained Au ounces are in-situ and do not include recovery losses
David
Martin, P.Geo., a Qualified Person as defined by NI 43-101 and VP
Exploration for Great Atlantic, is responsible for the technical
information contained in this News Release.
About Great Atlantic Resources Corp.: Great
Atlantic Resources Corp. is a Canadian exploration company focused on
the discovery and development of mineral assets in the resource-rich and
sovereign risk-free realm of Atlantic Canada, one of the number one
mining regions of the world. Great Atlantic is currently surging forward
building the company utilizing a Project Generation model, with a
special focus on the most critical elements on the planet that are
prominent in Atlantic Canada, Antimony, Tungsten and Gold. On Behalf of the board of directors
“Christopher R Anderson“
Mr. Christopher R. Anderson “Always be positive, strive for solutions, and never give up” President CEO Director 604-488-3900 – Dir
Posted by AGORACOM-JC
at 9:18 AM on Wednesday, January 23rd, 2019
Production activities at the Beaufor Mine extended until April 2019, taking place in known stopes with a smaller workforce
Sustained positive contribution of custom milling at the Camflo mill
During the quarter, successfully completed a positive feasibility study on its Wasamac deposit (see feasibility study), which can be summarized as follows:
Projected annual average gold production of 142,000 ounces over 11 years
Pre-tax NPV of $522 million
Pre-tax IRR of 23.6%
Production cash costs of US$550 per ounce
MONTREAL, Jan. 23, 2019 – MONARQUES GOLD CORPORATION(“Monarques” or the “Corporation”) (TSX: MQR) (OTCMKTS: MRQRF) (FRANKFURT: MR7) is pleased to report its production results and corporate highlights for the second quarter ended December 31, 2018. Amounts are in Canadian dollars unless otherwise indicated.
Production highlights
Monarques produced 4,417 ounces of gold in the second quarter, up
23% from the first quarter but down 19% from 5,444 ounces last year.
The Corporation recorded revenues of $11.4 million in the second quarter from the sale of 5,169 ounces of gold at an average price of $1,656 per ounce (US $1,254),
combined with revenues from custom milling operations, which were up 2%
from the first quarter and more than 71% year over year.
“These positive results for Monarques in the second quarter reflect a
number of factors, including better grades from known stopes at the
Beaufor Mine, higher gold prices and the sustained contribution of
custom milling activities at Camflo,” said Jean-Marc Lacoste,
President and Chief Executive Officer of Monarques. “We will continue
mining the ore remaining in the known stopes at Beaufor over the next
few months, which should allow us to continue producing until April 2019.
To reduce costs and in anticipation of the upcoming suspension of
production activities at Beaufor, we stopped doing exploration and
development work a few months ago and currently have 51 employees at the
Beaufor Mine, compared to approximately 130 employees prior to the
announcement of the suspension. I would also like to thank our employees
for their outstanding performance during the quarter.”
Production statistics
Three months ended December 31, 2018
Three months ended December 31, 2017
Six months ended December 31, 2018
Six months ended December 31, 2017
Beaufor Mine
Ore processed (tonnes)
26,079
35,005
55,454
35,005
Gold recovery (%)
98.50
98.68
98.26
98.68
Ounces produced
4,417
5,444
8,325
5,444
Ounces sold
5,169
5,444
8,441
5,444
Corporate highlights
On October 23, 2018, the Corporation provided new results from the Probe Metals Inc. 2018 drilling program on the Monique property, located near Val-d’Or, Quebec (see press release).
On December 3, 2018, the Corporation reported positive results from the feasibility study prepared by BBA Inc. for the Wasamac Gold project (see press release).
On December 13, 2018, Monarques announced that it had
closed a nonâ€brokered private placement of an aggregate of 3,029,606
flowâ€through shares at a price of $0.33 per flow-through share, for aggregate gross proceeds of $999,769.98 (see press release).
On December 18, 2018, the Corporation reported that it
had consolidated its position around its Wasamac property through an
exchange of mineral claims with Globex Mining Enterprises Inc. (see press release).
Monarques Gold Corporation (TSX: MQR) is an emerging gold mining
company focused on pursuing growth through its large portfolio of
high-quality projects in the Abitibi mining camp in Quebec, Canada. The Corporation currently owns close to 300 km² of gold properties (see map),
including the Wasamac deposit (measured and indicated resource of 2.6
million ounces of gold), the Beaufor Mine, the Croinor Gold (see video), McKenzie Break and Swanson
advanced projects and the Camflo and Beacon mills, as well as other
promising exploration projects. It also offers custom milling services
out of its 1,600 tonne-per-day Camflo mill.
Forward-Looking Statements
The forward-looking statements in this press release involve known
and unknown risks, uncertainties and other factors that may cause
Monarques’ actual results, performance and achievements to be materially
different from the results, performance or achievements expressed or
implied therein. Neither TSX nor its Regulation Services Provider (as
that term is defined in the policies of the TSX) accepts responsibility
for the adequacy or accuracy of this press release.
Tags: gold, gold demand, monarques, tsx-v Posted in Monarques Gold | Comments Off on Monarques Gold $MQR.ca Produces 4,417 Ounces of #Gold and Generates $11.4 million in Revenue in its Second Quarter $GDX.ca $ECR.ca $MZZ.ca $QMX.ca $IMG.ca $IAG $MUX
Posted by AGORACOM
at 11:08 AM on Tuesday, January 22nd, 2019
Two regional scale gold in soil and lake sediment anomalies trending 15km north-south and 14km east-west
The property covers 892 square km of ground prospective for gold.
7,458 soil samples were taken on 18 grids at a 100m line spacing and 25m sample spacing across the Ashuanipi north claim block.
Results of analyses show significant gold anomalies in all but two of the 18 grids and confirm the 15km north-south anomalous trend
VANCOUVER, British Columbia, Jan. 22, 2019 (GLOBE
NEWSWIRE) — Labrador Gold Corp. (TSX-V: LAB) (“Labrador Gold†or the
“Companyâ€) is pleased to announce results from detailed gold exploration
of its Ashuanipi project in Labrador and Quebec. The exploration
program at Ashuanipi followed up on successful results of 2017 work that
outlined two regional scale gold in soil and lake sediment anomalies
trending 15km north-south and 14km east-west. The property covers 892
square kilometres of ground prospective for gold.
A
total of 7,458 soil samples were taken on 18 grids at a 100m line
spacing and 25m sample spacing across the Ashuanipi north claim block.
In addition, 61 reconnaissance soil lines were taken over claims staked
in Labrador and Quebec following the results of the 2017 work. Results
of analyses show significant gold anomalies in all but two of the 18
grids and confirm the 15km north-south anomalous trend (See figures at
www.labradorgold.com). Analyses of the soils range from below detection
limit, <0.5 parts per billion (ppb) to 8.97g/t Au, with 67 samples
containing more than 0.1g/t Au and three samples containing more than
1g/t Au in the soil. In addition, 749 soil samples with gold
concentrations greater than the 90th percentile are considered anomalous and require detailed follow up.
Gold
anomalies do not appear to correlate with specific rock types, at least
on a regional scale, but are often associated with magnetic highs which
may be indicative of a structural control on the location of the gold.
“Results
of the detailed soil sampling at Ashuanipi has confirmed the regional
nature of the gold anomalies and indicted specific areas where gold
values are elevated above 0.1g/t and possibly related to near surface
gold enrichment,†said Roger Moss, President and Chief Executive Officer
of Labrador Gold. “These anomalies enable us to focus our exploration
at specific sites along the regional anomaly to rapidly assess the
potential for gold mineralization. Work during the coming field season
will include detailed mapping, rock sampling and, if warranted, eventual
drill testing of these anomalous areas. We anticipate an exciting field
season at Ashuanipi tracking down the source of these significant gold
anomalies.â€
“Last year’s soil sampling
program further resolved the anomalous gold trend down to the 25-metre
scale,†added Shawn Ryan, Technical Advisor to Labrador Gold. “The size
and intensity of the gold targets clearly explain the large regional
gold in lake sediment anomaly and with 164 samples running over 50 ppb
Au, 67 samples over 100 ppb Au and a high of 8,973 ppb Au it appears
that we truly have a robust mineralized system. These areas will be the
focus of aggressive exploration next season to identify high quality
drill targets.â€
The company also announces
that its major shareholder, Plethora Precious Metals Fund (‘Plethoraâ€)
has exercised 3,125,000 warrants at an exercise price of $0.13. Plethora
now holds 9,750,000 shares of the company representing 17.45% of the
issued and outstanding shares. We appreciate the continued support of
Plethora and their confidence in the exploration strategy of our
technical team.
All samples were dried in the
field before being shipped to the Bureau Veritas preparation laboratory
in Timmins, Ontario, with analyses completed at the Vancouver
laboratory. Samples were analyzed for gold and another 36 elements by
ICP-MS (inductively coupled plasma-mass spectrometry) following an aqua
regia digestion. The company routinely submits blanks, field duplicates
and certified reference standards with batches of samples to monitor the
quality of the analyses.
Roger Moss, PhD., P.Geo., is the qualified person responsible for all technical information in this release.
About Labrador Gold:
Labrador
Gold is a Canadian based mineral exploration company focused on the
acquisition and exploration of prospective gold projects in the
Americas. In 2017 Labrador Gold signed a Letter of Intent under which
the Company has the option to acquire 100% of the 896 square kilometre
(km2) Ashuanipi property in northwest Labrador and the Hopedale (458 km2) property in eastern Labrador.
The
Hopedale property covers much of the Hunt River and Florence Lake
greenstone belts that stretch over 80 km. The belts are typical of
greenstone belts around the world but have been underexplored by
comparison. Initial work by Labrador Gold during 2017 show gold
anomalies in soils and lake sediments over a 3 kilometre section of the
northern portion of the Florence Lake greenstone belt in the vicinity of
the known Thurber Dog gold showing where grab samples assayed up to
7.8g/t gold. In addition, anomalous gold in soil and lake sediment
samples occur over approximately 40 kilometres along the southern
section of the greenstone belt (see news release dated January 25th 2018 for more details). Labrador Gold now controls approximately 57km strike length of the Florence Lake Greenstone Belt.
The
Ashuanipi gold project is located just 35 km from the historical iron
ore mining community of Schefferville, which is linked by rail to the
port of Sept Iles, Quebec in the south. The claim blocks cover large
lake sediment gold anomalies that, with the exception of local
prospecting, have not seen a systematic modern day exploration program.
Results of the 2017 reconnaissance exploration program following up the
lake sediment anomalies show gold anomalies in soils and lake sediments
over a 15 kilometre long by 2 to 6 kilometre wide north-south trend and
over a 14 kilometre long by 2 to 4 kilometre wide east-west trend. The
anomalies appear to be broadly associated with magnetic highs and do not
show any correlation with specific rock types on a regional scale (see
news release dated January 18th 2018). This suggests a
possible structural control on the localization of the gold anomalies.
Historical work 30 km north on the Quebec side led to gold intersections
of up to 2.23 grams per tonne (g/t) Au over 19.55 metres (not true
width) (Source: IOS Services Geoscientifiques, 2012, Exploration and
geological reconnaissance work in the Goodwood River Area, Sheffor
Project, Summer Field Season 2011). Gold in both areas appears to be
associated with similar rock types.
The Company has 55,864,022 common shares issued and outstanding and trades on the TSX Venture Exchange under the symbol LAB.


